Atmospheric and Climate Sciences
Vol. 3 No. 1 (2013) , Article ID: 27586 , 15 pages DOI:10.4236/acs.2013.31017
Diagnostic Study of a Severe Thunderstorm over Jeddah
Department of Meteorology, Faculty of Meteorology, Environment, and Arid Land Agriculture, King Abdulaziz University, Jeddah, KSA
Email: heshmatm@yahoo.com
Received November 3, 2012; revised December 5, 2012; accepted December 13, 2012
Keywords: Potential Vorticity; Cyclogenesis; Convection; Topography; Jeddah; Blocking: Eastern Mediterranean
ABSTRACT
Several aspects of the interaction between midlatitude and subtropical systems are investigated using a case study and a potential vorticity (PV) framework. Our case study occurred on 25 November 2009; Jeddah and other regions in Western Saudi Arabia were hit by heavy rainstorms. The analysis of absolute, relative, and potential vorticity implies the significance of the lower level dynamics in the initiation of this case of cyclogenesis. The impact of the severe convective weather process caused more than 90 millimeters of rain to fall in Jeddah in just four hours. The analysis indicates that the heavy rainfall was due to the existence of an upper level cold trough in the Eastern Mediterranean and a warm blocking high situated over southeastern Saudi Arabia and the Arabian Sea. In addition, an evident low level shear line set up in the northwest of Jeddah, and the southeast movement of the shear line caused dynamic lifting and unstable energy release over Jeddah. The water vapor transport occurred primarily below 700 hPa, and a low level jet transported the water vapor from the Red Sea to central Saudi Arabia. Furthermore, the blocking high in southern Saudi Arabia was favorable for maintaining water vapor passage for a long time. The topography of Jeddah also played a role in the enhancement of convection.
1. Introduction
Potential vorticity (PV) diagnostics have been used extensively to gain a better understanding of the life cycles of cyclonic storms through case-studies and idealised simulations [1-9]. The results of these studies have contributed to the introduction of new conceptual models of cyclogenesis. However, their focus is mainly on extratropical cyclones and hurricanes. Cyclogenesis over the central Mediterranean region has become the subject of considerable research [10-14]. Such significant synoptic-scale events cause intense winds, precipitation, and temperature drop. Because of the intimate connection between the phenomena and local weather prediction, interest in understanding the characteristics of cyclogenesis over this region is enormous and ongoing.
The structure of cyclones is often conceptualised in terms of three types of anomalous PV [2,4,5,7]. These consist of upper-level PV (UPV) anomalies, considered to be of stratospheric origin, lower tropospheric PV (LPV) anomalies, generated by diabatic effects, and surface potential temperature anomalies, which can be viewed as a thin layer of PV at the surface. [7] found that strong latent heat release in a cyclone produced a negative UPV anomaly in addition to a positive LPV anomaly. Since diabatic effects can reduce PV at upper levels, some authors [7,15] have distinguished this reduced upper-level PV (RUPV) from anomalous UPV of stratospheric origin. According to [1], the potential vorticity analysis of an isentropic surface summarizes the combined effect of the vorticity and temperature advection and allows the estimation of the vertical motion. In addition, the conservation of the isentropic potential vorticity in adiabatic processes allows the identification and examination of nonconservative processes, such as latent heat release and friction, while the inevitability principle allows the quantitative estimation of the effect of these processes. The objective of the present work is to diagnose a case of cyclogenesis in the context of isobaric vorticity and potential vorticity analysis in order to examine in detail the key dynamical aspects of the development.
2. Data and Methodology
2.1. Data
The data used in this study have been taken from the archives of the European Center for Medium-Range Weather Forecasts. It consists of the horizontal wind components (u-eastward, v-northward), the temperature (T) and the geopotential height (z) on regular latitude-longitude grid resolution of 2.5˚ × 2.5˚ for the isobaric levels 1000, 850, 700, 500, 400, 300, 250, 200, 150, and 100 hPa. The data used was recorded at 0000, 0060, 1200, and 1800 GMT during the period 23 to 26 November 2009. The domain of study extends from 10˚W to 60˚E and from 10˚N to 70˚N.
2.2. Estimation of Potential Vorticity
Potential vorticity fields were calculated from the available meteorological parameters, namely temperature and the horizontal wind components on constant pressure surface. For isobaric coordinates the potential vorticity was approximated by the product of the vertical components of absolute vorticity and potential temperature gradients as:
 (1)
(1)
where f is the Coriolis parameter, q is the potential temperature, u is the wind in x-direction of the grid (W-E in principle) and v is the wind in y-direction. Following the [16], the dynamic tropopause is defined by the potential vorticity with P = 1.6 × 10⁻⁷ Kpa–1·s–1 = 1.6 PVU, where, for convenience, the potential vorticity unit (PVU) is defined to be ×10–7 Kpa–1·s–1.
Cantered finite differences were used to compute horizontal derivatives and all vertical derivatives except those at the 1000 and 100 hPa levels, where non-centered differences were employed. The vertical motion, w, is computed using the Q-vector representation of the quasigeostrophic w equation by using the relaxation method [17]. The relative vorticity and absolute vorticity advection have been calculated from the actual data using the central finite differences method.
3. Synoptic Discussion
On November 25, 2009, heavy rainstorms hit Jeddah, Makah, and other regions in western Saudi Arabia. More than 90 millimeters of rain fell in Jeddah in just four hours. This is nearly twice the average amount for an entire year and the heaviest rainfall in the Kingdom of Saudi Arabia (KSA) in a decade. A case of winter cyclogenesis over the Mediterranean extending from 23/00 to 26/12 November 2009 is considered in the present study. Based on 1000 hPa and 700 hPa charts, the life cycle of this cyclone can be divided into two periods. The first period (growth) is from 23/00 to 25/12 November; the second period (decay) is from 26/06 to 27/12 November. Charts for 1000 hPa and 700 hPa at 0000 and 1200 GMT on each day of the period 23/00 to 26/12 are shown in Figures 1 and 2, respectively. The 1000 and 700 hPa charts depict contours of height with 20 geopotential meter (gpm) increments. The isotherms in the charts of the two levels are analyzed with 5˚C increments. At 23/00 November, Figure 1(a) shows that the subtropical high pressure dominates over North Africa and the Mediterranean area and extends east to cover the north of the KSA and eastern Mediterranean countries. The figure also illustrates that the Sudan low and its associated inverted v-shaped trough (Red Sea trough) oscillate northward to cover eastern Egypt and the entire Red Sea region. An obvious thermal gradient associated with the northward oscillation of the Red Sea trough extends zonally to cover the southern portion of the KSA and northern Sudan. During the next 12 hours (23/12), the subtropical high weakens and moves eastward, while the Red sea trough propagates slowly northward and the Sudan low deepens to 80 gpm (Figure 1(b)). The cyclone of special interest first appeared as an extension of the traveling depression eastern Mediterranean at 23/00 November (Figure 2). A cut-off low is formed at 23/12 November and a well-defined cyclonic depression becomes clear over Egypt (Figure 2(b)). At 23/00 November a thermal gradient lies along the northeast of the KSA. This baroclinic zone leads to the formation of an upper level cut-off low. At 24/00 November a strong development occurs at the surface and at upper air, where the Sudan low at the surface and its associated Red Sea trough moves northward to cover the northern portion of the Eastern Mediterranean, Egypt, and the KSA. The Sudan low centers over Red Sea at 15˚N and 37.5˚E; the geopotential height at the center reaches 100 gpm. In the upper air (700 hPa) the cut-off low deepens and moves slowly eastward to a point just north of Egypt; the geopotential height at the center reaches 3100 gpm (Figure 2(c)). During the next 12 hours (24/12) the inverted vshaped trough associated with the Sudan low oscillates northward and in the upper air (700 hPa) the cut-off low also moves eastward to a point just northeast of Egypt. During the period 24/18 to 25/12 November (the rainy period), a strong interaction occurs between the inverted v-shaped troughs extending from the tropical region and from the middle latitude region; the two cyclones merge. The most interesting features are the strong northward warm advection from the tropical region associated with the air flow around the Sudan low and the strong southward cold advection. The interaction between these two air masses causes a strong instability over the Eastern Mediterranean and western Saudi Arabia.
After 25/12 November, the inverted v-shaped trough of the Sudan low moved in a southwesterly direction and the upper air trough retreated westward toward the associated cut-off low centered over northwestern Egypt; the interaction between the two troughs vanishes. During the next day (26 November) the depression starts to weaken and its central pressure increases gradually. On the other hand, the subtropical high pressure over North Africa and

Figure 1. 1000 hPa height contour in 20 m intervals (solid) and temperature (dotted) in 5˚C increments for 23/00-26/12 UTC November 2009.
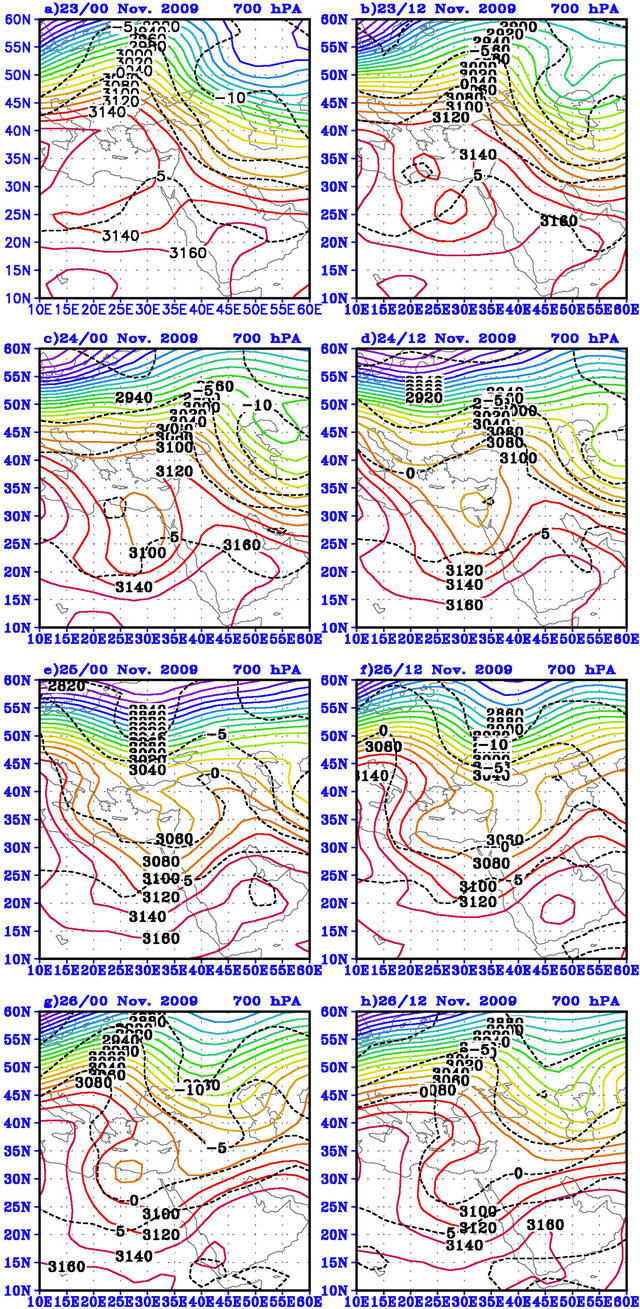
Figure 2. 700 hPa height contours in 20 m intervals (solid) and temperatures (dashed) in 5˚C increments for 23/00-26/12 UTC November 2009.
the Western Mediterranean is extended with a major ridge that joins the Siberian high on 27 November. In other words, no more cold advection is permitted to the cyclone. While the Siberian high pressure propagates westward, the horizontal extension of the cyclone decreases and moves slowly eastward. It becomes a stationary vortex rotating above the northeastern portion of the Mediterranean (Figures 2(g) and (h)). Finally the cyclone drifts slowly northeastward and leaves the area by 28 November.
4. Isobaric Vorticity Analysis
It has been recognized that central and eastern Mediterranean cyclogenesis is usually forced by a variety of upper-level tropospheric features; the lower tropospheric physical and dynamic processes follow [10,12,18]. This is associated with Helmholtz’ theory, which supports the controlling of the relation between low-level baroclinicity and upper-level forcing of surface cyclogenesis.
4.1. Genesis of the Initial Disturbance at the Upper Levels
It is known that the subtropical jet and polar jet reach maximum speeds at approximately 200 and 300 hPa, respectively. Therefore, to show the behavior of the subtropical and polar jets during the development of the events involved in this case study, we focus on the 200 and 300 hPa isotach fields in the following discussion. Figures 3 and 4 display the isotachs (wind speed) at 200 and 300 hPa from 24/06 to 26/00 November 2009, respectively.
At 24/00 an omega-shaped blocking over the Northeast Atlantic and Western Europe dominated the largescale upper tropospheric circulation with a strong northwest-southeast jet stream on its eastern flank (Figure 4). Because of the warm advection in the region of the jet streak, the ridge propagated slowly northeastwards, resulting in the amplification of the long wave. On 24/12 November 2009 (Figure 3(b)) the wind direction over North Africa was almost zonal and the maximum speed of the subtropical jet was 45 m/s and was located over northeastern Africa (Libya, Egypt, and the northern portion of the Red sea). The polar jet extended from northwest England to southeast Spain and north of Italy with a maximum wind greater than 60 m/s at 300 hPa; its extension at 200 hPa had a maximum wind greater than 50 m/s.
As the polar jet streak moved southeastward, it continuously advected cold air southward. Consequently, in the following twenty-four hours, the baroclinicity ahead of the ridge increased and the jet streak moved southward. The synoptic situation at 300 hPa at 24/18 November and 25/00 November (Figures 4(c) and (d)) is particularly important for the subsequent development. On 24/18 November, the subtropical jet moved slightly northeastward, i.e., over Egypt, and its maximum center became greater than 40 m/s at 300 and 200 hPa. At the same time, the polar jet moved southeastward to amalgamate with the subtropical jet, and its maximum value became greater than 60 m/s at 300 hPa. At 25/00 November, associated with relative vorticity maximum of 1.0 × 10⁻⁶ s–1 at 500 hPa and 1.4 × 10⁻⁶ s–1 at 300 hPa (not shown) and increased baroclinicity at these levels, the system became cut off at all isobaric levels. Ahead of and parallel to the polar jet stream, a frontal surface low located over Italy became very pronounced. When this type of atmospheric circulation dominates at the upper levels, intense surface cyclogenesis over the central Mediterranean is likely to be initiated, assuming favorable low level conditions [10].
On 25/06 November 2009, the subtropical jet shifted to the southeast. The polar front jet reached northern Algeria, and its maximum wind value was greater than 50 m/s at 300 and 200 hPa. The subtropical jet weakened at 300 hPa and became stronger at 200 hPa (>50 m/s) and moved eastward. The maximum amalgamation of the two jets occurred on 24/06 November 2009. Starting on 25/12 November and continuing to 26/00 November 2009, the polar jet became very weak at 300 hPa and its extension to 200 hPa disappeared. In addition, we noticed that the subtropical jet had moved eastward and was almost back to normal distribution in both speed and direction.
4.2 Initiation of the Surface Cyclogenesis
Figure 5 shows the field of relative vorticity at 850 hPa during the period of study over the domain containing the area of interaction between the two air masses associated with the Sudan low and the traveling Mediterranean cyclone. It shows that the relative vorticity undergoes changes of magnitude, orientation, and horizontal extension from time to time. At 24/00 there is a cell of higher positive relative vorticity over the eastern Mediterranean that extends southward to cover eastern Egypt, the Red Sea and western Saudi Arabia. The center of the maximum value (2 × 10⁻⁵ s–1) is located at (22.5˚N, 37.5˚E). During the next 6 hours the cell with higher positive relative vorticity moved south eastward and covered most of the Eastern Mediterranean, Egypt, the Red Sea, and the western portion of the Arabian Peninsula. By 24/18 the area the cell covered extended and moved eastward; the maximum values occurred over northwestern Saudi Arabia.
During the next 6 hours the cell underwent a change in origination and magnitude. It had two centers with maximum values greater than 1.5 × 10⁻⁵ s–1; the first was
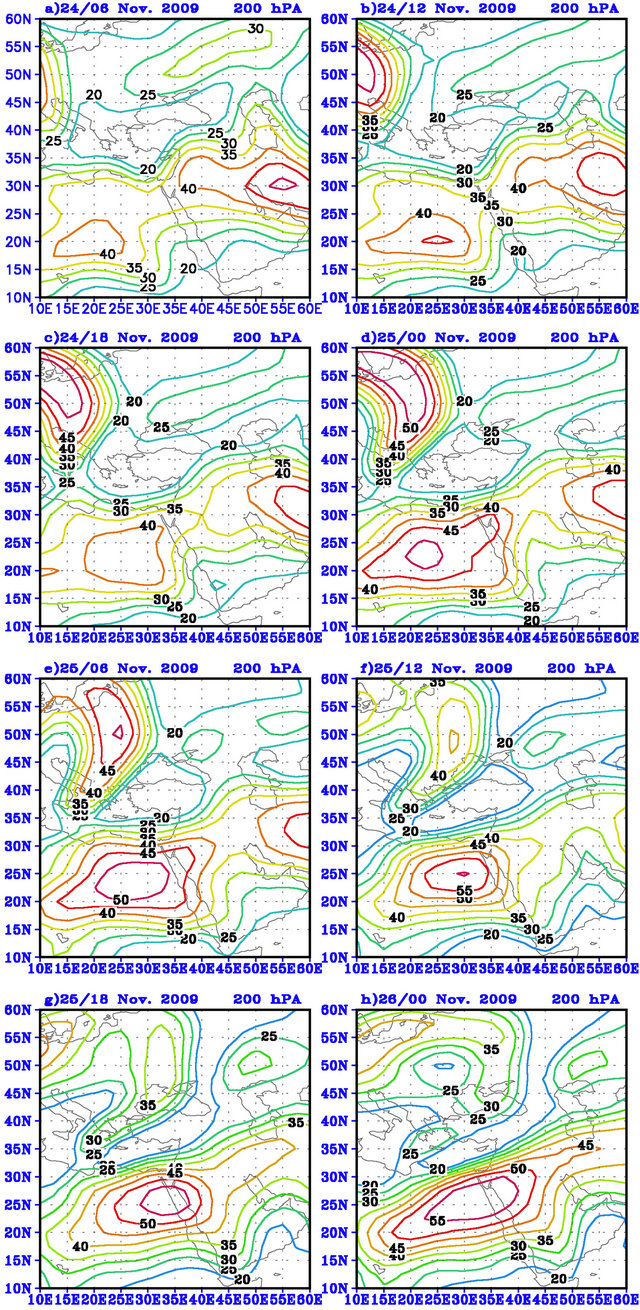
Figure 3. Isotachs at 200 hPa greater than 20 m/s; Isotach interval is 5 m/s for 24/06-26/00 UTC November 2009.

Figure 4. 300 hPa height contours in 40 m intervals (dotted) and contours of the jet streams (solid) greater than 20 m/s for 24/06-26/00 UTC November 2009.
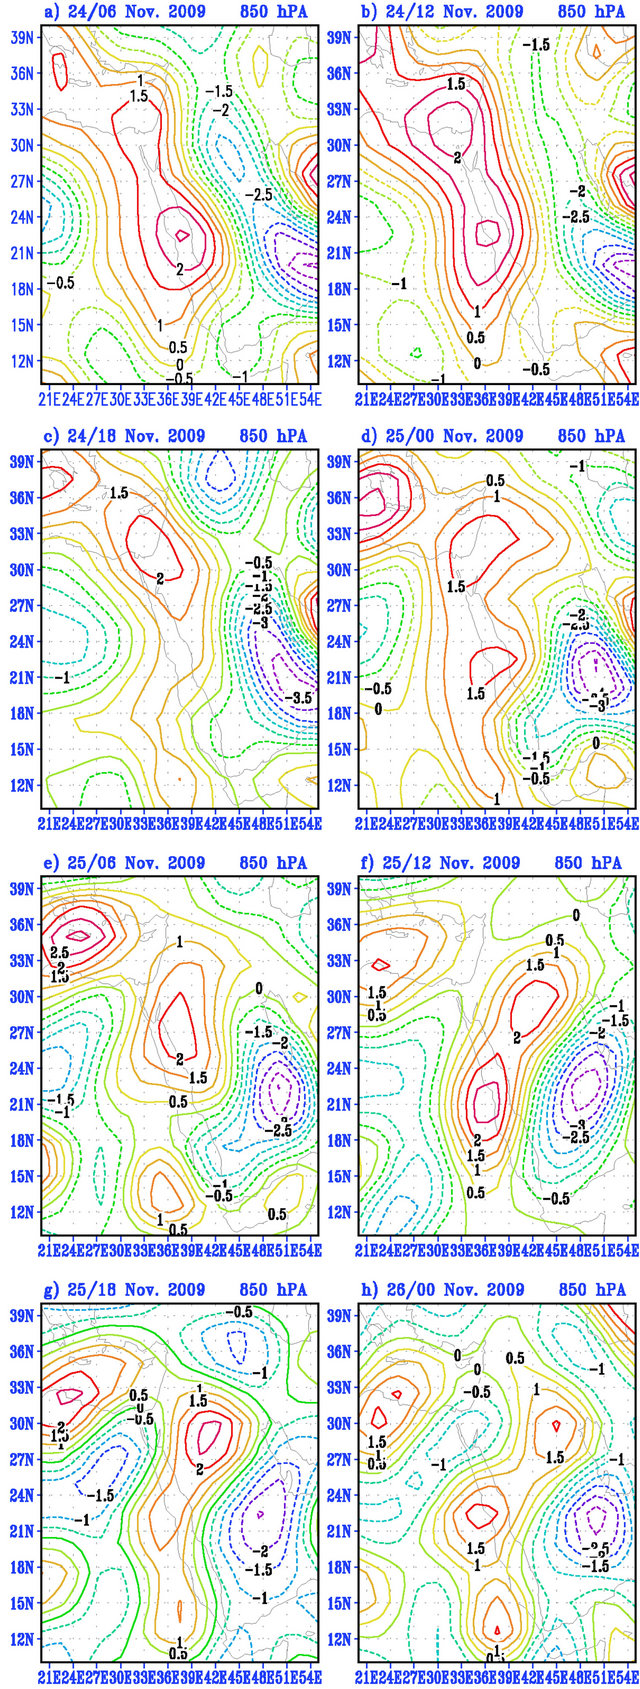
Figure 5. Relative vorticity at 850 hPa; contour interval is 1 × 10⁻⁵ s–1, (solid) lines denote positive values, (dotted) lines denote negative values for 24/06-26/00 UTC November 2009.
over the Southeastern Mediterranean and the second was in the middle of the Red Sea, an area of heavy rainfall. In the following 6 hours the two centers combined and appeared over northeastern Saudi Arabia. In the last three times the values of the center of relative vorticity moved slowly in a northeasterly direction.
Figure 6 shows the relative vorticity at 500 hPa during the period of interest. Attention is focused on the center of maximum relative vorticity (5.5 × 10⁻⁵ s–1) located over northern Egypt (Figure 6(a)). After 6 hours, the center had moved southeastward. On 24/18 November, the center moved eastward and originated at (30˚N, 37.5˚E). By 25/00 November the maximum positive vorticity located at (30˚N, 37.5˚E) moved northeastwards and had a value of 4.5 × 10⁻⁵ s–1 over (32.5˚N, 39˚E). Figure 6(e) shows that the cell of positive relative vorticity occupies a large area of the domain; however, the maximum increases to 4 × 10⁻⁵ s–1. At the last three times the positive vorticity values continued to occupy the Eastern Mediterranean, Egypt, and the northern portion of the KSA.
Figure 2(c) indicates that a synoptic-scale wave is present over Europe at the isobaric level of 700 hPa and the ridge-trough pattern shows a NE-SW tilt. The jet wind maximum is 65 m·s–1 at 300 hPa (Figure 4(c)). The wind speed decreased along the jet stream axis from the west to the east side of the trough resulting in an increase of the mean absolute vorticity advection in its region [19]. Indeed, the left side region of the jet stream axis (polar jet) is characterized by positive advection of absolute vorticity, which was moving rapidly southwards. According to [20,21], this synoptic situation is a precursor to cyclonic development. In association with the absolute vorticity advection, the Eastern Mediterranean and western Saudi Arabia were covered by a field of ascending motion at the isobaric level of 700 hPa, with the strongest ascent of 0.2 Pa·s–1 over western Saudi Arabia (Figure 7(c)). The positive relative vorticity had increased to 4.5 × 10⁻⁵ s–1 over the Eastern Mediterranean by 25/00 November, while the entire Southeastern Mediterranean was characterized by positive absolute vorticity advection, implying the deepening of the upper trough.
The maximum absolute vorticity advection, where the ascending motion becomes as high as 0.3 Pa·s–1 at 700 hPa, was located in the middle of western Saudi Arabia (Figure 7(d)). The relative humidity at 700 hPa was more than 90%, as shown in Figure 8(d). According to the 1000 hPa analysis (Figure 1(d)), the low-pressure center had developed over this area by 25/00, as the frontal zone, under the maximum absolute vorticity advection, had moved to the same region (Figure 6(d)).
It is noteworthy that the surface cyclogenesis over the Central and Eastern Mediterranean had intensified. The 300 hPa isotach analysis (Figure 4(d)) suggests that the

Figure 6. Relative vorticity at 500 hPa; contour interval is 1 × 10⁻⁵ s–1, (solid) lines denote positive values, (dotted) lines denote negative values for 24/06-26/00 UTC November 2009.
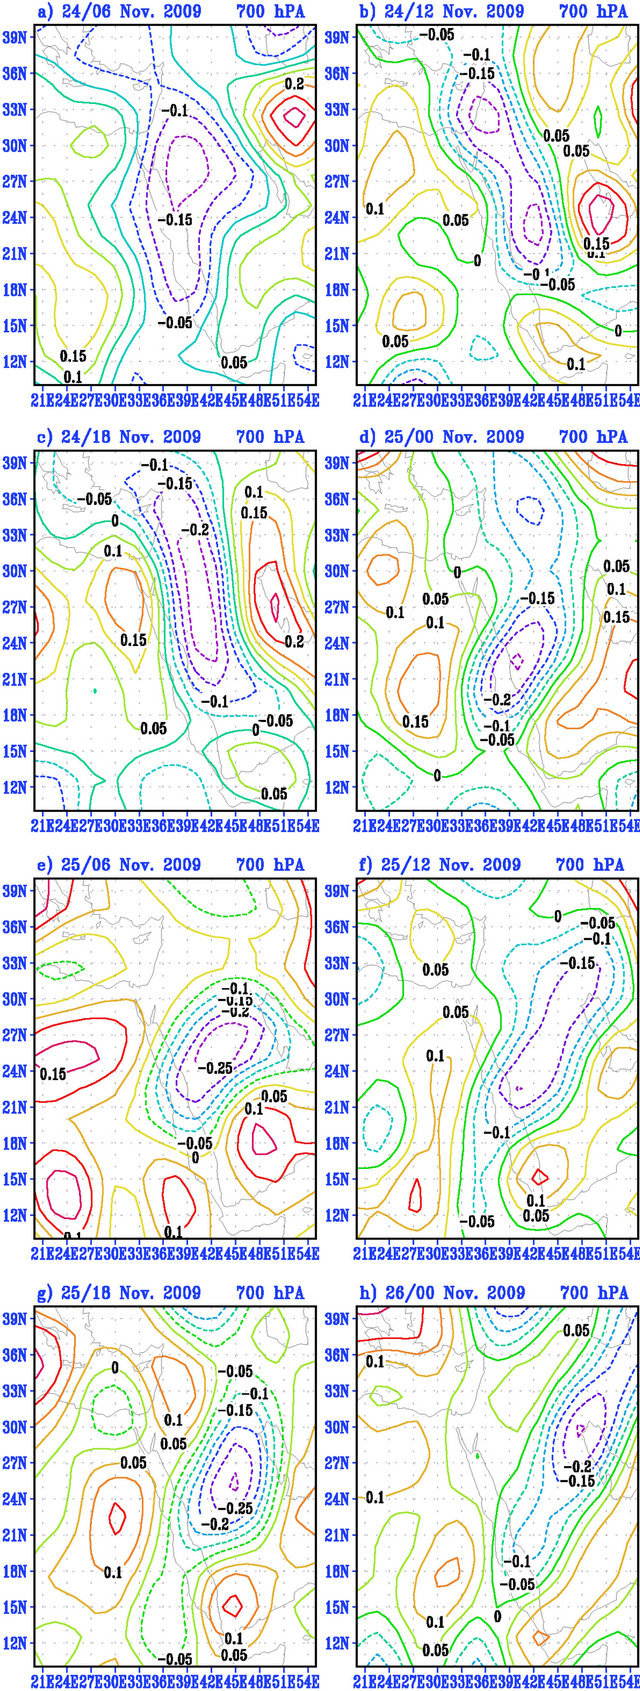
Figure 7. Vertical motion at 700 hPa, contour interval is 0.1 Pa·s–1, (solid) lines denote positive values, (dotted) lines denote negative values for 24/06-26/00 UTC November 2009.
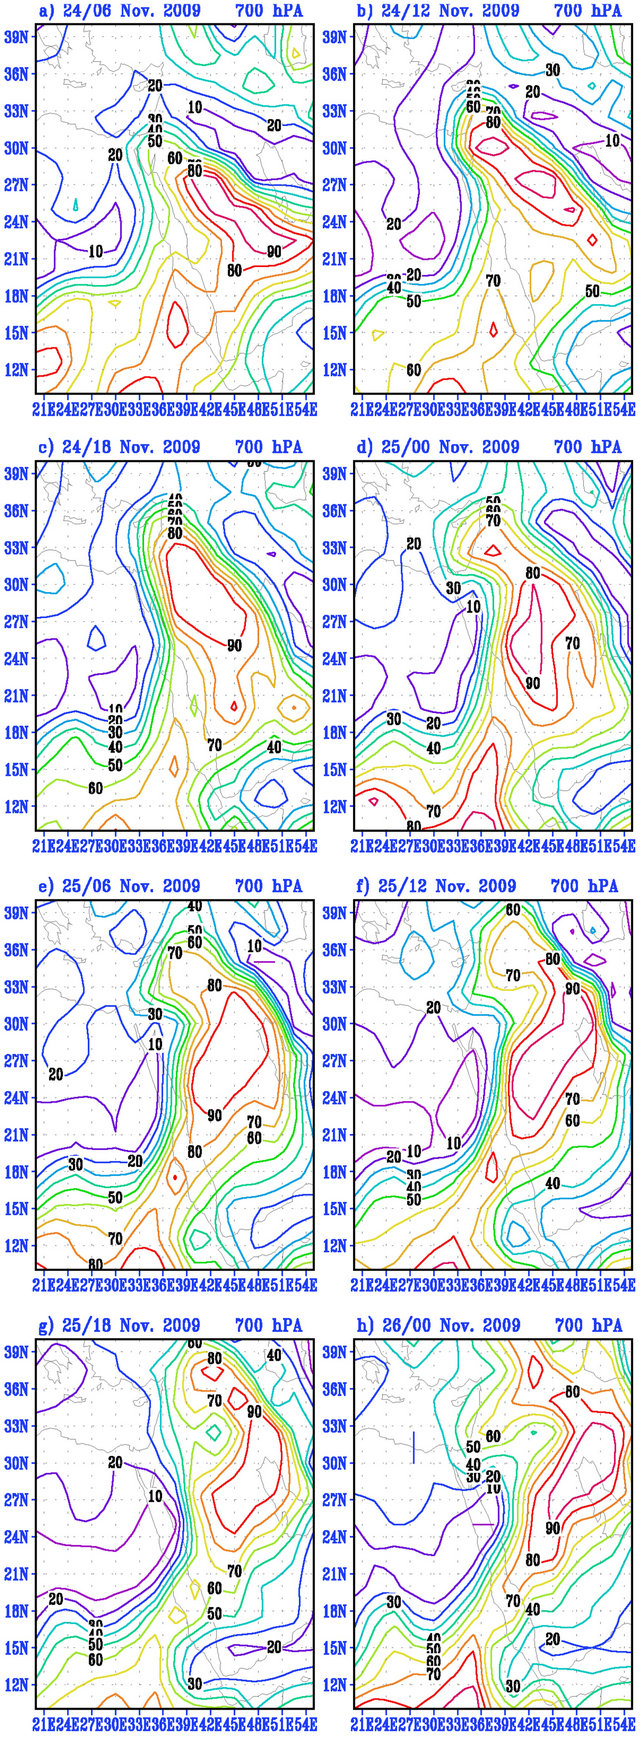
Figure 8. Relative humidity at 700 hPa; contour interval is 10% for 24/06-26/00 UTC November 2009.
northerly polar frontal jet, curved cyclonically over the Central Mediterranean, tended to interact with the westerly subtropical jet that was propagated along the Libyan coast. By 25/06, as the orientation of the trough axis at 700 hPa changed from NE-SW to N-S, extensive cyclonic development is marked and the low center at 700 hPa tended to develop (Figure 2(d)). The surface lowpressure system became circularly organized and deepened between longitudes 32.5 - 42.5˚E, indicating a strong baroclinic atmospheric environment. The maximum value of relative vorticity is in excess of 4.5 × 10⁻⁵ s–1 (Figure 6(d)). The ascent pattern had drifted eastwards over the same region, peaking at 0.3 Pa·s–1 at 700 hPa ahead of the surface system (Figure 7(d)). A major factor allowing the surface low to convert available potential to kinetic energy is the advection of sinking cold air behind the low and the advection of ascending warm air ahead of the low. This is especially evident at the 700 hPa isobaric level (Figure 7(d)). In the last three hours the system moved eastward slowly and weakened gradually.
5. Potential Vorticity Analysis
In order to highlight the dynamical significance of the most important features that the synoptic overview and the relative vorticity analysis revealed, and to identify other distinct characteristics of the development, a PV analysis was carried out. In particular, the horizontal distributions of isobaric PV at 300 and 850 hPa have been used to examine the upper and lower level development.
5.1. Upper Level Development
Figure 9 summarizes the evolution of the PV field at the 300 hPa level from 24/06 to 26/00 November 2009. Figure 9(a) displays an obvious anomaly of magnitude 2.2 PVU located north of Egypt (over the Eastern Mediterranean) that represents and accompanies the cyclone of interest. From Figure 9(b), it is evident that within 6 hours the PV maximum propagated slightly eastwards and its magnitude became 2 PVU. The important feature in Figure 9(b) is that the PV trough of the anomaly extended southwards up to northwestern Saudi Arabia in a NW-SE direction. On 24/18 November (Figure 9(c)), the main core of the PV trough was located over the Southeastern Mediterranean and coincided with the 700 hPa low-pressure center, which actually developed at the same time scale. An area of low PV values appeared ahead of the PV trough over eastern Saudi Arabia and the Red Sea. By 25/00 November, the PV trough propagates southeastwards involving advection on its southern edge, while the PV anomaly reached the maximum value of 2 PVU (Figure 9(d)). As well, also, it can be seen that the PV trough became more horizontally oriented at its southern edge. By 25/06 November, the extension of the
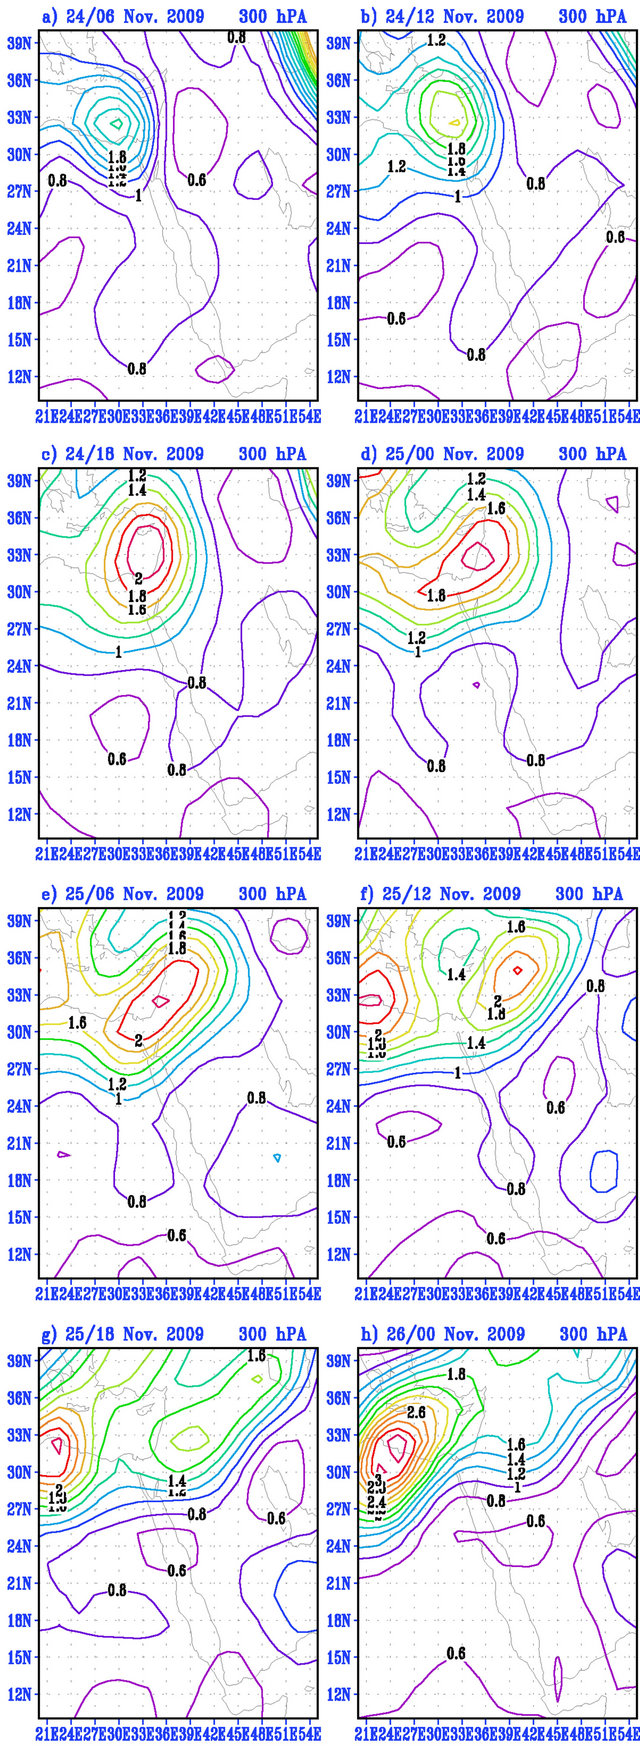
Figure 9. Ertel’s potential vorticity on 300 hPa; contour interval is 0.5 PVU for 24/06-26/00 UTC November 2009. 1 PVU = 10–6 M2·K·Kg–1·s–1.
main tough had extended horizontally over northern Saudi Arabia and moved slowly eastwards. The PV gradients at its southern edge have increased significantly. On 25/12 November, the PV trough continued to extend latitudenally and the associated maximum moved northeastwards. As can be seen from Figures 9(g) and (f), the low becomes a stationary vortex rotating above the Northeastern Mediterranean and north of the KSA.
5.2. Lower Level Development
Figure 10 presents the PV analysis at 700 hPa for the period from 24/06 to 26/00 November 2009. Figure 10(a) displays two distinct anomalies, all to the southeast of the upper level anomaly: 1) One, of magnitude 1.1 PVU, is located south of Egypt; 2) The second is located over the southern part of the KSA. The second anomaly is associated with values of R.H. greater than 80% (Figure 8). It should be noted that the first anomaly is the signature of the upper PV trough at the level of 700 hPa, which implies that this anomaly not connected to stratospheric air, but rather originated at low levels. According to Figure 10(b), within 6 hours the second PV maximum propagated slightly westward and situated over western Saudi Arabia. On the 24/18 November, when the low level wind pattern, associated with the surface development, indicated a rapid intensification of the northeasterly and southeasterly flow over western Saudi Arabia (Figure 10(c)), the second low level PV anomaly propagated further to the southwest. At 25/00, when the system indicated cut off at all the isobaric levels, the gradient of the PV anomaly increases generally northward. As the dynamic support from the upper levels decreased (Figure 10(d)), the low levels appear to play a more important role. It is interesting to note that the second maximum is associated with high values of relative humidity, up to 90% at 700 hPa, while the first maximum is associated with low values of R.H., less than 20%. The region containing the second maximum occurs in the area of ascending motion, while the region containing the first maximum occurs in the area of descending motion. The center of the anomaly located at (21˚N, 45˚E) moved slowly to the southwest. As shown in Figure 10(e), within 6 hours the PV maximum propagated in a southerly direction and reached the south of the center of Red Sea. At the end of the period the area of PV anomalies are associated with values of R.H. greater than 80%.
6. Divergent Wind Analysis
It is possible to recover much of the observed divergence field through the iterative procedure used by [2]. Figures 11 and 12 illustrate the divergent horizontal wind at 1000 and 500 hPa for the period 24/06 to 26/00 November 2009. Figure 11 illustrates the regions of convergence and divergence at 1000 hPa in our domain of study throughout
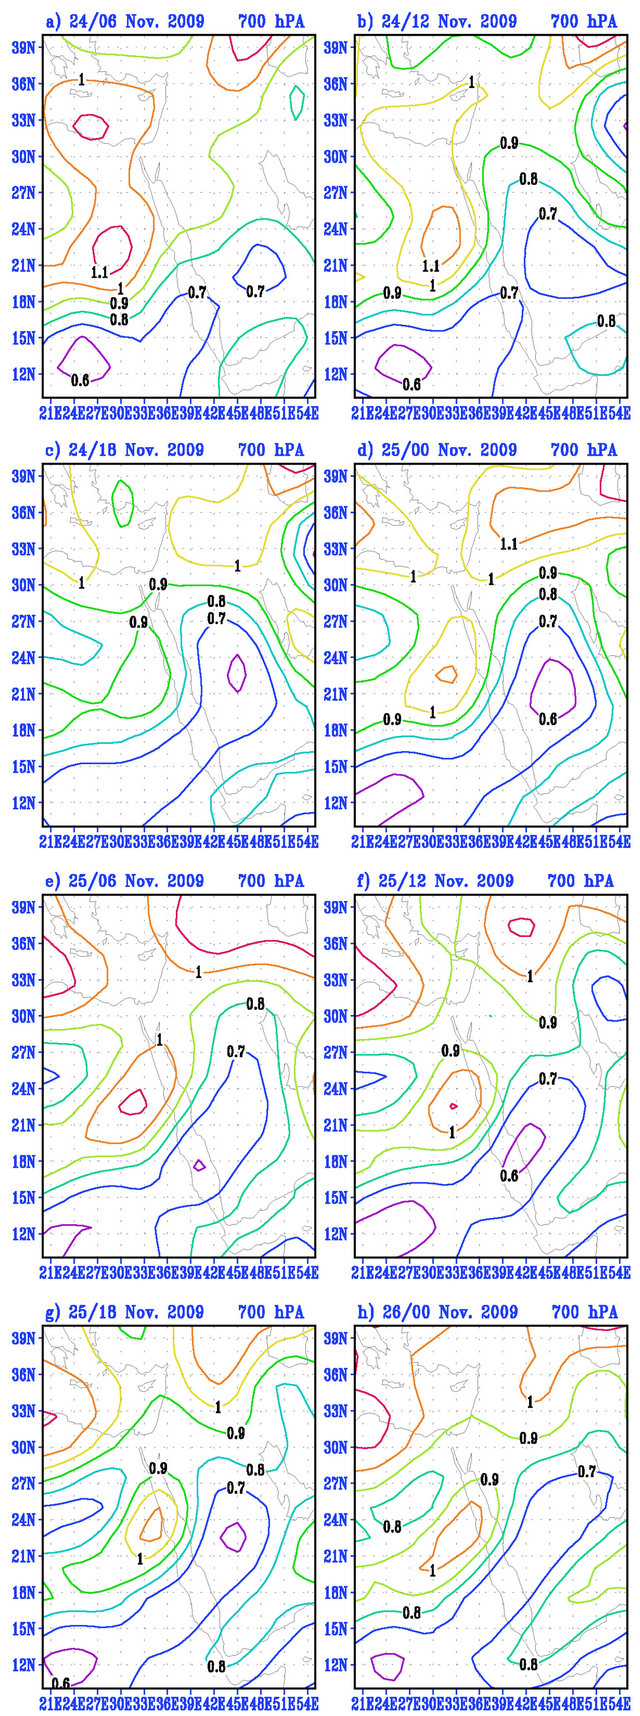
Figure 10. Ertel’s potential vorticity on 700 hPa greater than 0.4 PVU; contour interval is 0.1 PVU for 24/06-26/00 UTC November 2009. 1 PVU = 10–6 M2·K·Kg–1·s–1.
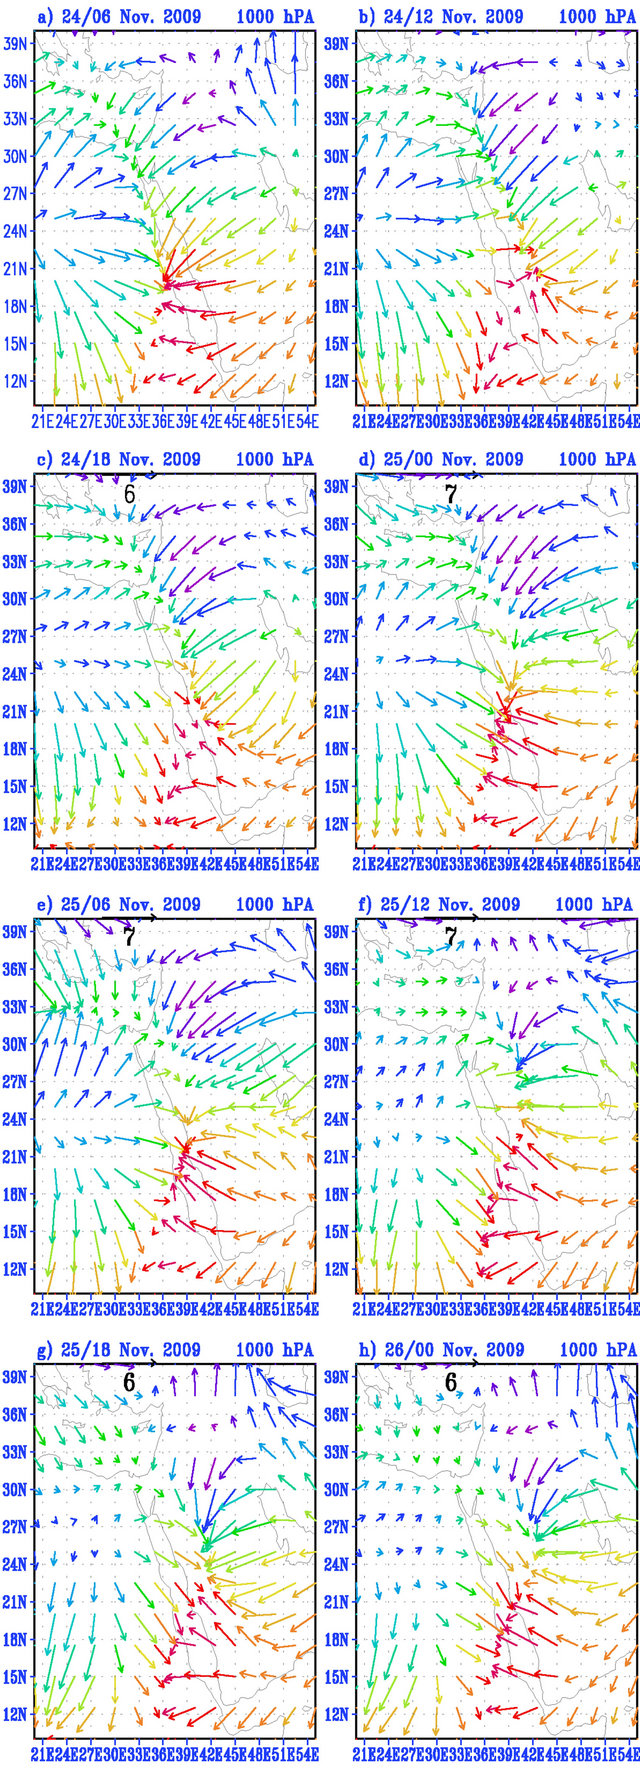
Figure 11. Irrotational winds at 1000 hPa for 24/06-26/00 UTC November 2009.
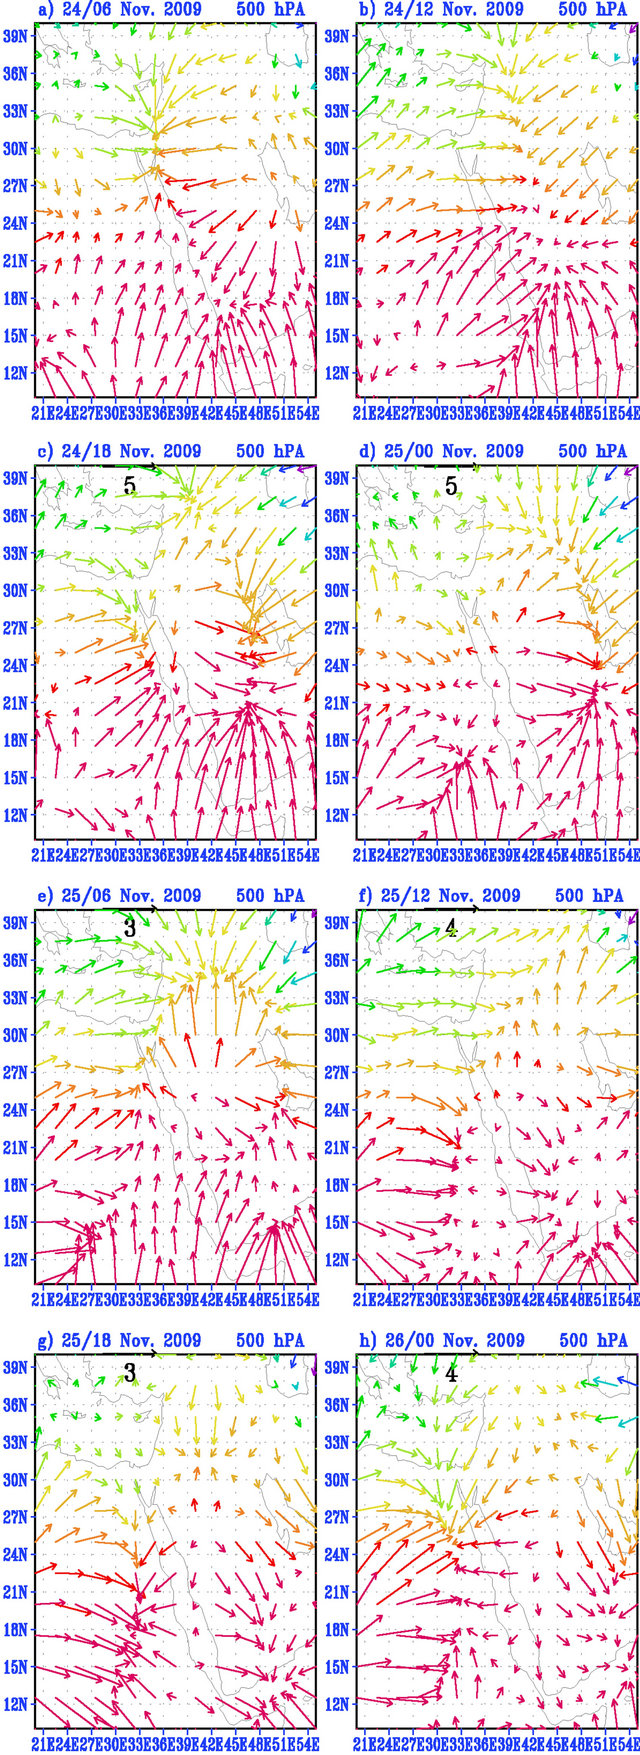
Figure 12. Irrotational winds at 500 hPa for 24/06-26/00 UTC November 2009.
the period 24/06 to 26/00 November 2009. The figure shows that, over southeastern Egypt and the western portion of the central Red Sea (20˚N, 35˚E), there is a region of low level convergence associated with a cut-off low, which was associated with the northwestward oscillation of the Red Sea trough. There is also a marked low level convergence over the Eastern Mediterranean.
The central maximum values of convergence over the Red Sea and western Saudi Arabia are 1.5, 2.5, 1.5, and 1.6 × 10⁻⁵ s–1 on 24/18, 25/00, 25/06, and 25/12 November, respectively. The second area of convergence stays over the Eastern Mediterranean from 24/06 and reaches maximum convergence at 25/06 November (1.5 × 10⁻⁵ s–1). The first low level convergence (over the western portion of the middle of the Red Sea (i.e., southeast of Egypt) is continues throughout the period of study. The maximum values of convergence appears at 24/18-25/06 November, which is the period associated with the severe thunderstorm and rainfall over Jeddah. Figure 11 illustrates that during this period the convergence occurs between the southeast hot moist wind and the northwest cold moist wind (Figure 13). Throughout the period 25/ 12-26/00 November (which coincides with the beginning of the decay period) the low level convergence over the middle of the Red Sea shifted slightly southeastward and weakened gradually; its maximum values at these times were 2, 1.5, and 1.5 × 10⁻⁵ s–1, respectively. Figure 12 shows the spatial pattern of the divergent wind fields at 500 hPa for the period 24/06 to 26/00 November 2009. It is clear that Figure 12 shows the inverse pattern of Figure 11; the areas of low level convergence and divergence at 1000 hPa are associated with areas of upper level divergence and convergence at 500 hPa.
7. Conclusions
The dynamics of a case of cyclogenesis that occurred on 25 November 2009, where Jeddah, Makkah, Rabigh, and other regions in Western Saudi Arabia were hit by heavy rainstorms has been investigated. The impact of the severe convective weather process caused more than 90 millimeters of rain to fall in Jeddah in just four hours. Our case study has been investigated in relation to two meteorological parameters: the isobaric absolute and relative vorticity, and the isobaric potential vorticity. On the whole, in this case the two approaches seem to identify the same features for surface cyclogenesis initiation. The first approach identified the interaction of a region of positive absolute vorticity advection ahead of a 500 hPa trough with a shallow frontal system. The second approach identified an isobaric PV anomaly at the upper levels with a low level baroclinic zone (again with a shallow frontal system). It is evident that both analyses imply the significance of the upper level dynamics in the
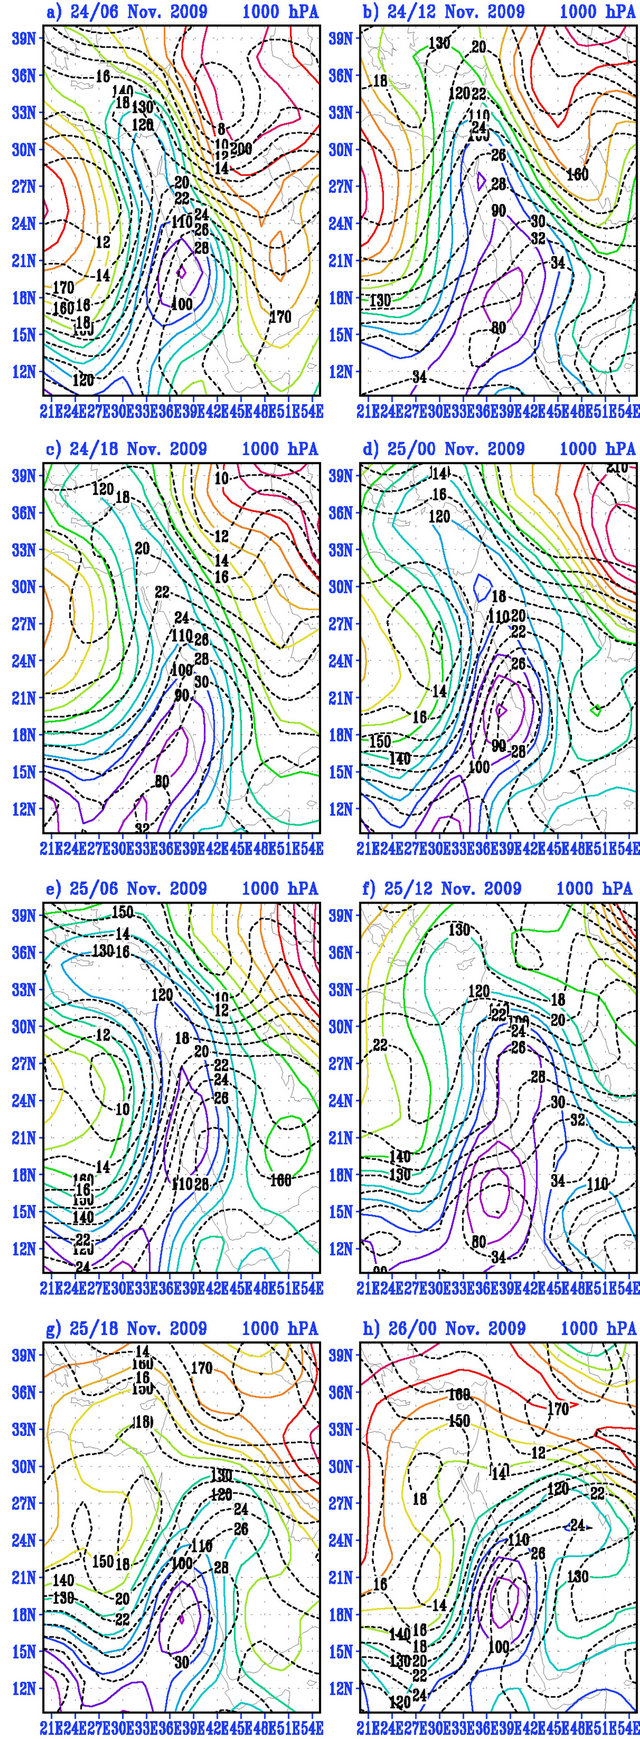
Figure 13. Irrotational winds at 500 hPa for 24/06-26/00 UTC November 2009.
initiation of this case of cyclogenesis. The isobaric vorticity analysis appears to be an informative, accurate, and easy to use method for describing the upper-level dynamics. The most significant findings from the analysis of our case study are as follows. 1) An upper level cold trough in the Eastern Mediterranean moves from west to east, and a warm blocking high is situated over the southeastern portion of Saudi Arabia and the Arabian Sea; 2) An evident low level shear line set up in northwestern Jeddah and the southeast movement of the shear line caused dynamic lifting and unstable energy release over Jeddah; 3) The water vapor transport happened primarily below 700 hPa, and the low level jet transported water vapor from the Red Sea to central Saudi Arabia. Furthermore, the blocking high in southern Saudi Arabia is favorable for maintaining water vapor passage for a long time; 4) Topography also played a role in the enhancement of convection. Jeddah lies in the coastal plain of the Red Sea, bordered by the Hijaz plateau on the east.
REFERENCES
- B. J. Hoskins, M. E. McIntyre and A. W. Robertson, “On the Use and Significance of Isentropic Potential Vorticity Maps,” Quarter Journal of Meteorological Society, Vol. 111, No. 470, 1985, pp. 877-946. doi:10.1002/qj.49711147002
- C. A. Davis and K. A. Emanuel, “Potential Vorticity Diagnostics of Cyclogenesis,” Monthely Weather Review, Vol. 119, No. 8, 1991, pp.1929-1953. doi:10.1175/1520-0493(1991)119<1929:PVDOC>2.0.CO;2
- M. T. Stoelinga, “A Potential Vorticity-Based Study of the Role of Diabatic Heating and Friction in a Numerically Simulated Baroclinic Cyclone,” Monthely Weather Review, Vol. 121, No. 5, 1996, pp. 849-874. doi:10.1175/1520-0493(1996)124<0849:APVBSO>2.0.CO;2
- Z. Huo, D. L. Zhang and J. R. Gyakum, “Interaction of Potential Vorticity Anomalies in Extratropical Cyclogenesis Part I: Static Piecewise Inversion,” Monthely Weather Review, Vol. 127, No. 11, 1999, pp. 2546-2561. doi:10.1175/1520-0493(1999)127<2546:IOPVAI>2.0.CO;2
- R. S. Plant, G. C. Craig and S. L. Gray, “On a Threefold Classification of Extratropical Cyclogenesis,” Quarter Journal of Meteorological Society, Vol. 129, No. 594, 2003, pp. 2989-3012. doi:10.1256/qj.02.174
- A. Agusti-Panareda, C. D. Thorncroft, G. C. Craig and S. L. Gray, “The Extratropical Transition of Hurricane Irene (1999): A Potential Vorticity,” Quarter Journal of Meteorological Society, Vol. 130, No. 598, 2004, pp. 1047- 1074. doi:10.1256/qj.02.140
- F. Ahmadi-Givi, G. C. Craig and R. S. Plant, “The Dynamics of a Midlatitude Cyclone with Very Strong Latent Heat Release,” Quarter Journal of Meteorological Society, Vol. 130, No. 596, 2004, pp. 295-323. doi:10.1256/qj.02.226
- H. A. Basset and A. Gahein, “Diagnostic Study on the Relation between Ozone and Potential Vorticity,” Atmosfera, Vol. 16, 2003, pp. 67-82.
- H. Abdel Basset and A. M. Ali, “Diagnostics of Cyclogenesis Using Potential Vorticity, Atmosfera,” Vol. 19, No. 4, 2006, pp. 213-234.
- N. G. Prezerakos, “Formation of Sub-Synoptic-Scale Waves on the Eastern Flank of a Large Anticyclone at 500 Hpa Leading to Surface Cyclogenesis in the Greek Area on 5th October 1989,” Report on the Fourth Session of the Steering Group on Mediterranean Cyclones Study Project, WMO, Geneva, 1992, pp. 99-110.
- N. G. Prezerakos, H. A. Flocas and S. C. Michaelides, “Absolute Vorticity Advection and Potential Vorticity of the Free Troposphere as a Synthetic Tool for the Diagnosis and Forecasting of Cyclogenesis,” Atmosphere-Ocean, Vol. 35, No. 1, 1997, pp. 65-91.
- N. G. Prezerakos, A. H. Flocas and S. C. Michaelides, “Upper-Tropospheric Downstream Development Leading to Surface Cyclogenesis in the Central Mediterranean,” Applied Meteorology, Vol. 6, No. 4, 1999, pp. 313- 322. doi:10.1017/S1350482799001218
- T. S. Karacostas and A. A. Flocas, “The Development of the Bomb over the Mediterranean Area,” La Meteorologie, Vol. 34, 1983, pp. 351-358.
- A. A. Flocas and T. S. Karacostas, “Cyclogenesis over the Aegean Sea: Identification and Synoptic Categories,” Applied Meteorology, Vol. 33, 1996, pp. 53-61.
- H. R. Pomroy and A. J. Thorpe, “The Evolution and Dynamical Role of Reduced Upper-Tropospheric Potential Vorticity in Intensive Observing Period One of FASTEX,” Monthely Weather Review, Vol. 128, No. 6, 2000, pp. 1817-1834. doi:10.1175/1520-0493(2000)128<1817:TEADRO>2.0.CO;2
- WMO, “Atmospheric Ozone,” Vol. I, No. 16, WMO, Geneva, 1986.
- T. N. Krishnamurti and L. Bounoua, “An Introduction to Numerical Weather Prediction Techniques,” Academic Press, Waltham, 1996.
- A. D. Karein, “The Forecasting of Cyclogenesis in the Mediterranean Region,” Ph.D. Thesis, University of Edinburgh, Scotland, 1979.
- E. Palmen and C. Newton, “Atmospheric Circulation Systems: Their Structure and Physical Interpretation,” Academic Press, New York and London, 1969.
- S. Petterssen, “Weather Analysis and Forecasting,” 2nd Edition, Mc Graw-Hill Book Company, New York, 1956.
- M. Kurz, “The Role of Diagnostic Tools in Modern Weather Forecasting,” Applied Meteorology, Vol. 1, 1994, pp. 45-46.