Food and Nutrition Sciences
Vol.5 No.2(2014), Article ID:42189,9 pages DOI:10.4236/fns.2014.52029
Activation of Human Prefrontal Cortex to Pleasant and Aversive Taste Using Functional Near-Infrared Spectroscopy
1Graduate School of System Informatics, Kobe University, Kobe, Japan; 2Graduate School of Human Development and Environment, Kobe University, Kobe, Japan.
Email: *ykatou@crystal. kobe-u.ac.jp
Received November 11th, 2013; revised December 11th, 2013; accepted December 18th, 2013
ABSTRACT
The aim of the study was to investigate the representation of taste in human prefrontal cortex (PFC), in particular, to compare the representation of a pleasant and an aversive taste using functional near-infrared spectroscopy (fNIRS), so as to obtain further understanding of the taste preference mechanism. The pleasant stimulus used was sweet taste (10% sucrose), and the unpleasant stimulus was sour taste (1% critic acid). Based on event-related design, the experiments were performed with 16 healthy volunteers using the OEG-16 fNIRS sensor. A general linear model was used to analyze the collected data. For the concentration change of oxygenated hemoglobin (ΔoxyHb), we found that significant deactivation was induced by sweetness and sourness in parts of the frontopolar area, orbitofrontal area and dorsolateral prefrontal cortex in bilateral hemisphere of human brain. And the right PFC showed different levels of activation between sweetness and sourness. In addition, brain activities were more sensitive to sourness than sweetness. Finally, we confirmed that the PFC was involved in sweet and sour taste processing, and fNIRS provided an alternative way for studying taste-related brain function under more natural conditions.
Keywords:fNIRS; Gustatory; Sweetness; Sourness; Prefrontal Cortex
1. Introduction
Gustation serves an important role in human as one specific and basic function of oral cavity [1], which is closely related to brain function. The information and sensation gained by receptors are not only to modulate food intake but also to affect high cognitive process of human brain [2]. For its importance, brain activity during taste cognitive processing associated with daily feeding behaviors has recently attracted increasing attention. In the past several years, the study of taste sensation and perception has been energized by the discovery that taste and other food-related activities occur in the prefrontal cortex (PFC) [3], which is involved in various higher cognitive functions such as planning, reasoning and language comprehension [4]. This finding has reinforced our understanding of neural communication in gustatory system. Correspondingly, Okamoto et al. have done a series of researches on PFC activity for taste encoding based on different experimental tasks and designs, and almost of the results concluded that the lateral PFC is responsible for intentional taste encoding [5,6]. Similarly, the acute effects of glucose ingestion on prefrontal brain activation during the execution of a divided attention task have exhibited in fasting nondiabetic older adults [7]. Several neuroimaging and neurophysiological studies have provided supporting evidence for the above finding [8]. Thus, the PFC seems to be also responsible for taste cognitive processing. However, although established fundamental evidences for taste-related brain function have been accumulated, compared with other sensory functions, such as vision, audition and olfaction, studies on gustatory cognitive processing, in particular to PFC, remain scarce. The representation of gustatory neural circuits is still in its infancy.
In present study, we investigated whether similar hemodynamic changes were also detected in PFC when tasting pleasant and unpleasant tastes. Although the subjective feeling of taste varies, in generally, the sensation of taste can be categorized into five basic taste qualities: sweetness, sourness, saltiness, bitterness, and possibly umami. Meanwhile, as taste senses both harmful and beneficial things, all basic tastes are classified as either aversive or appetitive, depending on the effect of the things they sense on our bodies, for example salty, sweet and umami drives us toward essential nutrients, whereas bitter and sour alert us to potentially harmful substance. Thus, emotion induced by taste refers to food modulation, balance of nutrition and harm avoidance, and they all play important roles in human survival. Among these five basic tastes, sweetness is often regarded as a pleasurable sensation, while sourness serves as an aversive taste. Because the PFC plays an important role in many higher cognitive functions [4], we speculated that pleasant and aversive taste processing would activate some parts of the PFC at first. And, if true, it shows where is responding to these tastes in human brain. The primary aim of this study was to use functional near-infrared spectroscopy (fNIRS) to obtain correlations between prefrontal cortex activity and the subjective emotion-effects produced by sweet and acidic tastes based on event-related design (ERD).
We used fNIRS to monitor the brain activation and reveal hemodynamic and metabolic changes [9]. In the almost 35 year since Jobsis firstly applied NIRS to monitor changes in tissue oxygenation, this technology has developed remarkably. Compared to other neuroimaging methods, such as positron emission tomography (PET), functional magnetic resonance imaging (fMRI) or magneto encephalography (MEG), fNIRS has many advantages. The experiments, using fMRI or another brain imaging technologies, require the subject being scanned to stay completely so that it can capture a clear image. It makes the subject feel stressful physiologically and/or physically. On the contrary, fNIRS only requires compact experimental equipment and is less restrictive of subject’s movement, allowing the brain function to be monitored under more natural conditions [10,11]. So far, this technique has been widely used for some brain researches of sensory, motor and other high cognitive process.
2. Materials and Methods
2.1. Participants
A total of 16 healthy volunteers (8 males and 8 females), aged 26.31 + 5.462 years (mean + SD), participated in the experiment. All of them are right-handed and none had a history of mental and neurological disease. The volunteers were not allowed to eat 2 hours before the experiment but were allowed to drink normally. This study was approved by the Human Ethics Committee of Health Promotion and Education, Graduate School of Human Development and Environment in Kobe University.
2.2. Stimuli
In this study, sweetened solution (10% sucrose) and acidic solution (1% citric acid) were chosen as taste stimuli. In our previous works, the pre-experiment had been done by sweet and acidic solution with different concentration, and we found, most of the subjects were activated by these two stimuli (10% sucrose and 1% citric acid) strongly. In addition, to determine the brain cortex areas specifically activated by these stimuli, purified water (tasteless) was used as reference to minimize noise induced by oral motor and other brain function in the subsequent analysis. All samples are served at room temperature.
2.3. Experimental Procedure
The experiment was performed using ERD. Figure 1 shows the schematic diagram of the protocol. A single session comprised of a baseline and a task. During the experiment, as a baseline condition, we asked the subject to sit on a chair in a quiet room and try to relax with eyes closed for 40 seconds. Following this, stimulus, in quantities of 8 ml, was manually injected into the subject’s mouth via a hand-held syringe connected to a tube. The subject was asked to hold the stimulus in the mouth for 25 seconds (include the injection time) and then spit it out. After the task, the subject rinsed off his/her mouth with purified water to prevent adaptation. Then they continued to run the same process with the two stimuli. In this experiment, purified water was firstly injected and

Figure 1. The schematic diagram of experiment protocol.
followed by sweet solution and acidic solution. Some pilot studies were done so that subjects knew about expe-riment and it was beneficial for us to seek some regions of interest (ROI) of gustatory system effectively.
The subjective ratings of the pleasantness of the stimuli were also measured just after the fNIRS recording session using a rating scale ranging from +2 = very like/ pleasant, 0 = neutral, −2 = very dislike/unpleasant.
2.4. fNIRS Measurement
We used a multichannel fNIRS instrument (Spectratech OEG-16 from Spectratech Inc., Tokyo, Japan) to cover the prefrontal lobe and monitor the subject’s brain activity during the taste processing. The system operated at two different wavelengths of 770 nm and 840 nm, emitting an average power of 3.6 mW/mm−2. The time resolution is 0.65 seconds, and the depth of brain tissue which can be measured from the surface is 3 cm in this case. Up to now, there has not been any positional standard for fNIRS, thus, we placed OEG-16 over the frontal lobe using Fp1 and Fp2 of the international 10 - 20 system as reference points for placement, as showed in Figure 2.
2.5. fNIRS Data Acquisition and Analysis
Using the modified Beer-Lambert Law for highly scattering medium [12,13], the optical data was transferred into the oxygenated hemoglobin (oxyHb), deoxygenated hemoglobin (deoxyHb), and total hemoglobin (totalHb) concentration changes as ΔoxyHb, ΔdeoxyHb, and ΔtotalHb respectively in mM.mm unit, as the following equation:
 (1)
(1)
Here,  means the change of absorbance at a given wavelength,
  for concentration change,
  for average length of light path, and
  for effect change by scattering. Considering multiple measurement at two wavelengths in this case, we can rewrite Equation (1) as follows:
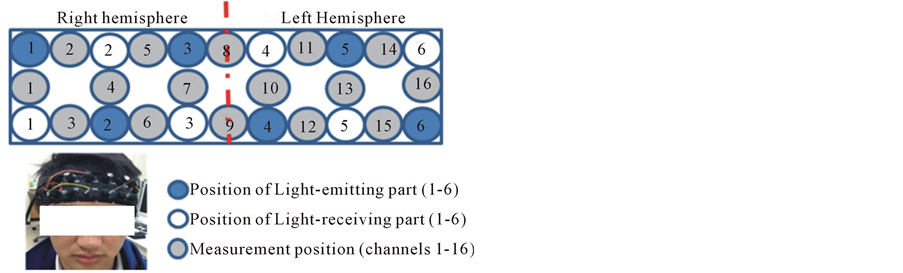
Figure 2. Instrument of fNIRS and probe arrangement.
 (2)
(2)
 (3)
(3)
From (2) and (3), we can obtain  and
and . Then the total hemoglobin signal (
 ) is calculated as a sum of
  and
and  as following
 (4)
(4)
Our analyses focused on oxyHb, which is most sensitive to change in regional cerebral blood flow, and provided the strongest correlation with the blood oxygen level dependent signal among the three fNIRS parameters [11]. Afterwards, moving average filter was applied to remove global influence (e.g. changes in heart rate or respiratory influences), and we made the data point as 5 and one repeat time. All sessions in all channels were used for statistical processing.
For each channel in each of the 3 conditions (purified water sweetened and acidic solution), a baseline was calculated as the mean value of ΔoxyHb in 40 s, while a task was calculated as the mean value of ΔoxyHb over 25 s after injecting stimulus. To identify the significantly activated channels, we performed analysis of variance (ANOVA) comparing the different stimulus in different condition respectively (i.e. baseline1 vs. task 1, task 1 vs. task 2) (to enable the analysis, the thresholds for significance in the result were then set at p < 0.05 (Bonferroni)). Our analysis is summarized as follows: firstly, we compared the baseline with task values respectively (i.e. baseline 1 vs. task 1) to get the channels which are significantly influenced by stimulus. Then, because the baselines of three stimuli showed different level from each other, we calculated the Z-score of each task value as it is normalized before they can be used for comparison among themselves. The equation is shown as:
 (5)
(5)
Here, m represents the mean value of the baseline, σ is the standard deviation of the baseline, and x is the value of the tasks for 25 seconds (Figure 3). By using the z-scores, we could then compare the task values to find out whether there is any difference among the three tastes. Specifically, based on the channels which were activated by stimuli firstly, if they show different level between tasteless (purified water) and tastes (sweetness and sourness), we identified the activities in these channels are truly evoked by sweetness and sourness. In other word, these regions are involved in the sweet and/or sour taste processing. We also compared neural responses to sweetness and sourness to find out whether there is any anatomical separation between these two taste senses. Statistical analyses were conducted using SPSS version 18.0 (SPSS Inc.).
Since we conducted the experiment with the OEG-16 without any supplementary tool such as a 3D digitizer, it is difficult to identify the activated foci of human brain. To resolve this problem, we referred to the spatial registration of fNIRS device the ETG4000 3 × 11 (manufactured by Hitachi), which contained the channels of OEG-16. From there, we obtained Channel localizations of OEG-16 on human brain. The channels covered inferior frontal gyrus, middle fontal gyrus, superior frontal gyrus and the lateral orbitofrontal gyrus.
3. Results
3.1. Pleasantness Ratings
The average pleasantness rating for the sweetened solution condition was +1.13 ± 0.5 (mean ± SE), whereas −0.69 ± 0.94 for the acidic solution condition (paired t = 5.68, df = 15, p < 0.001), which matched the subjects’ self-reported that the sweetened solution made them pleasant and the acidic solution is unpleasant.
3.2. Prefrontal Cortical Responses
Figures 4 and 5 represented the activation of prefrontal lobe cortex when tasting the sweet solution and acidic solution and most of channels showed a relative decrease of oxyHb. According to ANOVA, we observed different PFC areas across different tasks. In the purified water condition, a significant activation from baseline to task in oxyHb was observed in almost all channels. In sweetened solution condition, the regions in bilateral prefrontal cortex (ch3, 4, 6, 10, 11, 12 and 14) exhibited significant activation during sweetness stimulating condition. Although these channels were activated by sweet taste and in some sense related to sweet gustatory system, they also would be responses to sensory, motor or proprioceptive in origin. To elicit the cerebral activity by sweetness, then, comparing tasteless (purified water) and sweetness, the main activated signals appeared at five channels (ch3, 4, 6, 11 and 12) (Figure 6). The MNI coordinates estimated for these channels were close to the reported location of frontopolar area, orbitofrontal area and dorsolateral prefrontal cortex (Table 1). Similarly, the contrast, tasteless and sourness, revealed significant activation in eight channels: ch3, 4, 5, 6, 9, 10, 11 and 13 (Figure 7(a)), which were in parts of the dorsolateral prefrontal cortex, the frontopolar area, and the orbitofrontal area (Table 2). Furthermore, Figure 7(b) and Table 3 showed
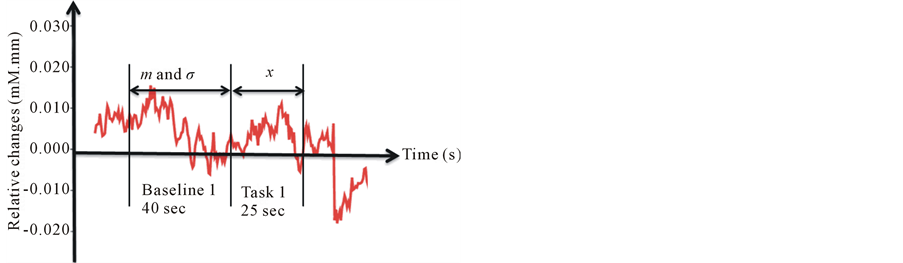
Figure 3. Normalized changes for fNIRS data in task condition.
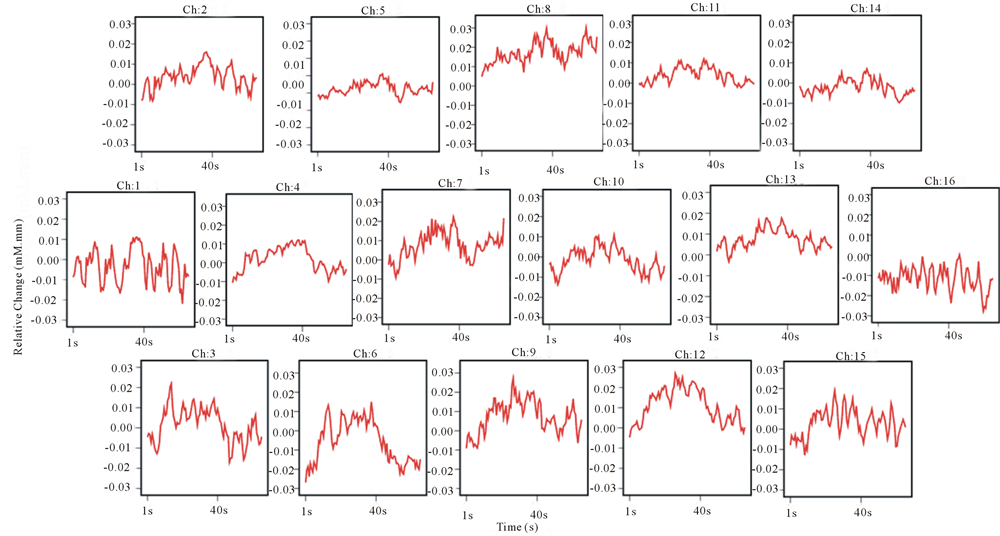
Figure 4. Grand average concentration changes of oxyHb for 16 subjects during the sweet taste processing.
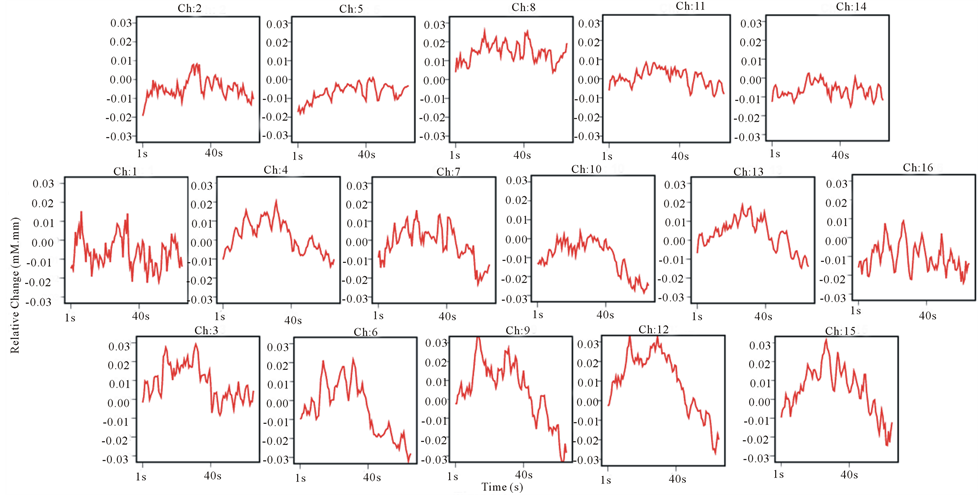
Figure 5. Grand average concentration changes of oxyHb for 16 subjects during the acidic taste processing.
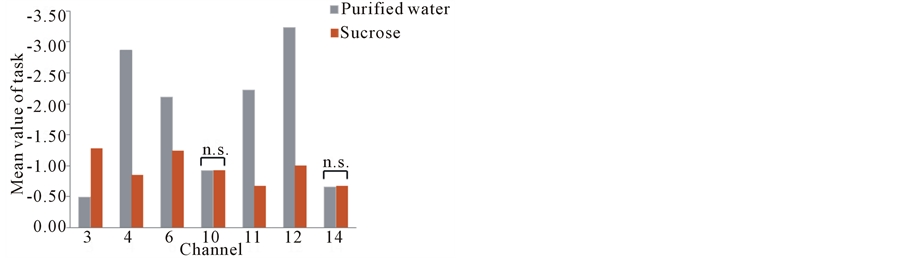
Figure 6. Contrast 1 (sucrose vs. purified water). Normalized activation levels (z-score) for the channels, acutely activated in purified water and sweetened solution, were compared. n.s.: not significant.

Table 1. The activated channels related to sweetness.
BA, brodmann area; PFC, prefrontal cortex.
that parts of the frontopolar area and orbitofrontal area of human brain especially in the right hemisphere (ch3, 4, and 6) were significantly activated by sweet and sour taste but showed different level between them simultaneously. In addition, the results showed sourness is more sensitively activated than sweetness.
4. Discussion
The results from this study showed that the fNIRS (OEG- 16) could be used to measure the taste-related brain function. Relatively to our primary aim, comparing purified water to sweetened and acidic solution respectively, the group analysis showed the ROI (tasteless-sweetness) included the regions of one part of the frontopolar area, orbitofrontal area and dorsolateral prefrontal cortex, while the ROI (tasteless-sourness) overlapped the area activated by sweetness (ch3, 4, 6 and 11) and also showed some another foci (ch5, 9, 10 and 13). We conclude that, in some sense, these regions in the prefrontal cortex of human brain are involved in the perception of sweetness and sourness in taste system. Previous neuroimaging studies of the representation of taste in human brain have found cortical areas reacted to taste such as the frontal operculum/insula and the orbitofrontal cortex [14-16]. Furthermore, many neuroimaging studies have shown right-hemispheric dominance is involved in both taste perception [17,18] and recognition [14] of gustatory stimuli, while some studies have shown bilateral or left-lateral areas of human brain are concerned with the quality of taste [19,20]. Our finding supported that the lateral PFC, especially the right hemisphere, are acutely
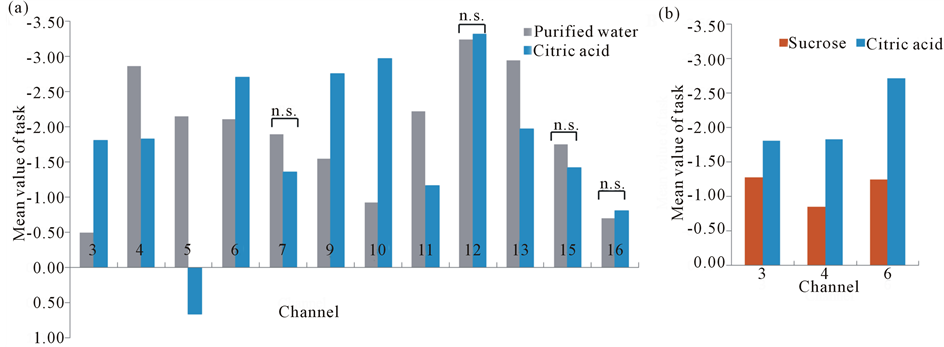
Figure 7. (a) Contrast 2 (citric acid vs. purified water). Normalized activated levels (z-score) for the channels, activated in purified water and acidic solution significantly, were compared. n.s.: not significant; (b) Contrast 3 (sucrose vs. citric acid). The channels which were truly evoked by sweet and sour tastes were used to compare, and all of them showed different levels significantly.
Table 2. The activated channels related to sourness.
BA, brodmann area; PFC, prefrontal cortex.
influence by the pleasant and aversive tastes.
Another novel finding of this study is that the difference between sweet and acidic taste appeared in parts of the dorsolateral prefrontal cortex (ch3 and 4), frontopolar area (ch4) and the orbitofrontal area (ch6) in the right hemisphere. This provides new evidence to support the issue that human prefrontal area is involved in the discrimination of taste qualities.
Furthermore, as the results presented above, aversive stimulus was activated in more regions among the PFC than the pleasant. This may be derived from taste quality and intensity. In a PET studies, they found the aversive taste (saline solution) was slightly more perceptually intense than pleasant taste (chocolate) in the right amygdala, left orbitofrontal cortex and pregenual cingulate [16].
Table 3. The areas related to discrimination of taste quality.
BA, brodmann area; PFC, prefrontal cortex.
In our case, sourness is indeed an aversive taste while sweetness is pleasant for our subjects. Furthermore, the sourness made subjects stronger feelings. It is likely the similar neural mechanism is related to taste quality and intensity in our study.
In addition, as the result presented above, most parts of the PFC showed a relative decrease of oxyHb during the sweet and acidic taste processing. Why does oxyHb in PFC tend to be decrease during pleasant and aversive taste? Task-induced decreases of oxyHb or regional cerebral blood flow (rCBF) in PFC have been reported by previous studies using video-game-like tasks [21]. Regarding to taste, the decrease in neuronal response to a food as the monkey is fed to satiety is partly specific to the food eaten, and this mechanism reflects the preference of the monkeys for the foods [3,22]. Although each of these studies differed in various tasks and designs, deactivation in dorsal PFC was commonly observed. Some possible factors are applicable to such phenomenon such as attention demand [23,24] and “vascular steal” [25]. Especially relevant to present study, possible explanation relates to passive hemodynamic changes is attention demand or taste preference rather than vascular steal. Even if our experimenter told subjects no to think of anything during the testing, it is also probable that some unconscious attention demand was required for these pleasant and aversive tastes.
The present findings in humans are consistent with some earlier findings but at the same time there were also some difference in our study. That would be due to the following factors. Firstly, in this case, the Bonferroni correction was performed to set an upper bound on the family wise error rate. Actually, this method is usually used for some data analysis in neuropsychology study and strongly controls the probability of making one or more false detection among all the simultaneously channels. However, such correction may be too strict, and therefore, the ROIs obtained in this case are just the most related foci’s of sweet and sour taste. In other word, it is possible that the truly activated channels were overlooked. Secondly, because the taste-related brain function is closely related to the feeding behavior, the physiological status of subject, such as in hungry or satiety condition, may affect the brain function during the gustatory processing. There are some evidences showing that neurons in the secondary taste cortex region have been found to be modulated by the motivational state of the animal, responding to the sight or taste of food when the animal is hungry and not responding when the animal is satiated [22,26]. Here, the volunteers did not consume any food the 2 hours before the experiment, so that the activated regions we found were little different from some previous studies. Furthermore, in the neuropsychology and brain function mapping studies, two major types of experimental designs utilized in cognitive experiments using some neuroimaging techniques are block and event-related designs [27]. In present study, we utilized event-related design, which may be more appropriate for exploring higher cognitive functions [28], and injected sweet solution before acidic solution. This experimental paradigm perhaps influenced the regions of interest we found and may explain the activated intensity of sweetness and sourness [29,30]. In addition, there were 16 subjects (Chinese and Japanese) participated in this experiment. As this study is our first time using OEG-16 as a monitor tool for brain cortex functions during the sweet and sour taste processing, it is still in a very early stage and comes with a few limitations as above discussed. More experiments are required to evaluate this method and further investigate questions about taste preference mechanism.
5. Conclusion
The present study used fNIRS to investigate the prefrontal cortex activity during pleasant and aversive tastes and deactivation was observed in parts of frontopolar area, orbitofrontal area and dorsolateral prefrontal cortex. We hope that the investigation will further contribute to the understanding mechanism of taste preference, and to providing some theoretical evidences for studying on taste disease such as dyspepsia and disorder.
Acknowledgements
The present research was financially supported by Grantin-Aid for Scientific Research (C) 23500945 from the Japan Society for the Promotion of Science. The authors would like to thank volunteers for their involvement in this study.
REFERENCES
- H. C. Liu, “Study of Relationship between Oral Function and Brain Function,” Chinese Journal of Prosthodontics, Vol. 3, No. 4, 2002, pp. 137-139.
- Y. Kato, “Relationship among Stress, Drive for Thinness, and Eating Behavior of Female University Students: Attitude toward Sweetness an Inclination to Eating Disorders,” Japan Society of Home Economics, Vol. 55, No. 8, 2007, pp. 453-461.
- M. L. Kringelbach, I. E. de Araujo and E. T. Rolls, “Taste-Related Activity in the Human Dorsolateral Prefrontal Cortex,” Neuroimage, Vol. 21, No. 2, 2004, pp. 781-788. http://dx.doi.org/10.1016/j.neuroimage.2003.09.063
- E. K. Miller and J. D. Cohen, “An Integrative Theory of Prefrontal Cortex Function,” Annual Review of Neuroscience, Vol. 24, 2001, pp. 167-202. http://dx.doi.org/10.1146/annurev.neuro.24.1.167
- M. Okamoto, H. Dan, A. K. Singh, F. Hayakawa, V. Jurcak, T. Suzuki, K. Kohyama and I. Dan, “Prefrontal Activity during Flavor Difference Test: Application of Functional Near-Infrared Spectroscopy to Sensory Evaluation Studies,” Appetit, Vol. 74, No. 2, 2006, pp. 220-232. http://dx.doi.org/10.1016/j.appet.2006.04.003
- M. Okamoto, M. Matsunami, H. Dan, T. Kohata, K. Kohyama and I. Dan, “Prefrontal Activity during Taste Encoding: An fNIRS Study,” Neuroimage, Vol. 31, No. 2, 2006b, pp. 796-806. http://dx.doi.org/10.1016/j.neuroimage.2005.12.021
- C. Gagnon, L. Desjardins-Crepeau, I. Tournier, M. Desjardins, F. Lesage, C. E. Greenwood and L. Bherer, “Near-Infrared Imaging of the Effects of Glucose Ingestion and Regulation on Prefrontal Activation during DualTask Execution in Healthy Fasting Older Adults,” Behavioural Brain Research, Vol. 232, No. 1, 2012, pp. 137- 147. http://dx.doi.org/10.1016/j.bbr.2012.03.039
- S. Bembich, C. Lanzara, A. Clarici, S. Demarini, B. J. Tepper, P. Gasparini and D. L. Grasso, “Individual Difference in Prefrontal Cortex Activity during Perception of Bitter Taste Using fNIRS Methodology,” Chemical Senses, Vol. 35, No. 9, 2010, pp. 801-812. http://dx.doi.org/10.1093/chemse/bjq080
- M. Ferrari and V. Quaresima, “A Brief Review of on the History of Human Functional Near-Infrared Spectroscopy (fNIRS) Development and Fields of Application,” Neuroimage, Vol. 63, No. 2, 2012, pp. 921-935. http://dx.doi.org/10.1016/j.neuroimage.2012.03.049
- S. Coyle, T. Ward, C. Markham and G. McDarby, “On the Suitability of Near-Infrared (NIR) Systems for Next Generation Brain Computer Interfaces,” Physiological Measurement, Vol. 25, No. 4, 2004, pp. 815-822. http://dx.doi.org/10.1088/0967-3334/25/4/003
- Y. Hoshi, N. Kobayashi and M. Tamura, “Interpretation of Near-Infrared Spectroscopy Signals: A Study with a Newly Developed Perfused Rat Brain Model,” Journal of Applied Physiology, Vol. 90, No. 5, 2001, pp. 1657- 1662.
- D. T. Delpy, M. Cope, P. van der Zee, S. Arridge, S. Wray and J. Wyatt, “Estimation of Optical Pathlength through Tissue from Direct Time of Flight Measurement,” Physics in Medicine and Biology, Vol. 33, No. 12, 1988, pp. 1433-1442. http://dx.doi.org/10.1088/0031-9155/33/12/008
- H. Eda, “Problems of NIRS and the Future Prospects,” Systems, Control and Information, Vol. 53, No. 4, 2009, pp. 155-161.
- D. M. Small, M. Jones-Gotman, R. J. Zatorre, M. Petrides and A. C. Evans, “A Role for the Right Anterior Temporal Lobe in Taste Quality Recognition,” Journal of Neuroscience, Vol. 17, No. 13, 1997, pp. 5136-5142.
- D. M. Small, D. H. Zald, M. Jones-Gotman, R. J. Zatorre, J. V. Pardo, S. Frey and M. Petrides, “Human Cortical Gustatory Areas: A Review of Functional Neuroimaging Data,” NeuroReport, Vol. 10, No. 1, 1999, pp. 7-14. http://dx.doi.org/10.1097/00001756-199901180-00002
- D. H. Zald, J. T. Lee, K. W. Fluegel and J. V. Pardo, “Aversive Gustatory Stimulation Activates Limbic Circuits in Humans,” Brain, Vol. 121, No. 6, 1998, pp. 1143- 1154. http://dx.doi.org/10.1093/brain/121.6.1143
- R. J. Zatorre and M. Jones-Gotman, “Functional Imaging of the Chemical Senses,” In: A. W. Toga and J. C. Mazzoiotta, Eds., Brain Mapping: The Systems, Academic Press, San Diego, 2000, pp. 403-424. http://dx.doi.org/10.1016/B978-012692545-6/50015-5
- M. A. Barry, J. C. Gatenby, J. D. Zeiger and J. C. Gore, “Hemispheric Dominance of Cortical Activity Evoked by Focal Electrogustatory Stimuli,” Chemical Senses, Vol. 26, No. 5, 2001, pp. 471-482. http://dx.doi.org/10.1093/chemse/26.5.471
- S. Kinomura, R. Kawashima, K. Yamada, et al., “Functional Anatomy of Taste Perception in the Human Brain Studied with Positron Emission Tomography,” Brain Research, Vol. 659, No. 1-2, 1994, pp. 263-266. http://dx.doi.org/10.1016/0006-8993(94)90890-7
- T. C. Pritchard, D. A. Macaluso and P. J. Eslinger, “Taste Perception in Patients with Insular Cortex Lesions,” Behavioral Neuroscience, Vol. 113, No. 4, 1999, pp. 663- 671. http://dx.doi.org/10.1037/0735-7044.113.4.663
- G. Matsuda and K. Hiraki, “Sustained Decrease in Oxygenated Hemoglobin during Video Games in the Dorsal Prefrontal Cortex: A fNIRS Study of Children,” NeuroImage, Vol. 29, 2006, pp. 706-711. http://dx.doi.org/10.1016/j.neuroimage.2005.08.019
- E. T. Rolls, Z. J. Sienkiewicz and S. Yaxley, “Hunger Modulates the Responses to Gustatory Stimuli of Single Neurons in the Caudolateral Orbitofrontal Cortex of the Macaque Monkey,” European Journal of Neuroscience, Vol. 1, No. 1, 1989, pp. 53-60. http://dx.doi.org/10.1111/j.1460-9568.1989.tb00774.x
- P. Mazoyer, B. Wicker and P. Fonlupt, “A Neural Network Elicited by Parametric Manipulation of the Attention Load,” NeuroReport, Vol. 13, No. 17, 2002, pp. 2331-2334. http://dx.doi.org/10.1097/00001756-200212030-00032
- G. L. Shulman, J. A. Fiez, M. Corbetta, R. L. Buckner, F. M. Miezin, M. E. Raichle and S. E. Petersen, “Common Blood Flow Changes Across Visual Tasks: II. Decreases in Cerebral Cortex,” Journal of Cognitive Neuroscience, Vol. 9, No. 5, 1997, pp. 648-663. http://dx.doi.org/10.1162/jocn.1997.9.5.648
- A. R. Wade, “The Negative BOLD Signal Unmasked,” Neuron, Vol. 36, No. 6, 2002, pp. 993-995. http://dx.doi.org/10.1016/S0896-6273(02)01138-8
- F. Mora, D. B. Avrith, A. G. Phillios and E. T. Rolls, “Effects of Satiety on Self-Stimulation of the Orbitofrontal Cortex in the Monkey,” Neuroscience Letters, Vol. 13, No. 2, 1979, pp. 141-145. http://dx.doi.org/10.1016/0304-3940(79)90031-4
- M. W. Chee, V. Venkatraman, C. Westphal and S. C. Siong, “Comparison of Block and Event-Related fMRI Designs in Evaluating the Word-Frequency Effect,” Human Brain Mapping, Vol. 18, No.3, 2003, pp. 186-193. http://dx.doi.org/10.1002/hbm.10092
- K. J. Friston, E. Zarahn, O. Josephs, R. N. Henson and A. M. Dale, “Stochastic Designs in Event-Related fMRI,” Neuroimaging, Vol. 10, No. 5, 1999, pp. 607-619. http://dx.doi.org/10.1006/nimg.1999.0498
- S. T. Carmichael and J. L. Price, “Limbic Connections of the Orbital and Medial Prefrontal Cortex in Macaque Monkeys,” Journal of Comparative Neurology, Vol. 363, No. 3, 1995, pp. 615-641. http://dx.doi.org/10.1002/cne.903630408
- S. T. Carmichael and J. L. Price, “Connectional Networks within the Orbital and Medial Prefrontal Cortex of Macaque Monkeys,” Journal of Comparative Neurology, Vol. 371, No. 2, 1996, pp. 179-207. http://dx.doi.org/10.1002/(SICI)1096-9861(19960722)371:2<179::AID-CNE1>3.0.CO;2-#
NOTES
*Corresponding author.