Food and Nutrition Sciences
Vol.4 No.9A(2013), Article ID:36476,8 pages DOI:10.4236/fns.2013.49A1017
High-Lard and High-Fish Oil Diets Differ in Their Effects on Insulin Resistance Development, Mitochondrial Morphology and Dynamic Behaviour in Rat Skeletal Muscle
![]()
Department of Biology, University of Naples “Federico II”, Naples, Italy.
Email: rosalba.putti@unina.it
Copyright © 2013 Lillà Lionetti et al. This is an open access article distributed under the Creative Commons Attribution License, which permits unrestricted use, distribution, and reproduction in any medium, provided the original work is properly cited.
Received Jun 18th, 2013; revised July 18th, 2013; accepted July 25th, 2013
Keywords: High-Fish Oil Diet; High-Lard Diet; Skeletal Muscle; Mitochondrial Fusion; Mitochondrial Fission; Insulin-Resistance
ABSTRACT
Fish oil (mainly omega 3 polyunsaturated fatty acids), differently from lard (mainly saturated fatty acids) has been suggested to have anti-inflammatory effects associated with amelioration of insulin sensibility. An important role in skeletal muscle insulin resistance development has been recently attributed to mitochondrial dynamic behavior. Mitochondria are dynamic organelles that frequently undergo fission/fusion processes and a shift toward fission process has been associated with skeletal muscle mitochondrial dysfunction and insulin resistance development. The present work aimed to evaluate if the replacement of lard with fish oil in high-fat diet positively affect skeletal muscle mitochondrial dynamic behavior in association with the improvement of insulin-resistance. Body weight gain, systemic insulin-resistance (glucose/insulin ratio), serum TNFα levels and skeletal muscle lipid content were assessed in rats fed a high-lard or high-fish-oil diet for 6 weeks. In skeletal muscle sections, immunohistochemical analysis were performed to detect the presence of insulin receptor substrate 1 (IRS1) and tyrosine phosphorylated IRS1 (key factor in insulin signalling pathway) as well as to detect the main proteins involved in mitochondrial fusion (MFN2 and OPA1) and fission (DRP1 and Fis1) processes. Skeletal muscle mitochondrial ultrastructural features were assessed by electron microscopy. High-fish oil feeding induced lower body weight gain, systemic inflammation and insulin-resistance development as well as skeletal muscle lipid accumulation compared to high-lard feeding. Skeletal muscle sections from high-fish oil fed rats exhibited a greater number of immunoreactive fibers for MFN2 and OPA1 proteins as well as weaker immunostaining for DRP1 and Fis1 compared to sections from high-lard fed rats. Electron microscopy observations suggested a prominent presence of fission events in L rats and fusion events in F rats. The positive effect of the replacement of lard with fish oil in high-fat diet on systemic and skeletal muscle insulin sensibility was associated to changes in mitochondrial dynamic behavior.
1. Introduction
The debate on the roles played by different type of dietary fat (saturated or unsaturated) in obesity development and associated diseases, such as insulin resistance, is still ongoing with controversies in finding on both positive and negative contribution of fatty acids to these diseases. It is however well known that among high fat diets, both safflower oil and lard induce obesity, whereas fish oil does not [1-3]. In addition, omega-3 polyunsaturated fatty acids (ω-3 PUFAs) from fish oil enhance insulin sensitivity and glucose homeostasis in rodent models of insulin resistance. In fact, whether insulin resistance develops depends upon the type of dietary fat: the replacement of a small proportion of the diet with omega-3 fatty acids from fish oil completely prevents the development of skeletal muscle insulin resistance [4-6]. These beneficial effects have been linked with anti-inflammatory properties, but emerging data suggests that the mechanisms may also converge on mitochondria, given that defects in mitochondrial performance has been suggested to contribute to the development of insulin resistance [78]. In fact, defective mitochondrial function in skeletal muscle, the main tissue involved in insulin resistance development, has been reported in type II diabetes and other insulin-resistant states [7,9,10]. New emerging evidence suggests that the maintenance of correct mitochondrial function is strictly associated with the maintnance of normal mitochondrial morphology by tilting the balance between fusion and fission processes (dynamic behavior) [9,11,12]. In fact, mitochondria are dynamic organelles which, in response to both cellular energy demand and environmental challenges, may undergo to frequently changes in their distribution and morphology by an alteration in recurrent fission and fusion events [9,11,12]. The main proteins involved in fusion processes are mitofusin 1 and 2 (Mfn1, Mfn2) and autosomal dominant optic atrophy-1 (OPA1) [9,13,14], which are associated with the mitochondrial outer and inner membranes, respectively. Whereas fission events are coordinated by fission 1 protein (Fis1), an integral outer mitochondrial membrane protein, which mediated the recruitment of the cytosolic dynamin-related protein 1 (DRP1) to complete fission activities [9,11]. There is growing evidence that a reduction in the proteins involved in mitochondrial fusion is associated with skeletal muscle mitochondrial dysfunction in the development of obesity, insulin resistance and type II diabetes [9,15], while enhanced fission machinery has been found in skeletal muscle in genetically obese and diet-induced obese mice [16]. Furthermore, fission inhibition and/or fusion activation have been found to counteract many of the disease phenotypes related to IR and diabetes [17].
As regards the effects of omega-3 PUFA on mitochondrial dynamic behavior, it has been found that, in steatotic hepatocytes “in vitro”, omega-3 PUFAs may change mitochondrial morphology and have beneficial effects on recovery of mitochondrial function by increasing the expression of Mfn2 [18].
At present, to our knowledge, we do not have a global view of the proteins directly involved in mitochondrial fusion (MFN2, OPA1) or in fission (DRP1, FIS1) in skeletal muscle during high fat induced obesity and insulin resistance in animal models of disease, neither it has been performed a study to evaluate the effects of fish oil on the skeletal muscle mitochondrial dynamic behavior in the whole. Therefore, the aim of the present study was to perform a study to compare the effects of high-lard (HL) (mainly saturated fatty acids) vs. high-fish oil (HFO) (mainly omega-3 polyunsaturated fatty acids) diet on mitochondrial morphology and dynamic behavior in rat skeletal muscle as well as to evaluate the association between these features and insulin-resistance development. To this end, we analyzed systemic and skeletal muscle insulin resistance (by evaluating glucose/insulin ratio and IRS1 phosphorylation, respectively) and we evaluate morphological features and the presence of fusion/fission protein, by electron microscopy and immunoistochemical approaches, respectively. The results showed that highlard feeding elicited mitochondrial fission morphotype with enhanced presence of fission proteins and reduced presence of Mfn2 in skeletal muscle associated with systemic insulin resistance and obesity development, whereas high-fish oil feeding evocated a prevalence of skeletal muscle mitochondrial fusion events associated with an higher systemic insulin sensibility and anti-obesity effects. These findings open new perspectives on the role of mitochondrial dynamic behavior in the study of fatty acids effects in obesity and associated disease development.
2. Experimental Procedures
Before you begin to format your paper, first write and save the content as a separate text file. Keep your text and graphic files separate until after the text has been formatted and styled. Do not use hard tabs, and limit use of hard returns to only one return at the end of a paragraph. Do not add any kind of pagination anywhere in the paper. Do not number text heads—the template will do that for you.
Finally, complete content and organizational editing before formatting. Please take note of the following items when proofreading spelling and grammar.
2.1. Materials
Analytical grade chemicals were used, from Sigma (St Louis, MO, USA). The fish oil used was cod-liver oil (New.Fa.Dem. srl, Giugliano, Naples, Italy).
2.2. Animals and Diets
Male Wistar rats aged 60 days (Charles River Italia, Calco, Como, Italy) were caged singly in a temperaturecontrolled room at 24˚C with a 12 h light-dark cycle. They were divided into 3 groups (8 rats each), in each of which mean body weight was about 400 g. For 6 weeks, the first group (N) received a standard diet (10.6% fat J/J), the second group (L) the HL diet (40% fat J/J) and the third group (F) the HFO diet (40% fat J/J). Diet compositions are shown in Table 1. The high-fat diets was formulated to differ from the standard diet only in the fat and carbohydrate contribution to the energy value but to be identical in terms of protein, vitamins, minerals, and fiber, as previously reported [19]. The experimental design was repeated three times (different rats being used each time) for all the required measurements to be made. In particular, groups of rats were fasted overnight to determine basal glucose and serum insulin levels. For the
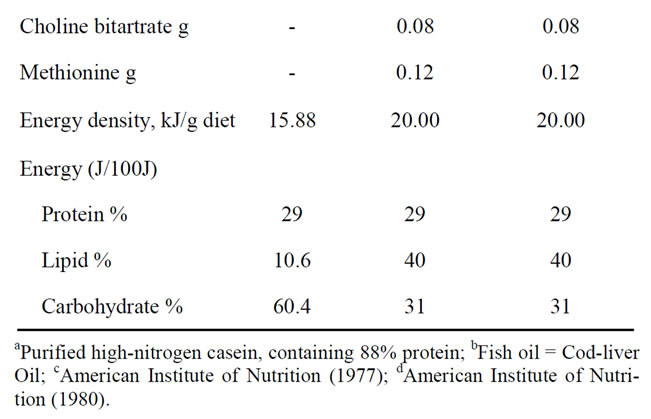
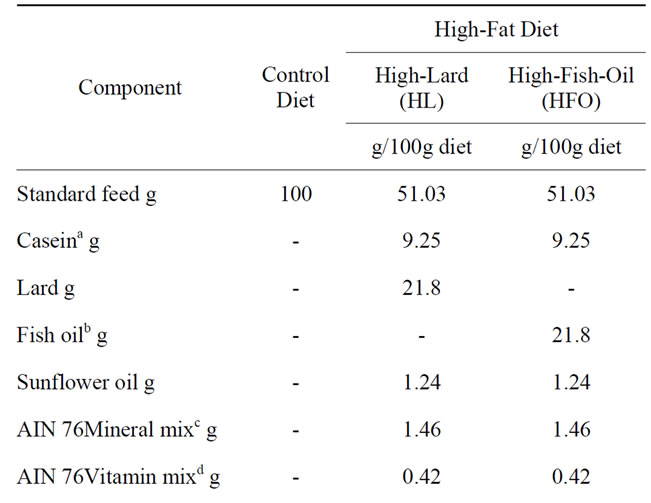
Table 1. Composition of diets.
measurements of insulin-dependent phosphorylation of insulin receptor substrate 1 (IRS1), rats that had fasted for five hours, were euthanized 15 min after an i.p. injection of insulin (homolog rapidacting, 10 units/kg body wt; Novartis, Basel, Switzerland). Moreover, groups of fed rats were used to analyze mitochondrial dynamics. All animals received humane care according to the criteria set by the National Institutes of Health.
At the end of the dietary treatment, rats were anaesthetized by injection of chloral hydrate (40 mg/100g body weight, i.p.) and blood was taken via the inferior vena cava. Skeletal muscles (gastrocnemius) were removed and immediately processed for morphological analysis.
2.3. Determination of Serum Parameters and Skeletal Muscle Lipid Content
Serum TNFα levels were measured using ELISA kits (Thermoscientific, Rockford, IL). Serum levels of glucose and insulin were determined by means of a glucose monitor (BRIO, Ascensia, NY), calibrated for use with rats and ELISA (Mercodia rat insulin; Mercodia, Uppsala, Sweden), respectively.
Lipid content was determined by the gravimetric method of Folch [20].
2.4. Light Microscopy and Immunohistochemistry
Small pieces of skeletal muscles (gastrocnemius) were fixed in Bouin’s fluid, embedded in paraplast and cut at 4 - 5 μm. Immunohistochemical reactions were performed using serial sections that were immunostained by PAP (peroxidase-antiperoxidase) reaction and by Polymerbased method using mammalian polyclonal antibodies (Sternberger, 1974). Polyclonal antibodies against Mfn2 (1:200) (Abcam, Cambridge, UK), OPA1 (1:200) (Novus Biologicals, Cambridge, UK), DRP1 (1:200) (Santa Cruz, CA), hFIS1 (1:400) (Santa Cruz, CA), IRS1 (1:400) and phosphorylated IRS1 (pIRS1 Tyr 632) (1:400) (Santa Cruz, CA). The following control procedures were performed to test the specificity of the reagents: 1) omission of the primary antiserum and incubation of the sections either with immune or nonimmune serum (1:10 and 1:20); 2) absorption of the primary antiserum with its specific peptide (10 nmol/mL of optimally diluted antiserum) for 24 h at 4˚C. When specific peptides were used, the staining was abolished [21]. Images of sections were acquired using a Zeiss Axioskop microscope equipped with a TV camera.
2.5. Electron Microscopy (EM) and Morphometric Analyses
Conventional EM technique was used, as previously described [22]. Briefly, thin strips of muscle were placed immediately into cold 2.5% glutaraldehyde in 0.1 M phosphate buffer solution (pH 7.4) at 4˚C for 2 h. After a brief rinsing in the phosphate buffer solution, they were postfixed in 1 % OsO4 in 0.1 M phosphate buffer solution (pH 7.4) at 4˚C for 2h, dehydrated in an ascending concentration of alcohol, and embedded in Epon. All embedded specimens were sectioned with diamond knives on an LKB ultramicrotome. Thin sections mounted on grids were stained with uranyl acetate and with lead citrate, and examined with CM 12 Philips electron microscope at the interdepartmental center for electron microscopy (CISME).
Fifteen electron microscopy images/animals were analyzed by Zeiss Axiovision image analysis system to score the number of fusion/fission events.
2.6. Data Analysis
ANOVA followed by the Newman-Keuls test to correct for multiple comparisons. Differences were considered statistically significant at P < 0.05. All analyses were performed using GraphPad Prism (GraphPad Software, San Diego, CA).
3. Results
3.1. Body-Weight Gain and Serum Metabolite Levels
L rats exhibited the highest body weight gain among the three experimental groups, even if both L and F rats showed a similar increases in energy intake over the intake of control group (Table 2). As regards inflammatory markers, we assayed serum TNFα levels and Table 2 showed that it markedly increased in L rats (+97%) compared to N ones. On the other hand, F rats showed no significant increased serum TNFα levels (+11%) compared to N, and this increase was significantly lower compared to that found in L rats (Table 2). We then evaluated systemic insulin resistance development by calculating fasting serum glucose/insulin (G/I) ratio. Fasting serum glucose levels was higher in L (+33%) and F (26%) rats compared to controls (Table 2). On the other hand, L rats exhibited the highest values of fasting serum insulin levels, whereas insulin levels in F rats was no significantly increased compared to controls. The determination of G/I ratio values, as index of insulin resistance development, showed that L rats exhibited a significantly decreased ratio compared to N and F rats, suggesting development of insulin resistance only in L rats (Table 2).
3.2. Immunohistochemical Analysis of the Proteins Relevant to Insulin Resistance and Mitochondrial Dynamics
IRS1 phosphorylation on tyrosine632 plays a key role in insulin signalling pathway. Therefore, in order to evalu
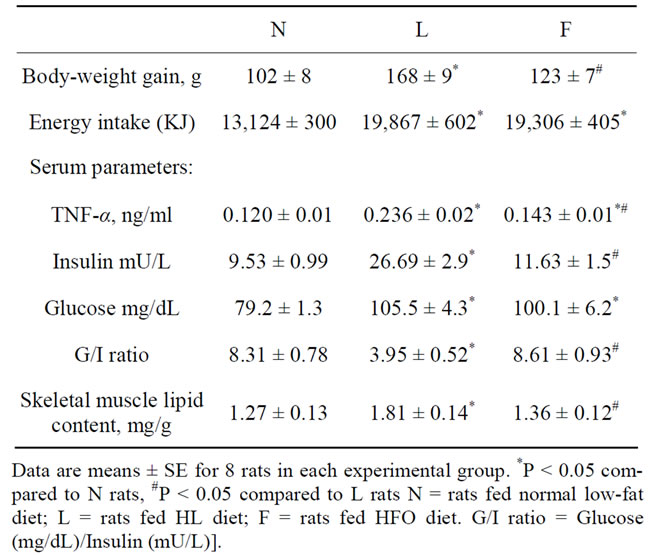
Table 2. Body-weight gain, energy intake, serum parameters and skeletal muscle lipid content in rats fed a normal, HL or HFO diet.
ate skeletal muscle insulin resistance development, we assessed the presence of both IRS1 and pIRS1 (tyr632) by immunohistochemical analysis in skeletal muscle sections. The immunostaining for IRS1 was detected in N and F groups while in L rats the immunostaining was reduced. The immunoreactivity for pIRS1 (tyr632) was also absent or very weak only in L sections, while it was evident in N and F rats (Figure 1).
To evaluate the mitochondrial fusion and fission processes, we investigated at light microscopy level the presence of the four main proteins involved in these processes, (Mfn2 and OPA1 for fusion and DRP1 and Fis1 for fission), by the means of immunohistochemistry in skeletal muscle sections. The immunoreactivity for Mfn2 showed a different localization in N and in L fibers. Infact, in N skeletal muscle sections, the immunostaining for Mfn2 was essentially peripheral in most of the fibers with some fibers also immunoreactive in the central part, whereas only very few fibers were immunostained in central part in L sections. F skeletal muscle sections showed an intermediate distribution of immunoreactivity between N and L with a great number of fibers immunostained in the central part. The immunostaining for Opa1 was heavily present at the periphery and weakly in the central part of the fibers in N and F rats with some fibers more labeled than others. L fibers did not shown any difference in the distribution of OPA1 immunostaining among the fibers which seemed less immunoreactive compared to N and F (Figure 2). The immunostaining for DRP1 was also mainly localized at the periphery of the fibers. In L rats some fibers appeared to be more heavily labelled. The immunoreactivity for Fis1 was superimposed on that of DRP1 (Figure 2).
3.3. Electron Microscopy
The ultrastructure features of skeletal fibers showed the
Figure 1. Skeletal muscle insulin resistance markers. IRS: three sections of N, L and F gastrocnemius fibers immunostained for this protein. Note that the labeling is strong for N rats and very weak for L rats, while F animals showed an immunostaining similar to N. pIRS (Tyr632): the immunostaining showed a very reduced tyrosine insulin receptor substrate-1 phosphorylation in L rats.
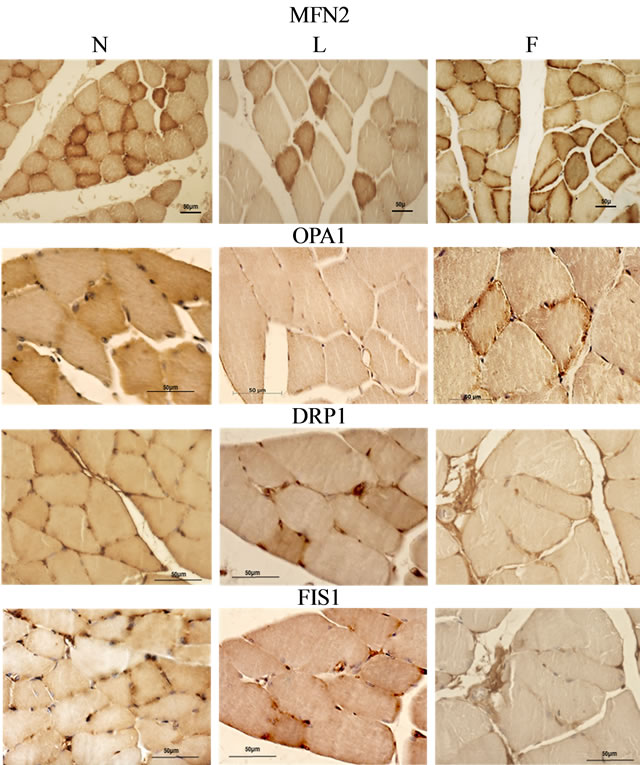
Figure 2. Proteins involved in mitochondrial dynamic behavior. MFN2: three sections of N, L and F gastrocnemius fibers immunostained for MFN2. The immunostaining is localized at the periphery for the most the fibers, and also in central part for some fibers of the control skeletal muscle (N). It was essentially peripheral in L where only few fibers were strongly immunostained in the central part, while F skeletal fibers showed an intermediate distribution of immunoreactivity between N and L, with a greater number of fibers that exhibited heavy immunostaining in the central part. OPA1: the immunostaining for Opa1 was strongly present at the periphery of the fibers and lightly in the central part. In N and F rats some fibers were more labeled than others. In L there was no difference among the fibers. DRP1: The immunostaining for this protein followed that of previous described proteins, in fact it was mainly localized at the periphery of the fibers. In L rats some fibers appeared more heavely labeled. Fis1: labeling for Fis1 was superimposed on that of DRP1.
three types of fibers were present in gastrocnemius. The main ultrastructural differences among the fibers were due to the thickening of Z line, the abundance and size of mitochondria, the glycogen content, and depth of subsarcolemmal (SS) mitochondria aggregation (Figure 3(a)). In N rats, the intermyofibrillar (IMF) mitochondria exhibited a clear matrix, tubular cristae and glycogen content intermediate between L and F rats. In L rats, many mitochondria presented a clear matrix with disorganized cristae. In some images it could be noted a deep furrow which extend into the organelle, suggesting a fission process. In F the mitochondrial matrix was somewhat more dense with some dilated cristae (Figure 3(b)).
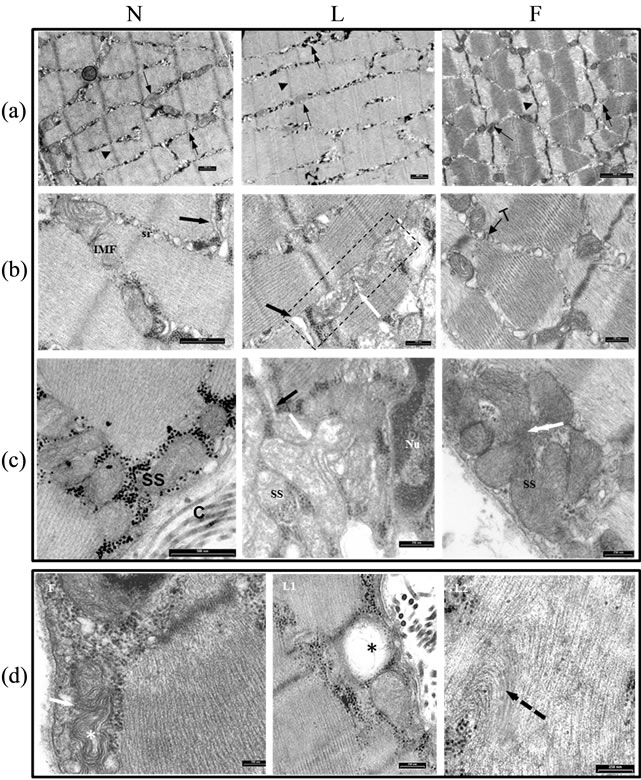
Figure 3. Skeletal muscle mitochondrial ultrastructural features. (a) three ultrathin sections of N, L and F gastrocnemius fibers. Note the differences, among the fibers, in size of mitochondria (arrow), in Z line thickening (arrowhead) and glycogen content (double arrow), presumably due to different fiber types type I (slow-twitch oxidative red fibers), type IIA (fast-twitch fibers glycolytic oxidative) and IIB (fast-twitch fibers glycolytic white fibers); (b) Three ultrathin sections of N, L and F skeletal muscle. Intramyofibrillar (IMF) mitochondria exhibited different ultrastructural features, the cristae were mainly tubular, the matrix was meanly electron lucent in N rats, in F the matrix was somewhat more dense with some dilated cristae. In L rats among the IMF mitochondria, many presented a clear matrix with disorganized cristae. In the rectangle a furrow (white arrow) was forming suggesting a fission process; (c) Subsarcolemmal mitochondria (SS). Note the differences in the quantity of mitochondria close to sarcolemma. In L, the white arrow points to a budding formation from a mitochondrion suggesting a fission event. The black arrow indicates a T tubule. In F, the white double arrow points to a probable mitochondrial fusion event; (d) in F, the arrow indicates two mitochondria ongoing to fission/fusion event; either mitochondria showed a myelinic figure-like feature. L1 it could be noted the presence of some swollen mitochondria (asterisk). L2 some myofilaments in the sarcomere presented a distortion in their arrangement (interrupted arrow). Sr = sarcoplasmatic reticulum, T = triad, the black arrow indicates a T tubule.
As regards the SS mitochondria, subsarcolemmal aggregations of large, closely packed mitochondria are moderately abundant particularly in F and to a lesser extent in L rats.
In L rats, fission events could be suggested by the presence of budding formation from mitochondrion. In images suggesting probable mitochondrial fusion event could be seen (Figure 3(c)). In particular, SS myelin figure-like mitochondrion in close apposition with another one suggested on-going fission/fusion process. Some swollen mitochondria could be seen in L rats. Finally in a sarcomere of L rats some myofilaments presented a distortion in their arrangement (Figure 3(d)).
4. Discussion
The main aim of the present work was to evaluate whether high-lard (mainly saturated fatty acids) and high-fish oil (mainly omega-3 polyunsaturated fatty acids) diets differently affect mitochondrial morphology and dynamic behavior in skeletal muscle associated with obesity and insulin-resistance development in experimental animal model.
We firstly evaluated the development of obesity, systemic inflammation and insulin resistance and, as expected, we found that 6 weeks high-lard feeding elicited higher body weight gain and serum TNFα levels as well as insulin-resistance development (as showed by the lower G/I ratio) compared to the standard feeding. On the other hand, the replacement of lard (saturated fatty acids) with fish oil (ω-3 fatty acids) in high-fat diet elicited lower increase in body weight gain and serum TNFα levels associated with normal G/I ratio. These findings suggested that dietary omega-3 fatty acids (fish oil), even when administrated as source of fat in chronic high fat feeding, have preventive effects on obesity and systemic inflammation and insulin resistance development, differently from dietary saturated fatty acids (lard).
Given that the main tissue involved in insulin resistance development is skeletal muscle, we evaluate skeletal muscle insulin resistance by performing immunoistochemical analysis of IRS1 and pIRS (Tyr632), a key molecule in insulin signalling pathway: in fact, insulin signalling involves IRS1 phosphorilation on Tyr632. Accordingly with systemic insulin resistance development, high-lard feeding induced also a defect in insulin signalling pathway with a lower immunoreactivity to IRS1 and pIRS (Tyr632). As regards the low immunoreactivity for IRS1 in L rats, this result agreed with Yuzefovych et al. (2013) [23] who found a significantly reduced IRS1 content in skeletal muscle of high-fat diet fed mice. In line with our finding, Yaspelkis et al. (2009) [24] described a decreased in pIRS (Tyr632) in high-fat fed rats. On the other hand, the replacement of lard with fish oil in chronic overfeeding elicited IRS1 and pIRS (Tyr632) immunoreactivity similar to control diet, in agreement with the normal G/I ratio. We also showed that high-lard feeding induced less phosphorylation of PKB/AKT, another key protein in insulin signalling in skeletal muscle, whereas high-fish oil feeding does not (unpublished data).
The present work was then focused on the analysis of proteins involved in mitochondrial dynamic behavior, fusion and fission processes, since these processes have been recently suggested to play an important role in insulin resistance development associated to obesity [9,15]. We chose to utilize electron microscopy and immunohistochemical approach to observe mitochondrial morphotype and the relative abundances (related to the intensity of the immunostaining) of proteins involved in fusion (Mfn2 and OPA1) and fission (DRP1 and Fis1) processes, respectively.
The results showed that immunoreactivities for fusion proteins (Mfn2 and OPA1) were weaker in L skeletal muscle sections compared to N ones, whereas L sections exhibited the strongest immunoreactivity for protein involved in fission processes (DRP1 and Fis1) among the three experimental groups. Moreover, F rats showed an immunostaining for fusion proteins similar but more pronounced compared to that of N rats. For fission proteins, F skeletal muscle fibers were behaving like N ones, but the immunoreactivity was less intense. These results confirmed a reduced fusion process and increased fission events in obese-insulin resistant rats, in agreement with previous finding [9,15-17], while the contrary happens for high-fish oil fed rats. These findings suggested for the first time that the anti-obesity and beneficial effects of fish oil feeding on insulin resistance development may be associated to changes in mitochondrial dynamic behavior in skeletal muscle. In fact, given that we also found a different skeletal muscle insulin resistance development, as showed by IRS1 and pIRS1 immunostaining, it could be suggested that changes in mitochondrial dynamic behavior were associated with different skeletal muscle insulin sensibility in L and F rats.
As for electron microscopy observations, they confirm the trend to a shift towards fission for L skeletal muscle mitochondria, as suggested by the images of furrow cleaving an organelle and budding formation. In some cases mitochondria seemed impaired as shown by the presence of disorganized cristae and swollen organelle. In one case the myofilaments presented distortion. In F skeletal muscle, instead, the images of fusion were prevailing.
Our finding on the effects of different dietary fatty acids on skeletal muscle mitochondrial dynamic behavior may be associated with effects on inflammatory processes involved in insulin resistance development. Inflammatory markers, such as tumor necrosis factor (TNF)-α, are involved in obesity related-insulin resistance [25]. In fact, several animal models of obesity and insulin resistance show significantly higher levels of TNF-α mRNA and protein compared with their lean counterparts [26,27]. Moreover, neutralization of TNF-α with a soluble TNF-α receptor-IgG fusion protein ameliorates insulin sensitivity [28]. Regards the correlation between inflammatory markers and mitochondrial dynamic behavior, Bach and coll. obtained some evidence indicating that TNF-α inhibits Mfn2 gene expression in cells in culture [29], suggesting that inflammatory parameters may play a regulatory in vivo role on Mfn2.
Our data gave support to the hypothesis of inflammatory parameters involvement in the reduced fusion process associated with obesity and insulin-resistance in vivo. In fact, pro-inflammatory dietary fatty acids (such as that found in lard), which were characterized by an increased systemic inflammatory parameters, such as TNF-α, reduced Mfn2 and induced fission phenotype. On the other hand, the anti-inflammatory effect of omega-3 dietary fatty acids (such as that found in fish oil which elicited systemic TNF-α levels comparable to that found in N rats) was associated with no reduction in skeletal muscle Mfn2 content and a tendency to mitochondrial fusion.
It is interesting to notice that fusion process has been suggested to rescue cellular stress by allowing functional mitochondria to complement dysfunctional mitochondria by diffusion and sharing of components between organelles [30]. Therefore, the shift toward fusion observed during high-fish oil feeding may be an adaptive mechanism to counteract the cellular stress induced by chronic high-fat diet.
All together, the results of the present works gave an interesting impulse to the research on the involvement of mitochondrial dynamic fusion/fission processes in the positive effect of dietary ω-3 polyunsaturated fatty acids on systemic and tissue insulin resistance prevention associated with anti-inflammatory and anti-obesity effects.
REFERENCES
- S. Ikemoto, M. Takahashi, N. Tsunoda, K. Maruyama, H. Itakura and O. Ezaki, “High-Fat Diet-Induced Hyperglycemia and Obesity in Mice: Differential Effects of Dietary Oils,” Metabolism, Vol. 45, No. 12, 1996, pp. 1539- 1546. doi:10.1016/S0026-0495(96)90185-7
- N. Tsuboyama-Kasaoka, K. Sano, C. Shozawa, T. Osaka, and O. Ezaki, “Studies of UCP2 Transgenic and Knockout Mice Reveal that Liver UCP2 Is Not Essential for the Antiobesity Effects of Fish Oil,” American Journal of Physiology: Endocrinology Metabolism, Vol. 294, No. 3, 2008, pp. E600-E606. doi:10.1152/ajpendo.00551.2007
- N. Tsuboyama-Kasaoka, M. Takahashi, H. Kim and O. Ezaki, “Up-Regulation of Liver Uncoupling Protein-2 mRNA by either Fish Oil Feeding or Fibrate Administration in Mice,” Biochemical and Biophysical Research Communications, Vol. 257, No. 3, 1999, pp. 879-885. doi:10.1006/bbrc.1999.0555
- L. H. Storlien, E. W. Kraegen, D. J. Chisholm, G. L. Ford, D. G. Bruce and W. S. Pascoe, “Fish Oil Prevents Insulin Resistance Induced by High-Fat Feeding in Rats,” Science, Vol. 237, No. 4817, 1987, pp. 885-888. doi:10.1126/science.3303333
- L. H. Storlien, A. B. Jenkins, D. J. Chisholm, W. S. Pascoe, S. Khouri and E. W. Kraegen, “Influence of Dietary Fat Composition on Development of Insulin Resistance in Rats: Relationship to Muscle Triglyceride and ω-3 Fatty Acids in Muscle Phospholipid,” Diabetes, Vol. 40, 1991, pp. 280-289. doi:10.2337/diabetes.40.2.280
- L. G. D. Fryer, K. A. Orfali, M. J. Holness, E. D. Saggerson and M. C. Sugden, “The Long-Term Regulation of Skeletal Muscle Pyruvate Dehydrogenase Kinase by Dietary Lipid Is Dependent on Fatty Acid Composition,” European Journal of Biochemistry, Vol. 229, 1995, pp. 741-748. doi:10.1111/j.1432-1033.1995.tb20522.x
- K. F. Petersen, D. Befroy, S. Dufour, J. Dziura, C. Arijan, D. L. Rothman, et al., “ Mitochondrial Disfunction in The Elderly: Possible Role in Insulin Resistance,” Science, Vol. 300, No. 5622, 2003, pp. 1140-1142. doi:10.1126/science.1082889
- S. Iossa, M. P. Mollica, L. Lionetti, R. Crescenzo, R. Tasso and G. Liverini, “A Possible Link between Skeletal Muscle Mitochondrial Efficiency and Age-Induced Insulin Resistance,” Diabetes, Vol. 53, No. 11, 2004, pp. 2861-2866. doi:10.2337/diabetes.53.11.2861
- M. Liesa, M. Palacin and A. Zorzano, “Mitochondrial Dynamics in Mammalian Health and Disease,” Physiological Reviews, Vol. 89, No. 3, 2009, pp. 799-845. doi:10.1152/physrev.00030.2008
- F. G. Toledo, S. Watkins and D. E. Kelley, “Changes Induced by Physical Activity and Weight Loss in the Morphology of Intermyofibrillar Mitochondria in Obese Men and Women,” Journal of Clinical Endocrinology & Metabolism, Vol. 91, No. 8, 2006, pp. 3224-3227. doi:10.1210/jc.2006-0002
- J. Nunnari, E. D. Wong, S. Meeusen and J. A. Wagner, “Studying the Behavior of Mitochondria,” Methods in Enzymology, Vol. 351, 2002, pp. 381-393. doi:10.1016/S0076-6879(02)51859-0
- C. S. Palmer, L. D. Osellame, D. Stojanovski and M. T. Ryan, “The Regulation of Mitochondrial Morphology: Intricate Mechanisms and Dynamic Machinery,” Cell Signalling, Vol. 23, No. 11, 2011, pp. 1534-1545. doi:10.1016/j.cellsig.2011.05.021
- L. Pellegrini and L. Scorrano, “A Cut Short to Death: Parl and Opa1 in the Regulation of Mitochondrial Morphology and Apoptosis,” Cell Death and Differentiation, Vol. 14, 2007, pp.1275-1284. doi:10.1038/sj.cdd.4402145
- S. Cipolat, O. Martins de Brito, B. Dal Zilio and L. Scorrano, “OPA1 Requires Mitofusin 1 to Promote Mitochondrial Fusion,” Proceedings of the National Academy of Sciences USA, Vol. 101, No. 45, 2004, pp. 15927- 15932. doi:10.1073/pnas.0407043101
- D. Bach, S. Pich, F. X. Soriano, N. Vega, B. Baumgartner, et al., “Mitofusin-2 Determines Mitochondrial Network Architecture and Mitochondrial Metabolism. A Novel Regulatory Mechanism Altered in Obesity,” Journal Biological Chemistry, Vol. 278, No. 19, 2003, pp. 17190- 17197. doi:10.1074/jbc.M212754200
- H. F. Jheng, P. J. Tsai, S. M. Guo, L. H. Kuo, C. S. Chang, et al., “Mitochondrial Fission Contributes to Mitochondrial Dysfunction and Insulin Resistance in Skeletal Muscle,” Molecular and Cellular Biology, Vol. 32, 2012, pp. 309-319. doi:10.1128/MCB.05603-11
- A. E. Civitarese and E. Ravussin, “Mitochondrial Energetics and Insulin Resistance,” Endocrinology, Vol. 149, No. 3, 2008, pp. 950-954. doi:10.1210/en.2007-1444
- Y. Zhang, L. Jiang, W. Hu, Q. Zheng and W. Xiang, “Mitochondrial Dysfunction during in Vitro Hepatocyte Steatosis is Reversed by Omega-3 Fatty Acid-Induced Up-Regulation of Mitofusin 2,” Metabolism, Vol. 60, No. 6, 2011, pp. 767-775. doi:10.1016/j.metabol.2010.07.026
- S. Iossa, L. Lionetti, M. P. Mollica, R. Crescenzo, M. Botta, A. Barletta and G. Liverini, “Effect of High-Fat Feeding on Metabolic Efficiency and Mitochondrial Oxidative Capacity in Adult Rats,” British Journal of Nutrition, Vol. 90, No.5, 2003, pp. 953-960. doi:10.1079/BJN2003000968
- J. Folch, M. Lees and G. H. S Stanley, “A Simple Method for the Isolation and Purification of Total Lipids from Animal Tissues,” Journal of Biological Chemistry, Vol. 226, 1957, pp. 497-510.
- S. Buono, L. Cristiano, B. D’Angelo, A. Cimini and R. Putti, “Pparalpha Mediates the Effects of the Pesticide Methyl Thiophanate on Liver of the Lizard Podarcis Sicula,” Comparative Biochemistry and Physiology: Toxicology & Pharmacology, Vol. 145, No. 3, 2007, pp. 306-314. doi:10.1016/j.cbpc.2006.12.016
- R. Putti and A. della Rossa, “Peptideyy and Insulin Coexist in Β-Granules in B Cells of the Madagascan Lizard Zonosaurus Laticaudatus,” General and Comparative Endocrinology, Vol. 103, 1996, pp. 249-256.
- L. V. Yuzefovych, S. I. Musiyenko, G. L. Wilson and L. I. Rachek, “Mitochondrial DNA Damage and Dysfunction, and Oxidative Stress Are Associated with Endoplasmic Reticulum Stress, Protein Degradation and Apoptosis in High Fat Diet-Induced Insulin Resistance Mice,” PLoS One, Vol. 8, No. 1, 2013, Article ID: e54059. doi:10.1371/journal.pone.0054059
- B. B. Yaspelkis III, I. A. Kvasha and T. Y. Figuero, “High-Fat Feeding Increases Insulin Receptor and IRS-1 Coimmunoprecipitation with SOCS-3, Ikkα/Β Phosphorylation and Decreases PI-3 Kinase Activity In Muscle,” American Journal of Physiology Regul Integr Comp Physiol, Vol. 296, No. 6, 2009, pp. R1709-R1715.
- G. S. Hotamisligil, “The Role of TNF-α and TNF Receptors in Obesity and Insulin Resistance,” Journal of Internal Medicine, Vol. 245, No. 6, 1999, pp. 621-625. doi:10.1046/j.1365-2796.1999.00490.x
- G. S. Hotamisligil, A. Budavari, D. Murray and B. M. Spiegelman, “Reduced Tyrosine Kinase Activity of the Insulin Receptor in Obesity Diabetes. Central Role of Tumor Necrosis Factor-Alpha,” Journal Clinical Investigation, Vol. 94, No. 4, 1994, pp. 1543-1549. doi:10.1172/JCI117495
- G. S. Hotamisligil, P. Peraldi, A. Budavari, R. Ellis, M. F. White and B. M. Spiegelman. “IRS-1-Mediated Inhibition of Insulin Receptor Tyrosine Kinase Activity in TNFAlphaand Obesity-Induced Insulin Resistance,” Science, Vol. 271, No. 5249, 1996, pp. 665-668. doi:10.1126/science.271.5249.665
- G. S. Hotamisligil, N. S. Shargill and B. M. Spiegelman, “Adipose Expression of Tumor Necrosis Factor-Alpha: Direct Role in Obesity-Linked Insulin Resistance,” Science, Vol. 259, No. 5091, 1993, pp. 87-91. doi:10.1126/science.7678183
- D. Bach, D. Naon, S. Pich, F. X. Soriano, N. Vega, J. Rieusset, et al., “Expression of Mfn2, the Charcot-MarieTooth Neuropathy Type 2A Gene, in Human Skeletal Muscle: Effects of Type 2 Diabetes, Obesity, Weight Loss, and the Regulatory Role of Tumor Necrosis Factor Alpha and Interleukin-6,” Diabetes, Vol. 54, No. 9, 2005, pp. 2685-2693. doi:10.2337/diabetes.54.9.2685
- R. J. Youle and A. M. van der Bliek, “Mitochondrial Fission, Fusion, and Stress,” Science, Vol. 337, No. 6098, 2012, pp. 1062-1065. doi:10.1126/science.1219855