Food and Nutrition Sciences
Vol.3 No.11(2012), Article ID:24608,9 pages DOI:10.4236/fns.2012.311207
Fe2+ Coupled with Vitamin c (Vc) Can Enhance Glucose Metabolism and Decrease Blood Glucose Levels of Alloxan-Induced Diabetic Mice
![]()
1Jiangsu Alphay Bio-technology Co. Ltd., Nantong, China; 2School of Food science and Biological Engineering, Jiangsu University, Zhenjiang, China.
Email: *zhangzhicai2001@yahoo.com.cn
Received September 27th, 2012; revised October 27th, 2012; accepted November 4th, 2012
Keywords: Glucose Metabolism; Glucose Consumption; FeSO4; Oxidant Stress; Vc
ABSTRACT
That FeSO4 not FeCl3 can reduce the blood glucose levels of alloxan-induced diabetes mice has been reported in previous research. This study explained the cause of difference in activity of two different iron ions on diabetic mice based on glucose consumption (GC). FeSO4, FeCl3, Vitamine c (Vc), FeSO4 + Vc, metformin were administrated to the alloxan induced-diabetic mice, respectively. After administrated, serum glucose, fructosaminr, insulin, triglyceride, total cholesterol, total iron and Fe2+ levels and GC of liver in vivo were analyzed, respectively. In vitro, effect of different iron ions coupled with Vc or streptozotocin on GC of liver of diabetic mice of model group were analyzed. The body weights and serum insulin levels of Fe2+ and Fe2+ + Vc treated diabetic mice notably increased. The serum glucose, fructosamine, triglyceride and total cholesterol levels were significantly decreased, whereas serum total iron and Fe2+ levels and GC in liver were increased in the Fe2+, Vc and Fe2+ + Vc groups compared with in the model groups. In addition, hardly change of serum insulin level was caused by Fe2+, Vc and Fe2+ + Vc treatment. However, the similar resultst did not obtain a Fe3+ treated. Further, liver’s GC of untreated-diabetic mice was lower than of normal mice and significantly increased after Fe2+ not Fe3+ added to the reaction resolution in vitro, and further increased when Fe2+ and vitamin c (Vc) synchronously added to the reaction system, however, decreased when Fe2+ and Streptozotocin were added synchronously to the reaction resolution. It is suggested that iron coupled with reducer can enhance the glucose metabolism to eventually achieve to controlling blood glucose levels.
1. Introduction
Under normal physiologic conditions, there is a critical balance in generation of oxygen free radicals and antioxidant defense systems used by organisms to deactivate and protect themselves against free radical toxicity. However, rapid cultural and social changes, ageing populations, increasing urbanization, dietary changes, reduced physical activity and other unhealthy lifestyle and behavioral patterns has broken the balance and caused abrupt accumulation of free radical in vivo [1-4]. It has been generally accepted that free radicals can react with a variety of biomolecules, including lipids, carbohydrates, proteins, nucleic acids, and macromolecules of connective tissue, thereby interfering with cell function. However, whether and how accumulation of free radicals in vivo impact on glucose metabolism by other pathway can few be understood.
Iron (Fe), a trace element, is a key membrane component and an essential cofactor required for a number of cell functions. For example, 50% mitochondrial proteins operate smoothly in the present of iron. Iron has involved in many physiological functions as a major electroncarrier, such as, the tricarboxylic acid (TCA) cycle, oxygen transportation and oxidation-phosphorylation process [5]. Iron content and the special ration of Fe2+ and Fe3+ be maintained in vivo helped for the normal metabolic regulation of sugar, protein and lipid. The inter-conversion of Fe2+ and Fe3+ might be a critical factor for maintaining normal metabolism. However, if the inter-conversion rate from oxidized iron (Fe3+) to reduced iron (Fe2+) becomes slow for some reasons, iron will fail to play its function. There is evidence that falling oxidation stress in vivo was accompanied by increased serum iron (Fe2+) content [6]. It was found that after oral administration of [Cr3O(O2CCH2CH3)6(H2O)3]+ to healthy Sprague Dawley rats, plasma glucose and insulin levels simultaneously lowered [7,8]. Whether [Cr3O(O2CCH2CH3)6(H2O)3]+ weakened oxidant stress in vivo, increased the solubility of iron and finally lowered the blood glucose levels is worth further studying.
Diabetes was an epidemic whose critical character was foul-up of glucose metabolism. Among the factors to cause foul-up of metabolism, the Fe3+’s content increase, Fe2+ and total iron’s content decrease led by oxidant stress is the critical factor induced diabetes generation. In previous study, we have also reported that supplementation of FeSO4 can decrease blood glucose level and accelerate glucose metabolism [9].
Glucose consumption (GC), which is the amount of glucose degraded by the organ, tissue or organism in the unit time, reflects the speed of glucose metabolism. In this study, the effects of Fe2+, Fe3+, Vc, and co-effect of Fe2+ and Vc on serum glucose, lipid, fructosamine levels and serum Fe2+ and total iron content alloxan-induced diabetic were compared. Then we analyzed GC in liver of alloxan-induced diabetic mice in vitro and the changes of GC after complemented different forms of iron coupled with reducer vitamin c (Vc) and oxidant Stz to find the mechanism of oxidant stress and iron (Fe2+) to regulate blood glucose metabolism in alloxan-induced diabetes mice, Finally, we analyzed the mechanism that iron coupled with anti-oxidant controlled blood glucose levels and offered a new strategy for prevention and treatment of diabetes.
2. Material and Methods
2.1. Chemicals
Alloxan and Streptozotocin (STZ) were purchased from Sigma (St. Louis, MO, USA). Vitamin c (Vc), which content was more than 99%, was purchased from Ying Chen Chemical Co., Ltd. All chemicals used in this study were of analytical grade or higher.
2.2. Drug Administration in Experimental Animals
Male ICR mice with body weight of 16.46 +/− 2.21 g were purchased from the Central Animal Facility, Chinese Academy of Sciences (Nanjing, China). The animal certification number was SCXK Su20020018.
All the mice were kept in steel cages in the room with controlled temperature at 22˚C +/− 2˚C and a light/dark cycle of 12 h/12 h. They were fed with the standard pellet chow diet, which was comprised of (%) 5 corn oil, 23 casein, 31.9 corn starches, 30.4 sucrose, 5.3 cellulose, 1.2 vitamin complex and 3.7 mineral mixture, and allowed free access to the drinking water. Iron and Fe2+ content was 48 mg/Kg dry diet and 3.6 mg/Kg dry diet, respectively. The diabetic mice were induced by intraperitoneal injection of alloxan at a dose of 200 mg/kg body weight. The alloxan solution was freshly prepared with 0.1 mol/L citrate buffer (pH 4.0), kept in ice and injected immediately. Ten randomly selected mice that were only injected with citrate buffer were used as the normal group. Five days after injection of alloxan, blood was drawn from the tail vein of the fasted mice, The serum glucose level was determined by the glucose assay kit (Jiancheng Biological Institute, Nanjing, Jiangsu). These mice whose serum glucose levels exceeded 13 mmol/L were considered as the diabetic mice. All mice were not treated by insulin in the study. Procedures involving animal handling and care were conducted in conformity with the institutional guidelines of school of Medicine, Jiangsu University.
60 alloxan-induced diabetes mice (divided into six groups) and 10 normal mice as a normal group were used in the experiment. The mice were divided into the following seven treatment groups.
Group 1 (Normal group): Normal mice treated with the citrate buffer only.
Group 2 (Model group): Alloxan-treated diabetes mice intragastrically administrated with distilled water only.
Group 3 (FeSO4 group): Alloxan-treated diabetes mice daily gavaged with FeSO4 at a dose of 25 mg/Kg body weight [9].
Group 4 (FeCl3 group): Alloxan-treated diabetes mice daily gavaged with FeCl3 at a dose of 25 mg/Kg body weight [9].
Group 5 (Vc group): Alloxan-treated diabetes mice daily gavaged with Vc at a dose of 200 mg/Kg body weigh [10].
Group 6 (FeSO4 + Vc group): Alloxan-treated diabetes mice daily gavaged with FeSO4 at a dose of 25 mg/Kg body weight and Vc at a dose of 200 mg/Kg body weight.
Group 7 (Metformin group): Alloxan-treated diabetes mice daily gavaged with metformin at a dose of 50 mg/Kg body weight.
The blood glucose levels were checked every seven days. After continuously administrated drugs for 28 days, all mice were fasted overnight (18 - 24 hours), and their blood was drawn from the orbital sinus after anesthetization with ether and collected into the tubes containing potassium oxalate and sodium fluoride. These indexes including the blood insulin, glucose and fructosamine levels, Fe2+ and total iron content, blood total cholesterol, phopholipids, and triglycerides levels were determined with corresponding assay kit (Jiancheng Biological Institute, Nanjing, Jiangsu) according to their manufacturer’s protocols. And then, their liver tissues were excised immediately, washed with ice-cold saline, weighed and homogenized with 3 times 0.9% NaCl solution (1/3 parts (w/v)) in ice bath using a homogenizer. The homogenates were centrifuged at 10,000 × g for 15 minutes at 4˚C to discard any cell debris. The glucose consumption (GC) of supernatant was analyzed. Simultaneously, the effect of iron and oxidant (STZ) and reducer (vitamine c, Vc) on GC of diabetic mice in the model group was analysized.
2.3. The Design of Experiment in Vitro
To disclose the mechanism that iron coupled with oxidant stress regulated GC of diabetic mice, three test systems in vitro were designed using diabetes of model group and method and purpose of system was shown in Table 1.
2.4. Analytical Methods
The glucose consumption (GC) of mice’s liver was carried out according to the method described by Zhang et al. [11]. The reaction solution was composed of 1 mL supernatant of liver homogenates, 0.3 mL H2O and 1 mL pH 7.4 0.2 mol/L phosphate buffer solutions contained 0.2% glucose and 0.2% NaN3. Before incubated and after being incubated for 48 h at 37˚C, the sample of reaction solution was withdrawn for assaying glucose, respectively. The supernatant of liver exterminated activity homogenates in 80˚C for 60 min instead of the supernatant was used as control. Glucose was assayed by blood glucose assay kit according to the manufacturer’s protocols. After adding all of other solutions, the final stable reaction volume was adjusted by H2O. GC was calculated as follows:
 (1)
(1)
Gc: GC (g/48 h); CG: the glucose concentration of control tube. SG: the glucose concentration of sample tube.
The levels of blood glucose, fructosamine, total cholesterol and triglycerides in the serum samples were determined by their corresponding colorimetric assay kits (Jiancheng Biological Insititute, Nanjing, Jiangsu) according to the manufacturer’s protocols. The serum Fe2+ and total iron levels were determined with the phenanthroline spectrophotometry methods [12].
2.5. Statistical Analysis
Data were expressed as the mean ± SD for values obtained from ten mice in each group. Differences between groups were calculated by the Student’s t-test [13]. The differences between the means were assessed using Duncan multiple range test with p < 0.05 considered statistically significant.
3. Results
The animal’s body weights were stable and significant lower in FeCl3 group and diabetic model group than in normal group (Table 2) (p > 0.05), and the body weight
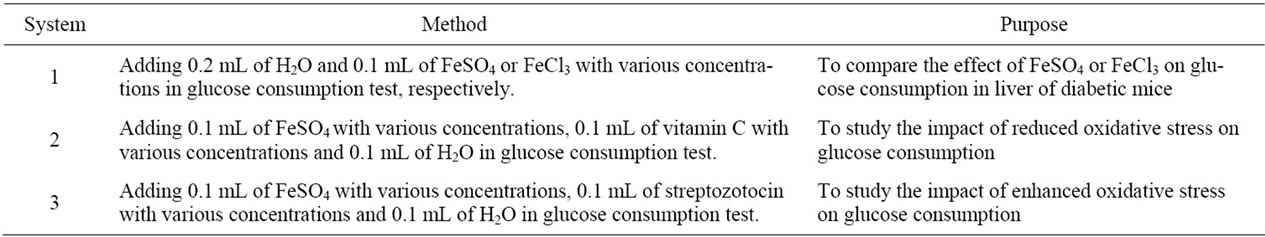
Table 1. The methods and purposes of three test systems.
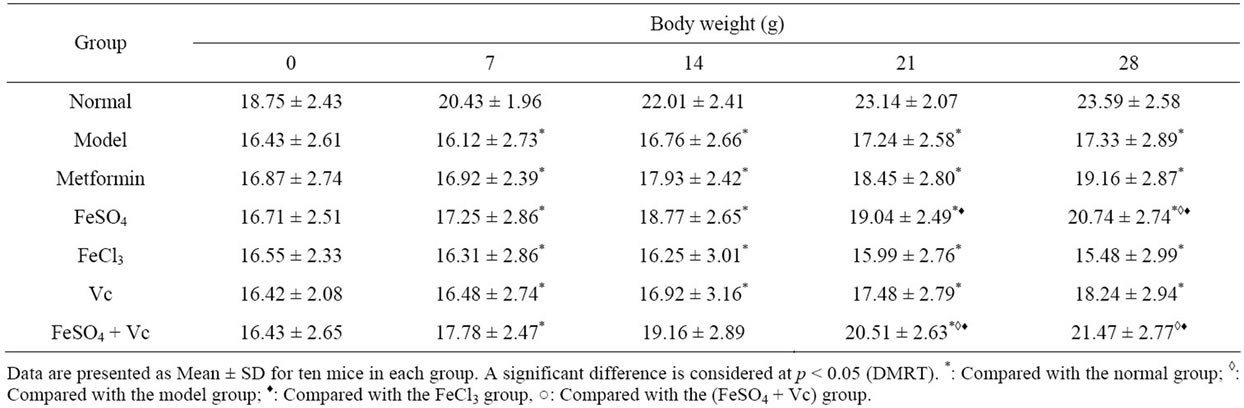
Table 2 Effect of tested drugs on body weight of diabetic mice for 28 days.
of animals in FeSO4, FeSO4 + Vc and metformin group were all significantly increased, and higher than not only their initial body weights but also the body weight of model group in the all experimental process (Table 2) (p < 0.05). Although the body weight of FeSO4 + Vc were higher than those of FeSO4 group, but no significant difference between two group’s body weight was found after administered drugs (p > 0.05). The levels of serum glucose in diabetic mice were summarized in Table 3. At the beginning of the experiment, all tested groups of mice had nearly the same blood glucose levels (p > 0.05) and their blood glucose levels were higher than those of normal group. The constant blood glucose levels of diabetic model group during all experimental process demonstrated that the model mice could be used to study. The results serum glucose levels of the mice in the FeSO4, FeSO4 + Vc and metformin groups decreased, and were significantly lower than those in the model group and FeCl3 group (p < 0.05). The difference of serum glucose levels was also found between FeSO4 + Vc and Vc group (p < 0.05).
The serum insulin levels of diabetes mice were lower than normal mice (Table 4). After administrated drugs, metformin remarkably elevated the serum insulin level of model animal and the similar effect was not found in other drugs group. The fructosamine and total triglyceride, cholesterol levels of model and FeCl3 group were significantly higher than those of normal group. No significant difference between FeCl3 and model group were observed in these indexes (p > 0.05) (Table 4). Compared those in the model group and FeCl3 treated mice, the serum fructosamine, triglyceride and total cholesterol levels in the FeSO4, Vc, FeSO4 + Vc and metformin groups were significantly decreased (p < 0.05). Moreover, these indexes of FeSO4 + Vc group were lower than of FeSO4 and Vc group (Table 4). Because of the alloxan induced effect, total iron and iron (II) were remarkably decreased in diabetic mice (Table 5). Supplying FeSO4, Vc and FeSO4 + Vc could increase the total iron and iron (II) levels. Especially, increase amount of the total iron and iron (II) of the FeSO4 + Vc group was biggest in three group. But the similar effect could be found in FeCl3 group.
The GC test in vitro (Figure 1) showed the GC was
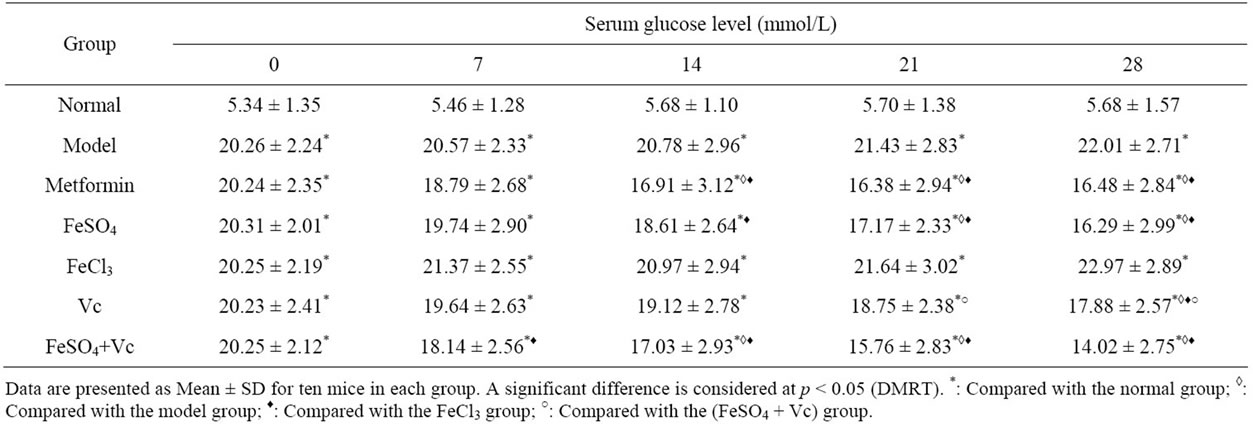
Table 3. Effect of test drugs on serum glucose level in diabetic mice for 28 days.
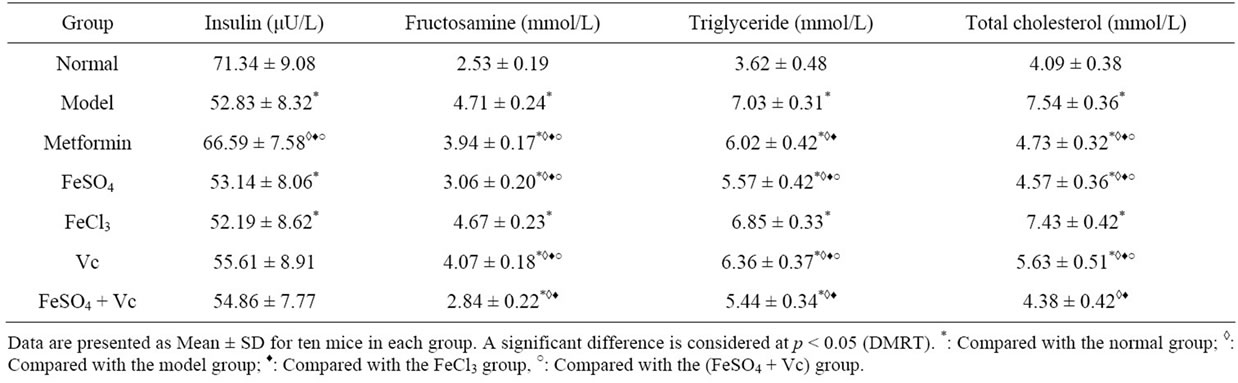
Table 4. Effect of test drugs on serum insulin, fructosamine, triglyceride and total cholesterol levels in diabetic mice for 28 days.
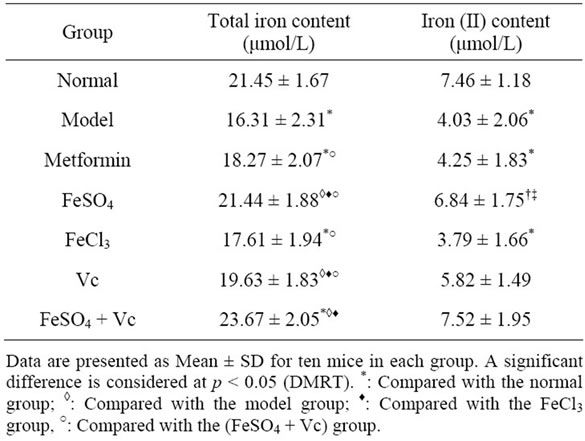
Table 5. Effect of FeSO4, FeCl3 and metformin on serum total iron and iron (II) contents in diabetic mice for 28 days.
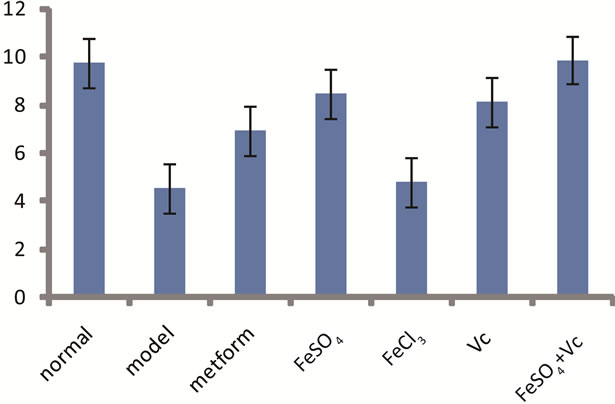
Figure 1. Effect of FeSO4, FeCl3, Vc, (FeSO4 + Vc) or metformin on glucose consumption in liver of diabetic mice for 28 days. Data are presented as Mean ± SD from ten mice in each group.
significantly lower in model group than in normal group. After administrated drugs, the GC of the animal liver in FeSO4, Vc, FeSO4 + Vc and metformin group increased significantly, especially, the GC in FeSO4 + Vc was nearly equal to the one in normal group. No significantly difference GC between FeCl3 and diabetic model groups was found.
After different concentration of FeSO4 and FeCl3 was added to the react solution, the GC of liver of diabetic mice showed different change (Figure 2). With the concentration of FeSO4 increasing from 0 to 0.6 mg/mL, the GC of diabetic mice’s liver gradually increased, when concentration of FeSO4 was between 0.6 - 0.8 mg/mL, the GC kept stable and when concentration of FeSO4 was over 0.8 mg/mL, the GC gradually reduced. However, with FeCl3 concentration increasing from 0 to 1 mg/mL, no significantly change in GC was observed.
Effect of the different concentration of FeSO4 coupled
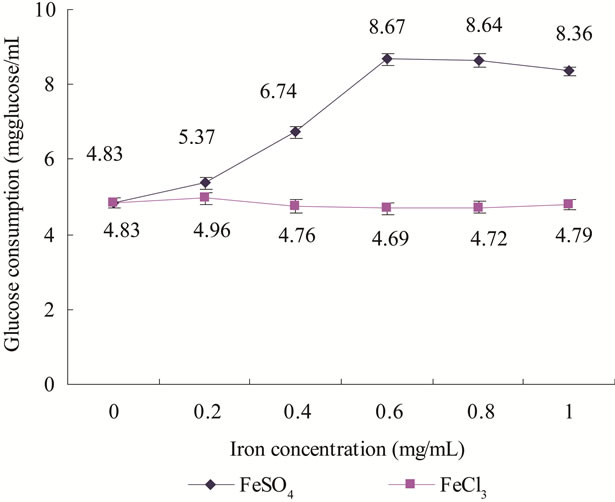
Figure 2. Effect of FeSO4 or FeCl3 on glucose consumption in liver of diabetic mice. :FeSO4;
 :FeCl3.
with varied amount of Vc on GC diabetes mice was studied (Figure 3). When Vc concentration increased from 0 to 0.6 mg/mL without FeSO4, the GC increased gradually and over 0.6 mg/mL, the GC stabilized all the time; with the Vc concentration increased from 0 to 0.6 mg/mL at 0.2 mg/mL FeSO4, the GC gradually increased and achieved the maximum (8.13 mg/mL) at the 0.6 mg/mL Vc; with the Vc concentration from 0 to 0.4 mg/mL at the 0.4 mg/mL FeSO4, the GC significantly enhanced, then stabilized when Vc concentration was between 0.4 - 0.8 mg/mL and the concentration of FeSO4 was over 0.8 mg/mL, GC sharply declined; GC has markedly increased with the concentration Vc rising from 0 to 0.2 mg/mL at 0.6 mg/mL FeSO4, but when the concentration Vc exceeded 0.2 mg/mL, GC significantly reduced. However, no matter how much FeSO4 was added to reactive solution, GC sharply declined in the present of streptozotocin (Figure 4). These results also showed that proper control of oxidative stress, supplying Fe2+ contributes to the regulation of glucose metabolism in animals.
4. Discussion
Many human diseases are associated with increased oxidative stress in body. Studies have observed that middle-aged and elderly patients with type 2 diabetes mellitus have higher levels of oxidative stress markers compared to a control population [14-20]. The damage effects of increased oxidative stress on all tissue were extensively studied [21,22]. However, impact of increased oxidative stress on trace-elements have few been reported. In the body, many trace-elements (such as iron) exist in different valence. When these elements participate in live activities as coenzyme or prosthetic
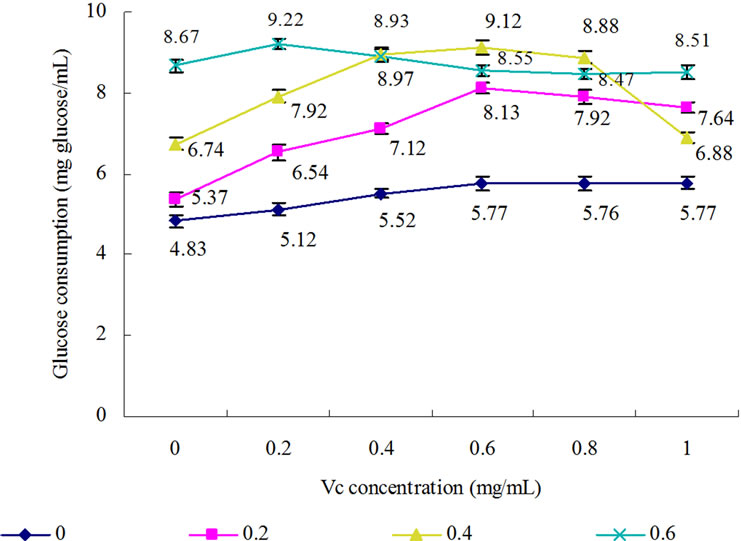
Figure 3. Synergistic effect of combinatorial supplementation of FeSO4 and Vc on glucose consumption in liver of diabetic mice. : 0 mg/ mL FeSO4;
 : 2 mg/mL FeSO4;
 : 4 mg/mL FeSO4;
 : 6 mg/mL FeSO4.
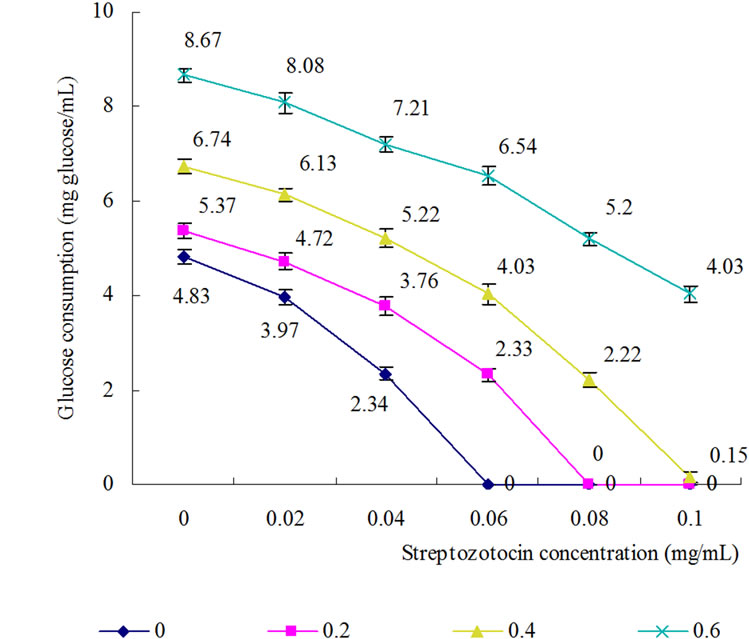
Figure 4. Antagonistic effect of combinatorial supplementation of FeSO4 and STZ on glucose consumption in liver of diabetic mice. : 0 mg/mL FeSO4;
 : 2 mg/mL FeSO4;
 : 4 mg/mL FeSO4;
 : 6 mg/mL FeSO4.
group, different valences of these elements common transformed each other and form a micro-cycle. Iron is a most typical example.
Iron presences in the human body as a prosthetic group of those enzymes related with glucose metabolism, such as cytochrome oxidase, catalase, aldehyde oxidase, xanthine oxidase, succinate dehydrogenase, α-glycerol phosphate oxidase, lipid peroxidase, proline hydroxylase and lysine hydroxylase. Tricarboxylic acid cycle (TCA) is the aerobic oxidation of glucose in vivo, an important pathway to supply energy. More than half of the enzymes or cofactors of TCA cycle and electronic transmission chain contain iron or play a physiological function only in the present of iron. Thus, its deficiency and excess will impact on glucose metabolism and electron transmission of the body. Iron exists as Fe2+ and Fe3+. When iron plays their physiological role, two different valence of iron continuously transforms each other and form iron cycle Increased oxidative stress has been reported in diabetes mellitus, elder and other chronic state. Previous studies showed this hyper-oxidation can damage tissue [23-25,18]. However, the studies on that the hyperoxidation interdicts reduction of Fe3+ and blocks the glucose metabolism in body have few reported. GC is degraded in unit time can directly reflect the relative strength of glucose metabolism. In our test, the GC of normal and diabetic rate’s liver was first compared. It was found that the GC of diabetic rat’s liver was significantly lower than of normal rat’s liver (Figure 1) and elevated by added Fe2+ instead of Fe3+ (Figure 2). If some reducer (such as Vc) and Fe2+ simultaneously were added, GC could be elevated further (Figure 3) and if some oxidant (such as STZ) and Fe2+ simultaneous were added, GC markedly decreased (Figure 4). Under higher oxidant stress state, supplying Fe3+ could not facilitate glucose metabolism. Therefore, to control appropriate oxidative stress redounded to glucose metabolism.
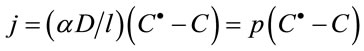
The only different in glucose metabolism between in vivo and in vitro is each cell is surrounded by cell membrane which separates it from the outside world in vivo, interior of cell is separated into many special circumscriptions by membrane and glucose metabolism is fulfilled in these special circumscriptions, such as Embden-Meyerhof-Parnas (EMP) takes place in cytoplasm, the tri-carboxylic acid cycle (TCA) pathways and the electron transfer do within mitochondrion and in membrane of mitochondrion, respectively. Biological membranes separates cell from the outside circumstance and also becomes physical barriers which limit glucose to enter into cell. The pathways that glucose enters into cellular primarily includes two type: Na+-glucose transporter (active transporter) and facilitate diffusion. Facilitate diffusion was the dominating factor [26]. The flux for glucose to enter into cell may be described with following formula:
 (2)
(2)
where j are the flux for glucose to enter into cell, C● the extracellular glucose concentration (bulk concentration); C the intracellular glucose concentration, D is the (constant) diffusion coefficient, α is the glucose distribution coefficient between the extraand intra-cellular phase, and l the membrane thickness. p is called permeability [27].
It is clear that the impetus to increase diffusion flux of glucose depends on permeability and the glucose levels’ difference of both sides of the membrane. Insulin heightens the flux of glucose to enter into cell mostly by increasing the affinity of glucose for carrier protein. The high glucose level of intracellular under hyper-oxidation lessens the glucose level’ difference of extraand intracellular, the flux for glucose to enter into cell and elevates the blood glucose level. Therefore, reducing oxidation stress in vivo helps to elevate GC of body, accelerate glucose metabolism, facilitate glucose in blood entering into cellular and finally decrease blood glucose levels.
To prove the hypothesis, the alloxan induced diabetic mice were treated with FeSO4, FeCl3, Vc and FeSO4 + Vc, respectively. Alloxan is a kind of strange oxidant and not only damages islet cell, induce diabeties and but also elevated oxidant stress of test animal in vivo. Therefore, many papers have reported that higher oxidant stress than normal test animals exists in alloxan induced diabetic animals. Hyperoxidation in diabetic mice blocked Fe3+ reduced to Fe2+ and contributed to serum iron deficiency of diabetic mice (Figure 1). After oral administration of FeSO4, Vc and FeSO4 + Vc, serum glucose, fructosamine and lipid levels would decrease (Table 4) and serum total iron and Fe2+ content and GC of liver would be significantly increase. Specially, the effect of FeSO4 + Vc was more significant. These results demonstrated that supplied Fe2+ coupled with controlling oxidative stress helps to enhance glucose metabolism and decrease the blood glucose levels of diabetes.
5. Conclusion
The study showed that supplying Fe2+ coupled with Vc can elevate the GC of diabetic mice’s liver in vitro. The same result was also obtained in vivo. Supplementation of Fe2+ and Vc to alloxan induced diabetic mice could renew the iron cycle, improve oxygen transportation and oxygen utilization efficiency and decrease serum glucose and lipid levels in the alloxan-induced diabetes mice or even in the diabetes mellitus patients. If Vc and Fe2+ supplement at the same time, these activity of Fe2+ in diabetes would be better. In all, it is helpful to monitor Fe2+ content instead of total iron content and control sufferer oxidant stress to maintain Fe2+ at a special content in vivo for prevention and treatment of diabetes.
6. Acknowledgements
This work was supported by a grant from the Ministry of Science and Technology of China (Grant No. 2006CB403200), Chinese Postdoctoral Science Fund (Grant No. 20080440810), Nantong social development fund (S2008004)
REFERENCES
- V. B. Junqueira, S. B. Barros, S. S. Chan, L. Rodrigues, L. Giavarotti, R. L. Abud and G. P. Deucher, “Aging and Oxidative Stress,” Molecular Aspects of Medicine, Vol. 25, No. 1-2, 2004, pp. 5-16. doi:10.1016/j.mam.2004.02.003
- J. Karolkiewicz, E. Michalak, B. Pospieszna, E. DeskurSmielecka, A. Nowak and L. Pilaczyńska-Szcześniak, “Response of Oxidative Stress Markers and Antioxidant Parameters to an 8-Week Aerobic Physical Activity Program in Healthy, Postmenopausal Women,” Archives of Gerontology and Geriatrics, Vol. 49, No. 1, 2009, pp. e67-e71. doi:10.1016/j.archger.2008.09.001
- P. Moller, H. Wallin and L. E. Knudsen, “Oxidative Stress Associated with Exercise, Psychological Stress and Life-Style Factors,” Chemico-Biology Interactions, Vol. 102, No. 1, 1996, pp. 17-36. doi:10.1016/0009-2797(96)03729-5
- C. Nasuti, R. Gabbianelli, M. L. Falcioni, A. Di Stefano, P. Sozio and F. Cantalamessa, “Dopaminergic System Modulation, Behavioral Changes, and Oxidative Stress after Neonatal Administration of Pyrethroids,” Toxicology, Vol. 229, No. 3, 2007, pp. 194-205. doi:10.1016/j.tox.2006.10.015
- A. Peter, “Bioenergentics and the Metabolism of Carbohydrates and Lipids,” In: K. Robert, K. Daryl and W. Victor, Eds., Harper’s Biochemistry, 25th Edition, Sicence Press, 2000, pp. 182-208.
- S. Filiz, Ö. Gülyüz, E. Deniz and H. Alev, “Antioxidant Effect of Vitamin E in the Treatment of Nutritional Iron Deficiency Anemia,” Turkish Journal of Hematology, Vol. 23, No. 1, 2006, pp. 15-24.
- B. J. Clodfelder, B. M. Gullick, H. C. Lukaski, Y. Neggers and J. B. Vincent, “Oral Administration of the Biomimetic [Cr3O(O2CCH2CH3)6(H2O)3]+ Increases Insulin Sensitivity and Improves Blood Plasma Variables in Healthy and Type 2 Diabetic Rats,” Journal of Biological Inorganic Chemistry, Vol. 10, No. 2, 2005, pp. 119-130. doi:10.1007/s00775-004-0618-0
- Y. Sun, K. Mallya, J. Ramirez and J. B. Vincent, “The Biomimetic [Cr3O(O2CCH2CH3)6(H2O)3]+ Decreases Plasma Cholesterol and Triglycerides in rats: Towards Chromium-Containing Therapeutics,” Journal of Biological Inorganic Chemistry, Vol. 4, No. 6, 1999, pp. 838-845. doi:10.1007/s007750050357
- Z. C. Zhang, B. Lian and F. J. Cui, “Effect of FeSO4 Treatment on Glucose Metabolism in Diabetic Rats,” Biometals, Vol. 21, No. 6, 2008, pp. 685-691. doi:10.1007/s10534-008-9153-8
- N. Aksoya, H. Vural, T. Sabuncub, O. Arslan and S. Aksoy, “Beneficial Effects of Vitamins C and E against Oxidative Stress in Diabetic Rats,” Nutrition Research, Vol. 25, No. 6, 2005, pp. 625-630. doi:10.1016/j.nutres.2005.05.005
- Z. C. Zhang, X. Li, M. X. Chen and W. L. Shen, “Assay of the Glucose Consumption Rate in Liver with a Novel Colorimetric Method,” Current Pharmaceutical Analysis, Vol. 7, No. 3, 2011, pp. 195-201. doi:10.2174/157341211796353336
- J. Lin and S. H. Ji, “The Determination of Dietary Fe (II) and (III),” Guangdong Microelement Science, Vol. 3, No. 8, 1996, pp. 148-152.
- D. Duncan, “Multiple Range Tests for Correlated and Heteroscedastic Means,” Biometrics, Vol. 13, No. 2, 1957, pp. 164-176. doi:10.2307/2527799
- M. Brownlee, “Biochemistry and Molecular Cell Biology of Diabetic Complications,” Nature, Vol. 414, No. 6865, 2001, pp. 813-820. doi:10.1038/414813a
- M. Brownlee, “The Pathobiology of Diabetic Complications: A Unifying Mechanism,” Diabetes, Vol. 54, No. 6, 2005, pp.1615-1625. doi:10.2337/diabetes.54.6.1615
- J. L. Evans, I. D. Goldfine, B. A. Maddux and G. M. Grodsky, “Oxidative Stress and Stress-Activated Signaling Pathways: A Unifying Hypothesis of Type 2 Diabetes,” Endocrine Reviews, Vol. 23, No. 5, 2002, pp. 599- 622. doi:10.1210/er.2001-0039
- D. Jay, H. Hitomi and K. K. Griendling, “Oxidative Stress and Diabetic Cardiovascular Complications,” Free Radical Biology & Medicine, Vol. 40, No .2, 2006, pp. 183-192. doi:10.1016/j.freeradbiomed.2005.06.018
- P. Rosen, P. P. Nawroth, G. King, W. Möller, H. J. Tritschler and L. Packer, “The Role of Oxidative Stress in the Onset and Progression of Diabetes and Its Complications: A Summary of a Congress Series Sponsored by UNESCO-MCBN, the American Diabetes Association and the German Diabetes Society,” Diabetes/Metabolism Research and Reviews, Vol. 17, No. 3, 2001, pp. 189-212. doi:10.1002/dmrr.196
- J. A. Scott and G. L. King, “Oxidative Stress and Antioxidant Treatment in Diabetes,” Annal of the New York Academy Science, Vol. 1031, No. 12, 2004. pp. 204-213. doi:10.1196/annals.1331.020
- I. C. West, “Radicals and Oxidative Stress in Diabetes,” Diabetic Medicine, Vol. 17, No. 3, 2000, pp. 171-180. doi:10.1046/j.1464-5491.2000.00259.x
- P. Anabela and M. P. Carlos, “Diabetes and Mitochondrial Function: Role of Hyperglycemia and Oxidative Stress,” Toxicology and Applied Pharmacology, Vol. 212, No. 2, 2006, pp. 167-178. doi:10.1016/j.taap.2006.01.003
- A. C. Maritim, R. A. Sanders and J. B. Watkins, “Diabetes, Oxidative Stress, and Antioxidants: A Review,” Journal of Biochemical and Molecular Toxicology, Vol. 17, No. 1, 2003, pp. 24-38. doi:10.1002/jbt.10058
- Z. C. Feng, T. J. Sick, M. Rosenthal, “Oxygen Sensitivity of Mitochondrial Redox Status and Evoked Potential Recovery Early during Reperfusion in Post-Ischemic Rat Brain,” Resuscitation, Vol. 37, No. 1, 1998, pp. 33-41. doi:10.1016/S0300-9572(98)00031-8
- M. A. Perez-Pinzon, P. L. Mumford, M. Rosenthal and T. J. Sick, “Antioxidants, Mitochondrial Hyperoxidation and Electrical Recovery after Anoxia in Hippocampal Slices,” Brain Research, Vol. 754, No. 1-2, 1997, pp. 163-170. doi:10.1016/S0006-8993(97)00066-8
- M. Rosenthal, Z. C. Feng, C. N. Raffin, M. Harrison and T. J. Sick, “Mitochondrial Hyperoxidation Signals Residual Intracellular Dysfunction after Global Ischemi a in Rat Neocortex,” Journal of Cerebral Blood Flow & Metabolism, Vol. 15, No. 4, 1995, pp. 655-665. doi:10.1038/jcbfm.1995.81
- T. Shen and J. Wang, “Biochemistry,” Higher Education Publisher, Beijing, 2000.
- W. Ebel, “Carrier Facilitated Diffusion,” Journal of Mathematical Biology, Vol. 21, No. 3, 1985, pp. 243-271. doi:10.1007/BF00276225
NOTES
*Corresponding author.