Food and Nutrition Sciences
Vol. 2 No. 2 (2011) , Article ID: 4561 , 4 pages DOI:10.4236/fns.2011.22023
Glutamate and Caffeine Intake of Some Snacks and Drinks in Saudi Arabia
![]()
1Department of Food Science and Technology, Cairo University, Cairo, Egypt; 2Department of Food and Nutrition Science, King Faisal University, Al-Hassa, Kingdom of Saudi Arabia.
Email: d.magda_moy@hotmail.com
Received February 15th, 2011; revised March 10th, 2011; accepted March 25th, 2011.
Keywords: Glutamate, Caffeine, Snacks, Eating Habits Drinks, KSA, HPLC
ABSTRACT
The aim of this study was to estimate the intake level of glutamate and caffeine from some snacks and drinks. The survey was carried out during 2008 to 2009 in 3 selected governorates (Al-Hassa, AlKatif and AD-Dammam) localized in the eastern area of Saudi Arabia. The age of study participants (298) was ranged between less than 4—over 30 years. The snacks and drinks consumption data were gathered and calculated using the frequency methods. Forty nine samples of snacks and beverages were analyzed by High Performance Liquid Chromatography (HPLC) for glutamate and caffeine contents. The results indicated that total intake of snacks, chocolates and drinks were significantly correlated (spearman r = 0.856, 0.591, 0.943, p = 0.0) with total intake of glutamate and caffeine. The mean of caffeine intake was 40.4 ± 44.5 mg, while the mean of glutamate intake was 0.134 ± 0.146 mg. The highest concentration of glutamate was in Pringles with Ketchup (0.420), Bugles Smoking BBQ (0.660) and Indomie with Vegetables (0.860). The high caffeine concentrations of Kit Kat, Ulker and Galaxy samples were 166, 165.5, and 134.5 mg/kg respectively, while the beverages, the high caffeine concentrations were presented in energy drinks like Red bull (345.5), Power Horse (339.0) and Bugzy (333.0) mg/L. The children aged between 4 and 8 were the most consumers of snacks which containing glutamate, while the adolescents consumed more chocolates and beverages which containing caffeine. These finding suggests that consumption of salty snacks, and sugar-sweetened beverages is mounting between important categories in the community, so interventions focusing on increasing physical activity and fruit and vegetable consumption will have an impact on obesity control and promoting health.
1. Introduction
It is commonly stated that “snack” foods provide “empty calories” and, played an important role in increasing energy Consumption [1] and [2] Not only energy but also contained additives such as Monosodium glutamate (MSG) and Caffeine L-Glutamate is reported to be a potent neuroexcitatory amino acid involved in several behavior patterns [3]. It has widespread use as a flavour enhancing food additive, being linked to Chinese Restaurant Syndrome (CRS) [4] Food and Drug Administration (FDA) interpreted the findings of the Federation of American Societies for Experimental Biology (FASEB) report to be generally consistent with the safety assessments of other authoritative organizations (presumably including the Joint FAO/WHO Expert Committee on Food Additives and EU Scientific Committee on Food (JECFA and SCF) that have affirmed the safety of MSG at levels normally consumed by the general population, and concurred with the conclusion that there is no evidence linking current MSG food use to any serious, long-term medical problems in the general population [5]. Also, Caffeine is the most widely used stimulant in the world [6]. Caffeine has classified on Generally Recognized As Safe (GRAS list ([7] and [6] but in other studies like [8] remembered that the adverse effects of caffeine in hypertension, abortion and impaired fetal growth. Most of the evidence supporting caffeine safety comes from studies conducted in adults. Given that children ages 12 to 17 are among the fastest-growing segment of the population for caffeine use, it is imperative that more empirical data be collected in children and adolescents to understand how acute and chronic caffeine use affect the physiology and behavior of this population [6]. This means that there are two different views, so we designed the study to assess the amount of glutamate and caffeine in the snacks and drinks/ day and understanding of some factors affecting the intake of glutamate and caffeine. Also, extract estimate the content of both glutamate and caffeine in some snacks and drinks by HPLC.
2. Materials and Methods
2.1. Source of Samples
The snacks (27 potatoes chips ,corn products and noodles), chocolates and beverages samples( 9 samples chocolates,13 beverages (soft drinks, energy drinks and other)) were purchased from local supermarkets (Al-Reda Market, Al-Yahya Market and small shop in Al-Hassa, Saudi Arabia) by us, then were sent to Edak Lab-Al Ridah.
2.2. Participants
The participants were 298 individuals, 150 males and 148 females, at the age ranged less than 4 to over 30 years old, living in Al-Hassa, Al-Katif and AD-Dammam districts in the eastern province, Saudi Arabia.
Additionally they were asked about consumption, and other relevant data using questionnaire covering demographic characteristics, the questionnaire includes questions on the frequency and amount eaten for the snacks and beverages.
2.3. Determination of Caffeine Contents
Sample preparation and analyze determination; 2.00 g of samples were weighed in triplicate and put into 250 ml beakers. 100 ml of boiling distilled water was added and let to stand for five minutes with stirring, the solution was cooled and filtered into conical flasks. 5 ml of the filtrate were pipette into clean 50 ml volumetric flasks and made to the mark with the mobile phase. The standards and the samples were run in the HPLC system. The following were the HPLC conditions: Column, Reverse 355 phase—ODS, 250 × 4.6 mm, flow rate, 1 ml/min, detector, photodiode array set at 278 nm, pressure, 150 khf/cm2, mobile phase, water, acetic acid, methanol (79.9, 0.1 and 20) and sample volume, 10 μl. A calibration curve of peak areas versus concentration of the standards was plotted. The caffeine level of the various samples was calculated using the regression equation of the best line of fit [9].
2.4. Determination of Glutamate Contents
The HPLC system used was of LC-10 AT VP Shimadzu pump, SPD-10AV VP with Shimadzu UV visible detector, au Bondapak 125 A C18 10 μm column (particle size 10 μm) was used for separation. The chromatographic and integrated data were recorded using a CBM-102 communication Bus Module Shimadzu on a Pentium-IV PC. The mobile phase was acetonitrile-water (1:1), the pH of this mobile phase was adjusted to 2.9 with phosphoric acid (85%). Before delivering into the system it was filtered through 0.45 μm filter and degassed using a vacuum. The analysis was carried out under isocratic conditions using a flow rate 1.7 ml/min at room temperature. Chromatograms were recorded at 205 nm using a detector SPD-10AV VP Shimadzu UV visible. Injector with a 10 μ liter [10].
2.5. Statistical Analysis
All analyses were performed using the Statistical Package for the Social Sciences for WINDOWS (version 13.0; SPSS Inc, Chicago). Conventional statistical methods were used to calculate means and standard deviations. The potential differences (P < 0.05) between subjects were analyzed using a one-way analysis of variance (ANOVA), with gender, governorate, age, number of snacks and caffeine & glutamate concentrations.
3. Results and Discussion
3.1. Demographic Characteristics
The distribution of some socio-demographic characteristics of the participants of the cohort study, according to sex, is presented in Table 1. Among participants the
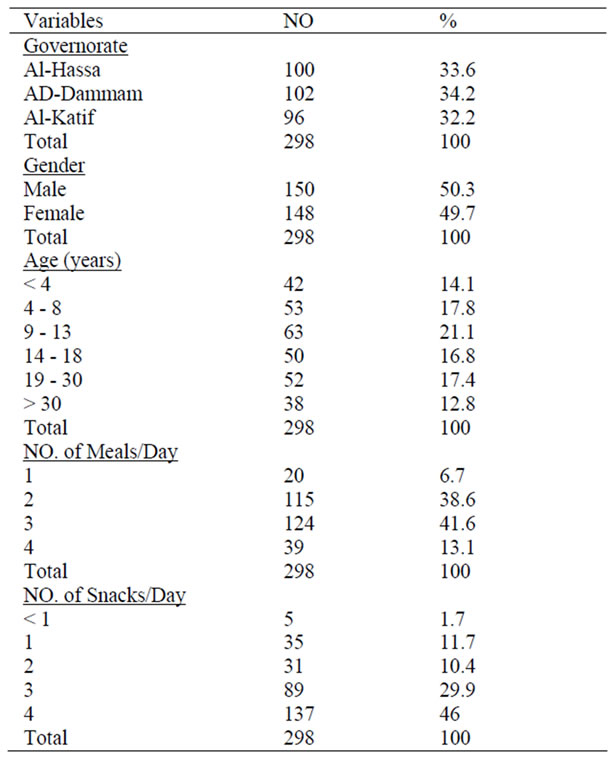
Table 1. Descriptive Statistics for Demographic Factors & Some Eating Habits.
following characteristics predominated: males (50.3%), people 18 years or less (69.8%), people living in ADDammam and Al-Hassa (67.8%).
3.2. Eating Habits (Meals or Snacks per Day)
About one-eighth of the participants consumed four meals in a day. While the majority (45.3%) consumed only one or two basic meals/day. Among the 298 who stated they ate snacks, almost 87% consumed snacks two or more each day. However, almost one-eighth of the sample reported that they had one or less snack at each day. The results of this study provide descriptive and analytical information regarding snack patterns of people in Saudi Arabia. Our results showed that the number of snacks eating occurrences per day varies roughly between 1 and 4. However, a majority of the subjects (69.8%) were children and adolescences and high percent (44.3%) consumed only one or two main meals. This implies that a trend of an increasing number of snacks between most important categories of any community. As found by Shrivastav and Thomas [11] Children and adolescents have reported frequent snacking that can be a significant contributor to the energy content of their diets. This affects the consumption of normal nutritious diet. In addition breakfast or lunch skippers who ate more than two snacks had higher intakes of energy on average than those who ate three meals, suggesting that eating snacks contributes to higher consumption of energy and lower quality diets [12]. Salty snacks and candy, deserts and sweetened beverages remain the major sources of calories from snacks [13].
3.3. Glutamate Content
Table 2 shows glutamate concentration in some snacks and control sample. We found that a sharp increase in glutamate concentration in the majority of snacks versus control chips (without any additives). The highest increase of glutamate concentration was in Pringles with Ketchup (0.420), Bugles Smoking BBQ (0.660) and Indomie with Vegetables (0.860).There was no significant relationship between glutamate concentration and kind of snack flavor.
From Table 2, it could be seen that glutamate concentration was highly significantly (t = 6.054, p < 0.001) increased in the sample (0.352) for the control (0.075), and this proves that samples of snacks containing more glutamate than control.
3.4. Caffeine Content
About the caffeine content (Table 3) of chocolates and beverages sampled in this investigation, the high caffeine concentrations of Kit Kat, Ulker and Galaxy samples were 166, 165.5, and 134.5 mg/kg respectively. While the beverages, the high caffeine concentrations were presented in Red bull (345.5), Power Horse (339.0) and Bugzy (333.0) mg/L. There was no significant relationship between caffeine concentration and kind of chocolate (only chocolate or chocolate with nuts, coconut, and caramel). The differences between glutamate and caffeine concentration means were not significant according to living city, and presented similar variance according to F test (Table 4).
The results furthermore showed highly significant variance between males and females in glutamate & cafeine concentrations (mean = 0.15 for males, mean = 0.12 for females F = 9.345, p at 0.01, mean = 45.2 for
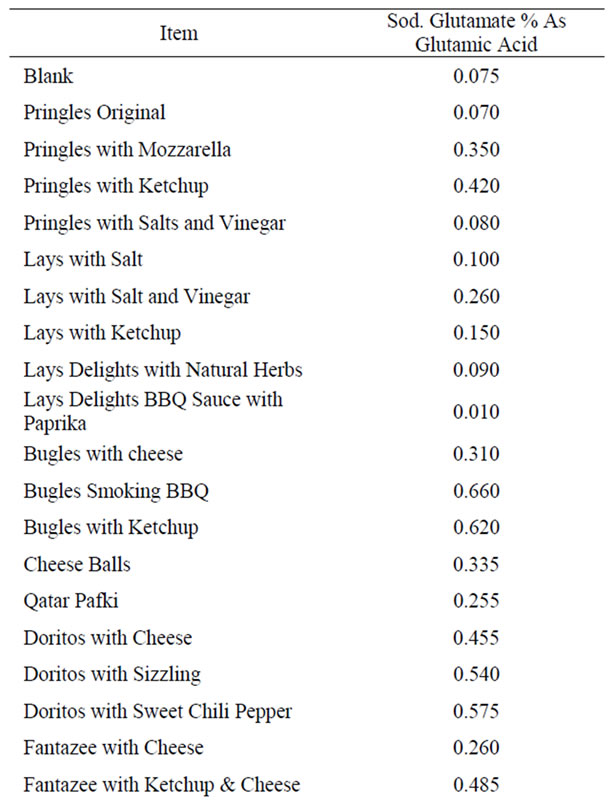
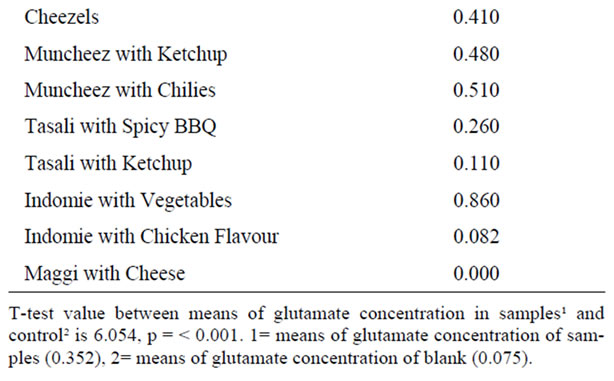
Table 2. Glutamate concentrations in some snacks are marketed in Saudi Arabia.
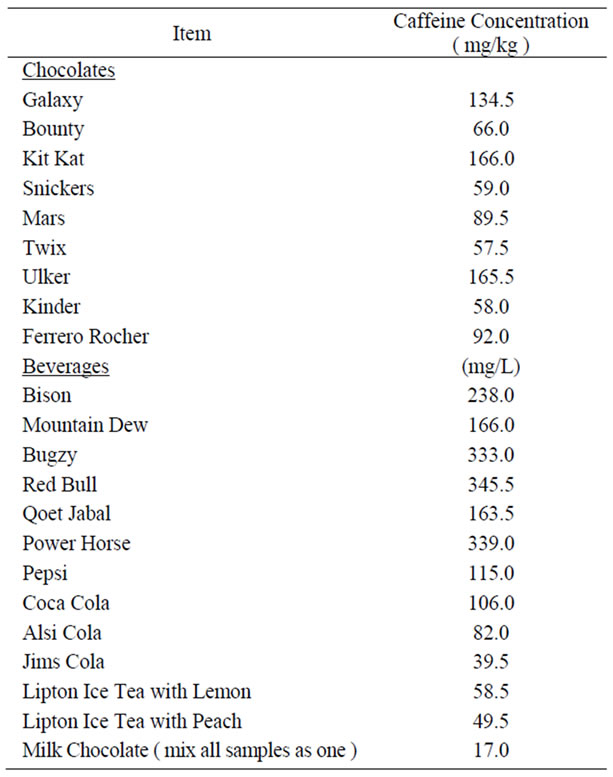
Table 3. Caffeine concentration in some chocolates and beverages are marketed in Saudi Arabia.
males, mean = 35.5 for females F = 6.468, p at 0.01 respectively) that’s mean males were consuming more snacks, chocolates and caffeinated beverages than females. Analysis of variance (Table 4) showed statistical significance at 0.1% of probability between age groups in Quantity glutamate and caffeine consumption children aged between 4 - 8 years who the most consumption for snacks containing glutamate, while adolescents consumed more snacks and beverages containing caffeine. In our study men were consuming more snacks and drinks that contain glutamate and caffeine; this is not supported with [14], women were more frequent snackers than men. We think that men consuming more snacks to their more need for energy, but to caffeine they may be thought that beverages containing caffeine give them power, activity and attention. Although both the men and women saw an improvement in their activity levels with the coffee, [15] observed a greater impact among the males. Our results were in harmony with [6] Boys reported consuming more energy drinks and girls reported consuming more tea. Energy drinks have significantly more caffeine than tea. Perhaps boys enjoy or require larger doses of caffeine than girls. Alternatively, energy drink consumption may be elevated in boys because of energy drink marketing directly to adolescent and young adult males. Boys were also more likely than girls to re-
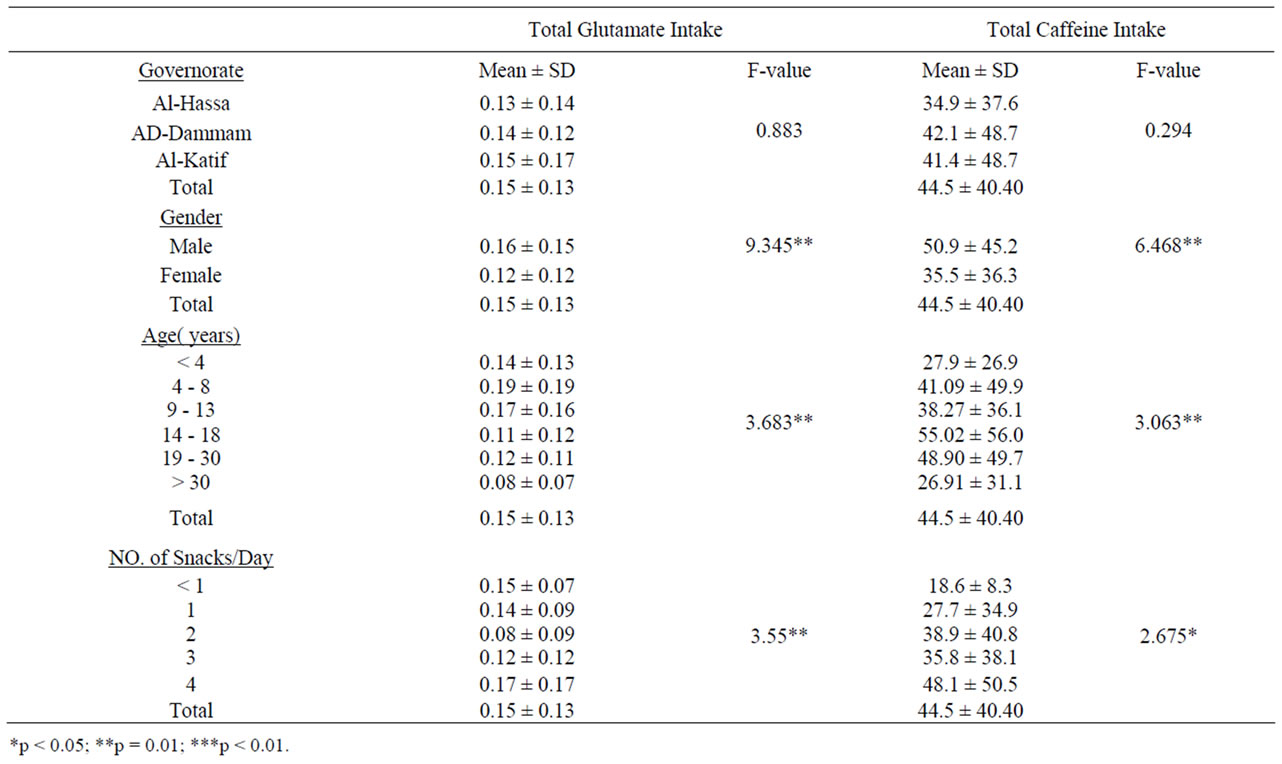
Table 4. F-test comparisons of mean glutamate & caffeine for governor-ate, gender, age and no. of snacks/day.
port using caffeine for energy, to get a rush, or to enhance performance. Previous studies have report and association between caffeine consumption and intake of other types of foods. They reported that soda consumption is inversely correlated with fruit, vegetable, milk intake and positively correlated with intake of “junk food”. In addition, children who consume soda on a regular basis are at higher risk for obesity and for every additional serving of sugar-sweetened beverages consumed daily, and boys have greater energy needs compared with girl. Also the prevalence of obesity and overweight is increasing globally. Frequently coexisting with undernutrition in developing countries, obesity is a major contributor to chronic disease, and will become a serious healthcare burden especially in countries with a larger percentage of youthful population. 35% of the populations of Saudi Arabia are under the age of 16, and adult dietary preferences are often established during early childhood years. A higher intake of Sugar-sweetened carbonated beverage (SSCB) is associated with poor dietary choices. Male SSCB intake correlates with a higher W_C and BMI. Limiting exposure to SSCB could therefore have a large public health impact [16].
Our results in the same table showed that there was significant variation in the glutamate and caffeine concentrations relation to snack intake. As increase the number of snacks consumed increases the intake of glutamate and caffeine.
4. Conclusion
Children and adolescences were more frequent snackers than adults and men were more frequent snackers than girls. Glutamate and caffeine intakes were positively related to snacking, age and gender, therefore, recommended not consuming these snacks and energy drinks heavily for their adverse effects on health especially children and adolescences.
5. Acknowledgements
The authors would like to thank Dr. Amany Basuny for valuable comments.
REFERENCES
- S. J. Gatenby, “Eating Frequency: Methodological and Dietary Aspects,” British Journal of Nutrition, Vol. 77, No. S1, 1997, pp. S7-S20. doi:10.1079/BJN19970100
- C. L. Lawton, H. J. Delargy, F. C. Smith, V. Hamilton and J. E. Blundell, “A Medium-Term Intervention Study on the Impact of Highand Low-Fat Snacks Varying in Sweetness and Fat Content: Large Shifts in Daily Fat Intake but Good Compensation for Daily Energy Intake,” British Journal of Nutrition, Vol. 80, 1998, pp. 149-161.
- R. L. Villarta, D. D. Cunningham and G. G., Guilbauil, “Amperomatric Enzyme Electrode for the Determination of L-Glutamater,” Talanta, Vol. 38, 1991, pp. 49-55. doi:10.1016/0039-9140(91)80008-N
- H. H. Schaumburg, R. Byck, R. Gerstl and J. H. Mashman, “Monosodium Glutamate: Its Pharmacology and Role in the Chinese Restaurant Syndrome,” Science, Vol. 163, 1969, pp. 826-828. doi:10.1126/science.163.3869.826
- R. Walker and J. R. Lupien, “The Safety Evaluation of Monosodium Glutamate,” Journal of Nutrition, Vol. 130, No. 4, 2000, pp. S1049-S105.
- J. L. Temple, A. M. Dewey and L. N. Briatico, “Effects of Acute Caffeine Administration on Adolescents,” Experimental and Clinical Psychopharmacology, Vol. 18, No. 6, 2010, pp. 510-520. doi:10.1037/a0021651
- E. N. Whitney and S. R. Rolfes, “Understanding Nutrition,” 6th Edition, West Publishing Company, USA. 1993.
- J. V. Higdon and B. Feri, “Coffee and Health: A Review of Recent Human Research,” Critical Reviews in Food Science and Nutrition, Vol. 46, No. 2, 2006, pp. 101-123. doi:10.1080/10408390500400009
- H. N. Wanyika, E. G. Gatebe, L. M. Gitu, E. K. Ngumba and C. W. Maritim, “Determination of Caffeine Content of Tea and Instant Coffee Brands Found in the Kenya Market,” African Journal of Food Science, Vol. 4, No. 6, 2010, pp. 353-358. http://www.academicjournals.org/ajfs/abstracts/abstracts/abstract2010/Jun/Wanyika%20et%20al.htm.
- M. S. Arayne, N. Sultana and F. A. Siddiqui, “Determination and Quantification of Glutamate,” Pakistan Journal of Pharmaceutical Science, Vol. 18, No. 3, 2005, pp. 7- 11.
- M. Shrivastav and S. Thomas, “Snack Consumption among Underprivileged Adolescent Girls,” Indian Pediatrics, Vol. 47, No.17, 2010, pp. 888-890.
- M. Shimizu, C. R. Payne and B. Wansink, “When Snacks Become Meals: How Hunger and Environmental Cues Bias Food Intake,” International Journal of Behavioral Nutrition, Vol. 7, 2010, p. 63. doi:10.1186/1479-5868-7-63
- C. Piernas and B. M. Popkin, “Trends in Snacking Among U.S. Children,” Health Affairs (Millwood), Vol. 29, No. 3, 2010, pp. 398-404. doi:10.1377/hlthaff.2009.0666
- F. H. Bertéus, J. S. Torgerson, L. Sjöström and A. K. Lindroos “Snacking Frequency in Relation to Energy Intake and Food Choices in Obese Men and Women Compared to a Reference Population,” International Journal of Obesity, Vol. 29, No. 6, 2005, pp. 711-719. Swedenhttp://www.ncbi.nlm.nih.gov/pubmed/15809664.
- A. Adan, G. Prat, M. Fabbri, and M. Sànchez-Turet, “Early Effects of Caffeinated and Decaffeinated Coffee on Subjective State and Gender Differences,” Progress in Neuro-Psychopharmacology and Biological Psychiatry, Vol. 32, No. 7, 2008, pp. 1698-1703. doi:10.1016/j.pnpbp.2008.07.005
- K. S. Collison, M. Z. Zaidi, S. N. Subhani, K. AlRubeaan, M. Shoukri and F. A. Al-Mohanna, “Sugar-Sweetened Carbonated Beverage Consumption Correlates with BMI, Waist Circumference, and Poor Dietary Choices in School Children,” BMC Public Health, Vol. 10, No. 1, 2010, p. 234. doi:10.1186/1471-2458-10-234