Open Journal of Pediatrics
Vol. 3 No. 2 (2013) , Article ID: 33212 , 8 pages DOI:10.4236/ojped.2013.32025
Applying the WHO instead of CDC growth charts may double obesity rates*
![]()
1Department of Paediatrics, Division of Paediatric Nephrology, Children’s Hospital, London Health Sciences Centre, London, Canada
2Schulich School of Medicine and Dentistry, University of Western Ontario, London, Canada
Email: #guido.filler@lhsc.on.ca
Copyright © 2013 Abeer Yasin, Guido Filler. This is an open access article distributed under the Creative Commons Attribution License, which permits unrestricted use, distribution, and reproduction in any medium, provided the original work is properly cited.
Received 22 February 2013; revised 23 March 2013; accepted 30 March 2013
Keywords: WHO; NHANES; Height z-Score; Weight z-Score; BMI z-Score; Bland & Altman Agreement; Obesity Rates
ABSTRACT
Aims: This study compares the WHO (2007) and the National Health Examination Survey (NHANES III) reference intervals and investigates the differences when applied on a Canadian cohort of older children and adolescents. Methods: We calculated height, weight and BMI z-scores of 4375 consecutive patients (1993 female, 45.6%) aged 5 - 20 years attending outpatient clinics at a single tertiary care centre using reference data of the latest NHANES (III) survey and the WHO (2007) growth charts. To address age dependency, data was stratified into age groups. Results: Using the NHANES III reference intervals, medians of weight (+0.46), height (+0.29) and BMI z-scores (+0.46) were significantly non-zero. The WHO (2007) growth charts yielded medians of +2.05, +0.32, +0.53 for weight, height and BMI z-scores respectively, all significantly non-zero. When comparing both growth charts, Canadian children had significantly different weight and BMI z-scores (p < 0.0001) with WHO growth charts whereas height z-score did not differ. Obesity rates (BMI z-score > 95th percentile) doubled from 8.6% to 16.0%. A significant age dependency was observed with higher WHO (2007) weight z-scores (>7 years) and higher BMI z-scores (7 to 13 years) and no significant difference was observed for height z-scores across all age groups. Gender differences were observed for weight z-scores (>9 years) and BMI (males: 9 - 11 years, p = 0.0118; 11 - 13 years, p = 0.0069) whereas no significant difference was found in height z-scores across all age groups. Conclusion: Our results reveal substantial differences between both reference populations and thus interpretation needs be done with caution, especially when labelling results as abnormal.
1. INTRODUCTION
Growth charts are essential to assess for failure to thrive, short stature or obesity. Over the years a number of growth charts have been developed to assess and monitor the general health and growth of children and adolescents. Until the arrival of the new WHO growth charts, the National Centre for Health Statistics (NCHS) growth charts based on the latest Health and Nutrition Examination Survey (NHANES III) database have been used in Canada. The NHANES III include age-corresponding body mass index (BMI) smoothed z-scores, which are used for assessing obesity rates [1]. These charts were adopted by most countries in the world [2,3].
The NHANES III reference database has been criticized for being sampled from the American population and its small number of breast-fed infants in its cohort [4]. To address these concerns, the WHO released new international growth charts for 8440 children aged birth to 59 months in April of 2006 using an international population sampled from Brazil, Ghana, India, Norway, Oman and the USA [5]. Data were based on breast-fed population raised according to the recommended nutritional and health practices, taken to be the gold standard for children’s growth. These WHO growth charts have subsequently been adopted for use worldwide for child growth assessment of children less than 60 months [3]. In 2007, the WHO released a new set of charts for monitoring the growth of older children and adolescents that had been updated and improved to address the growing epidemic of childhood obesity [6]. The WHO (2007) charts have been adopted by Canadian dieticians in Canada in place of the NHANES III for assessment of children aged 5 to 20 years [7].
We wished to study whether the obesity rates of children and adolescents would vary when comparing both growth charts. A direct comparison of the two growth charts for Canadian children aged 5 - 20 years remains elusive. Therefore, we compared height, weight and BMI z-scores for children aged 5 - 20 years obtained by using both the NHANES III and the WHO (2007) reference intervals in a convenient sample of a large Canadian patient cohort.
2. PATIENTS AND METHODS
We performed a post-hoc analysis on a convenient sample of 4375 patients (1993 females, 45.6%) aged 5 - 20 years with a complete data set from a previous study on healthy weights of children attending Children’s Hospital, London Health Sciences Centre. Only patients with a complete dataset were included. The study was approved by the institutional ethics review board (Health Science REB #13746E). Patients were recruited consecutively between April 2007 to July 2009 in the Paediatric Emergency department in a number of ambulatory clinics (cardiology, endocrinology, gastroenterology, nephrology, neurology, orthopaedic surgery).
After obtaining a written informed consent, anthropometric measurements (height, measured by stadiometer) and chronological age (calculated from the difference between the date of the appointment and the date of birth) were obtained as a clinical routine for patients attending the various clinics. Body mass Index (BMI) was calculated as the ratio of weight [kg] and the square of height [m]. BMI is age and gender dependent, therefore, age independent BMI z-scores were calculated using the methodology provided by the Centre of Disease Control (CDC) website with age and gender matched controls taken from the National Centre for Health Statistics (NCHS), United States. The most recent NHANES III database (1999-2002) was used as reference for all patients [NCHS (National Center of Health Statistics)-2000 CDC Growth Charts: United States (Accessed February 16th, 2012, at http://www.cdc.gov/growthcharts/)]. These files contain the L, M and S parameters needed to generate exact percentiles and z-scores. These parameters are the median (M), the generated coefficient of variation (S), and the Box-Cox transformation (L). To obtain z-scores of a given physical measurement, we used
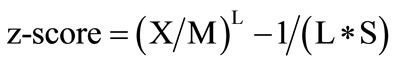 , (I)
, (I)
where L, M and S are the values from the appropriate table corresponding to the age of child in months. Similarly, we calculated the height and weight z-scores using the published Box-Cox transformations for these parameters. BMI, weight and height z-scores were also calculated for the cohort of 4375 patients using the WHO (2007) growth charts by referring to the most recent WHO (2007) growth charts provided by the World Health Organization website (http://www.who.int/childgrowth/en/).
Using GraphPad Prism software version 5.01 for Windows (GraphPad Software, San Diego, CA, USA), contiguous data were analysed for normal distribution using the Shapiro-Wilk normality test. Mean and standard deviation were reported for normally distributed data, otherwise, median, 25th, 75th percentiles and range were given. Simple descriptive tests were employed using parametric tests for normally distributed data and nonparametric tests otherwise. We used the non-parametric Wilcoxon matched pair test for intra-patient and MannWhitney t-test for inter-patient not normally distributed variables. To assess the agreement between height, weight and BMI z-scores calculated using the WHO growth charts and the NHANES III reference intervals, we performed Bland & Altman analysis. A p-value of <0.05 was considered statistically significant.
3. RESULTS
This study was a post-hoc analysis of all 4375 patients aged 5 - 20 years that were recruited into a larger healthy weights study at Children’s Hospital, London Health Sciences Centre. Parts of the study have been published elsewhere [8]. Median age was 11.8 years (range 5.09 - 20.85 years, 1993 females = 45.6%), median height for the entire group of patients was 149.9 cm (range 78.0 - 164.5 cm), median weight was 43.5 kg (range 10.9 - 170.0 kg) and median BMI was 19.05 kg/m2 (range 10.71 - 62.69 kg/m2). When calculated with reference to the NHANES III reference charts, median height z-score for the entire group of patients was +0.29 (25th percentile = −0.50, 75th percentile = 1.03, p < 0.0001, Wilcoxon signed rank test), median weight z-score was +0.46 (25th percentile = −0.27, 75th percentile = 1.20, p < 0.0001, Wilcoxon signed rank test) and median BMI z-score +0.46 (25th percentile = −0.33, 75th percentile = 1.23, p < 0.0001, Wilcoxon signed rank test). Z-score calculations with reference to the WHO (2007) growth charts for the entire group of patients revealed a median height z-score +0.32 (25th percentile = −0.48, 75th percentile = 1.06, p < 0.0001, Wilcoxon signed rank test), median weight zscore was +2.95 (25th percentile = +0.60, 75th percentile = 3.15, p < 0.0001, Wilcoxon signed rank test) and median BMI z-score +0.53 (25th percentile = −0.30, 75th percentile = 1.48, p < 0.0001, Wilcoxon signed rank test). When the entire group of patients was considered, the Mann-Whitney t-test revealed a significant difference in medians between z-scores calculated using the NHANES III and the WHO III growth charts for weight (p < 0.0001) and BMI z-scores (p < 0.0001). No significant difference was observed in the case of height z-scores (p = 0.1835).
Furthermore, the agreement between weight, height and BMI z-scores obtained through the use of both NHANES III and WHO (2007) charts was investigated using the Bland & Altman analysis. Bland & Altman bias and standard deviation results are summarized in Table 1 for age groups.
To investigate age dependency, the entire group of patients was then stratified into age groups and a similar comparison within each age group was conducted for height, weight and BMI z-scores calculated by using both the NHANES III and the WHO (2007) growth charts (Table 1). Age classification revealed no significant age dependency for height z-scores across all age groups. By contrast, we observed a significant age dependency for weight z-scores starting at the age of 7 years, and a significant age dependency of BMI z-scores from the age of 7 years to 13 years only with the higher medians obtained when using the WHO (2007) growth charts (Figure 1).
Another way of looking at the data pertains to an assessment of how many patients would be classified as either below the 5th or over the 95th percentile with respect to either growth chart. The results of this analysis are given in Table 2. The biggest discrepancies between both growth charts were observed for the classification of patients above the 95th percentile (z-score of +1.96) for weight and BMI variables. Especially for weight, a much larger proportion of patients were labelled as above the 95th percentile using the WHO growth chart when compared to the CDC growth chart. By contrast, there was good agreement for height. With respect to below the 5th percentile (z-score of −1.96), discrepancies occurred with respects to underweight proportions. This time, the CDC growth charts labelled a larger number of patients as underweight than the WHO growth charts.
Gender dependency was also investigated across all age groups by stratifying patients according to gender within each age group and a repeat of the above analysis was conducted for height, weight and BMI z-scores, (Table 3), calculated with reference to both the NHANES III and the WHO (2007) growth charts. Results revealed a significant difference between the medians of the weight
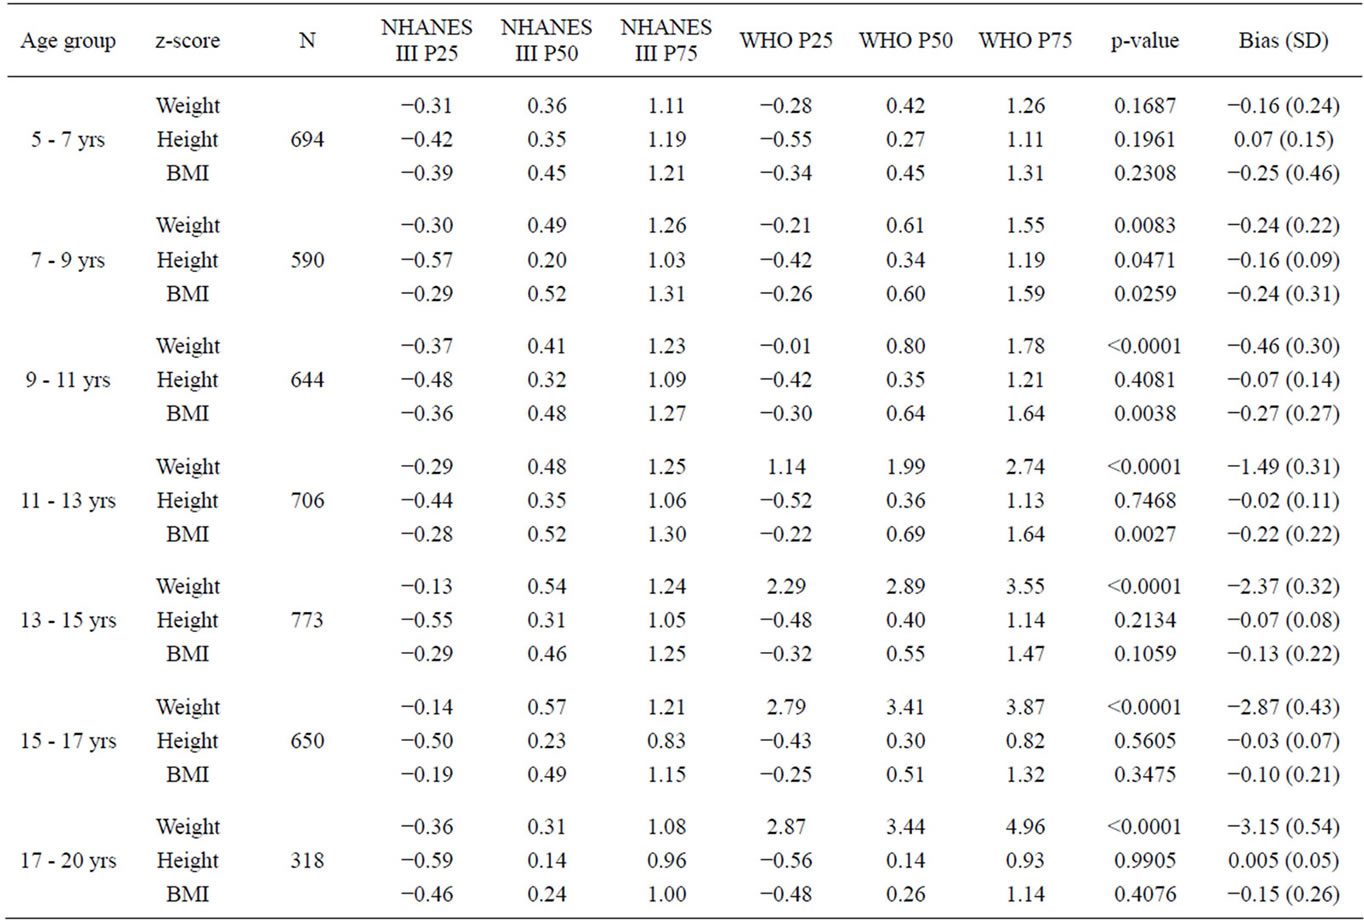
Table 1. Comparison of NHANES III and WHO weight, height and BMI z-scores of 4375 Canadian children of a single tertiary care centre classified into age groups (*p-value = Mann Whitney parametric t-test p-value, *Bias (SD) = Bland & Altman agreement test bias and standard deviation values).
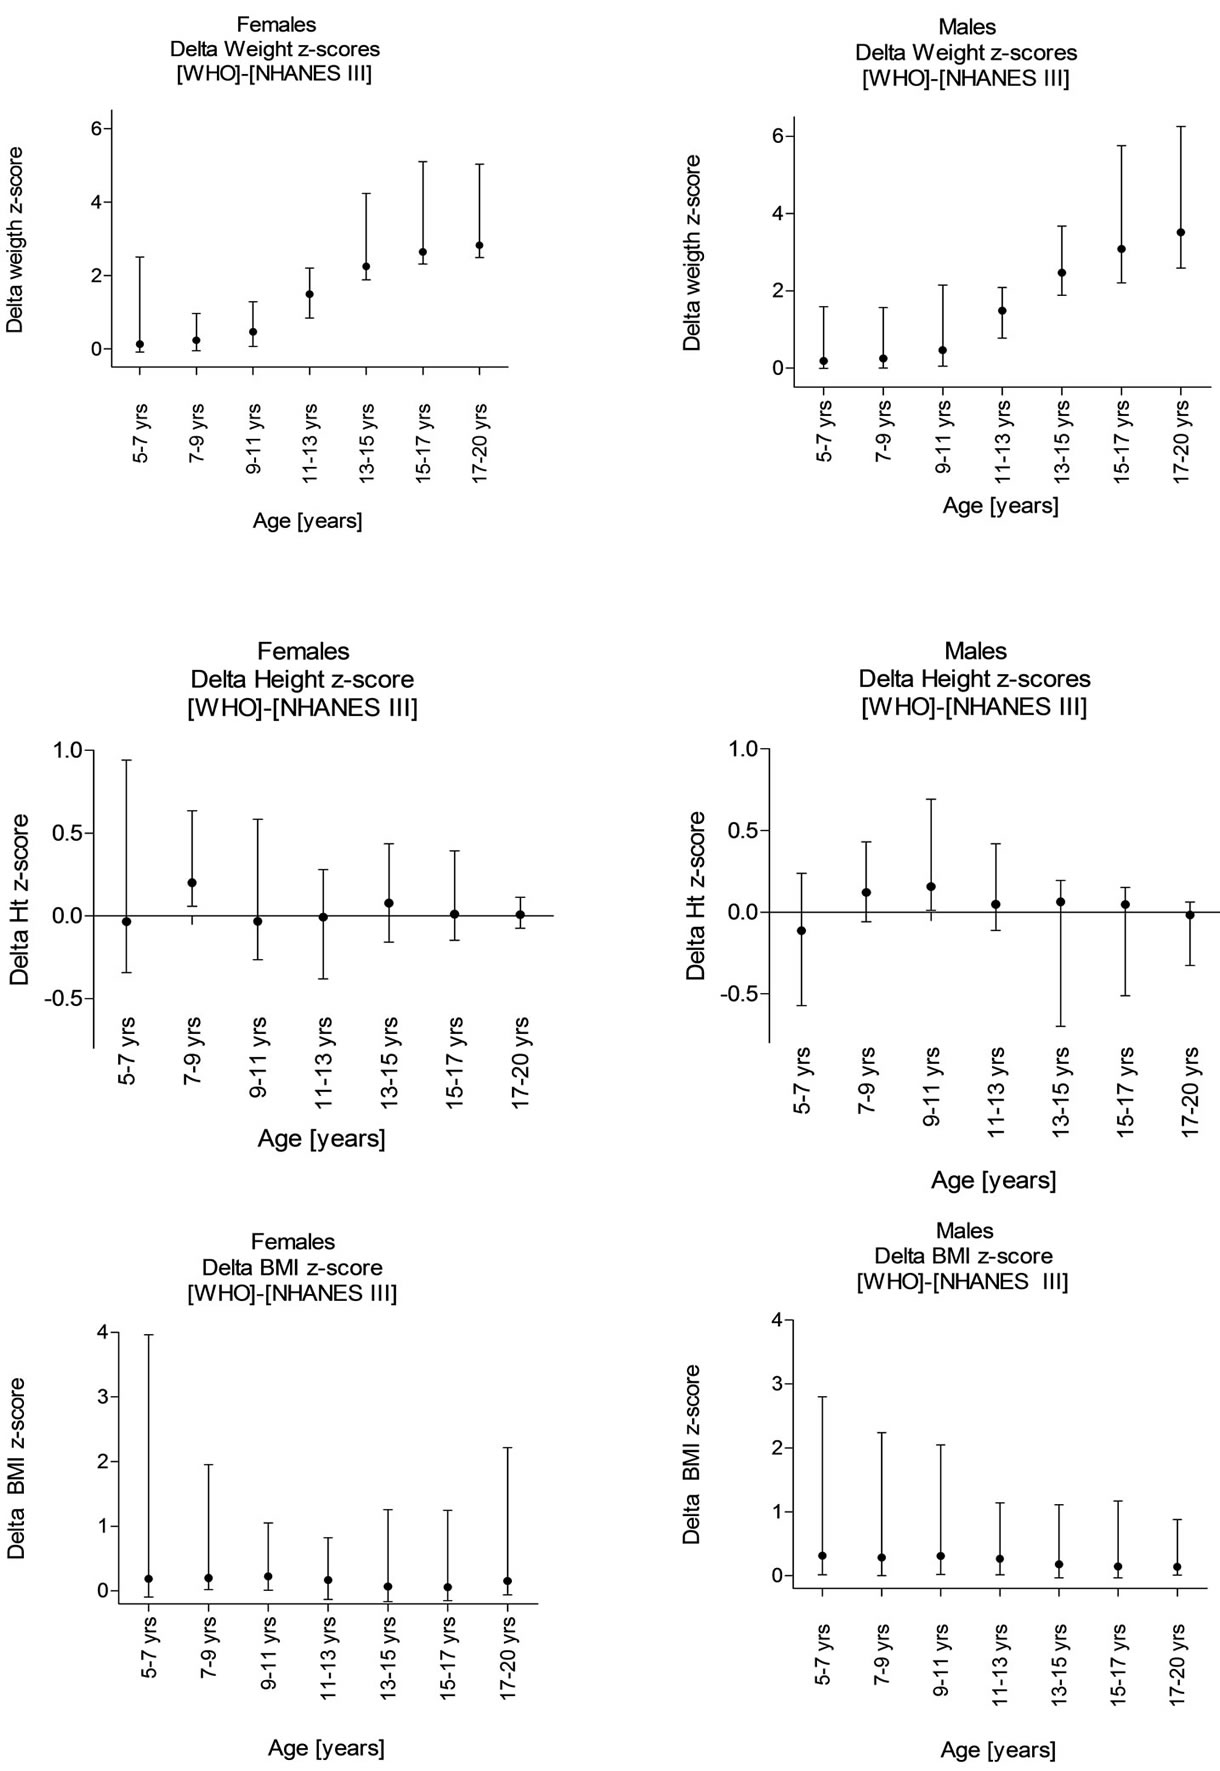
Figure 1. Change in weight, height and BMI z-score stratified by gender for children ranging in age from 5 years to 20 years.
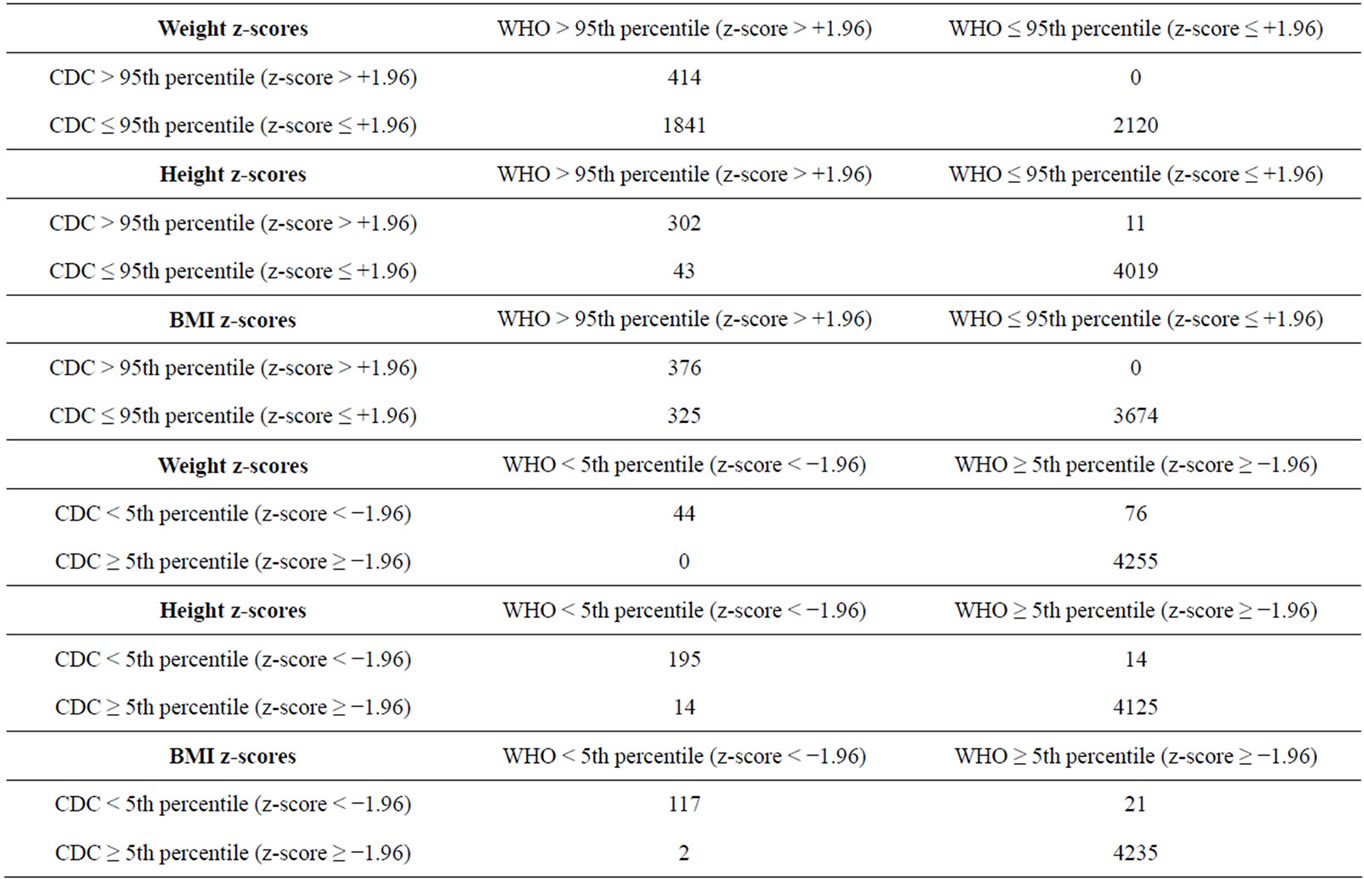
Table 2. The number of patients above the 95th (or below the 5th) percentile for both height and weight and both growth charts.
z-scores for females with higher median obtained using the WHO (2007) growth charts starting at the age of 7 years. On the other hand, weight z-scores for males were significantly different with higher medians obtained through using the WHO (2007) growth charts starting at the age of 9 years. Interestingly, height z-scores were not significantly different across all age groups for both genders. Medians of BMI z-scores were not significantly different for females across all age groups and only significantly different for males from the age of 9 to 13 years with the medians higher when calculated with reference to the WHO (2007) growth charts.
When the group of adolescent males and females (age 13 - 20 years) was taken as whole and the Mann-Whitney nonparametric t-test was applied for comparison of weight, height and BMI z-score medians calculated using the NHANES III and WHO (2007) growth charts for both genders, results showed a significant gender difference with regards height and weight z-scores. There was no significant difference for BMI z-scores between both genders when using both growth charts (Table 4).
4. DISCUSSION
Not unexpectedly, we found that the results of our cohort of real patients differed markedly depending on which tool (or growth chart) was used to assess the patients. As predicted, there were marked differences with weight z-scores, but surprisingly only minimal differences for height z-score. As weight z-scores were very different, the differences in BMI z-scores were expected.
The second important finding that originates from these results is that classification of abnormal are dramatically affected by the choice of the assessment tool. The proportion of obese patients based on the BMI z-score (above the 95th percentile) increased from 376/ 4375 (8.6%) to 701/4375 (16.0%). This means a doubling of the obesity rates with the application of WHO growth charts.
The effects were much less dramatic when assessing short stature and a BMI below the 5th percentile. For children under the 5th percentile for weight, a larger number of children (120 rather than 44) would be qualified as underweight when applying the CDC growth charts.
The differences are not that surprising. A comparison of the two growth charts was performed by both de Onis [9] and Grummer-Strawn [10] and clearly showed differences of the two growth charts, especially for younger children. Mei et al. have demonstrated an age-dependency [11]. Only a few studies have actually compared the results from the two different growth charts in actual
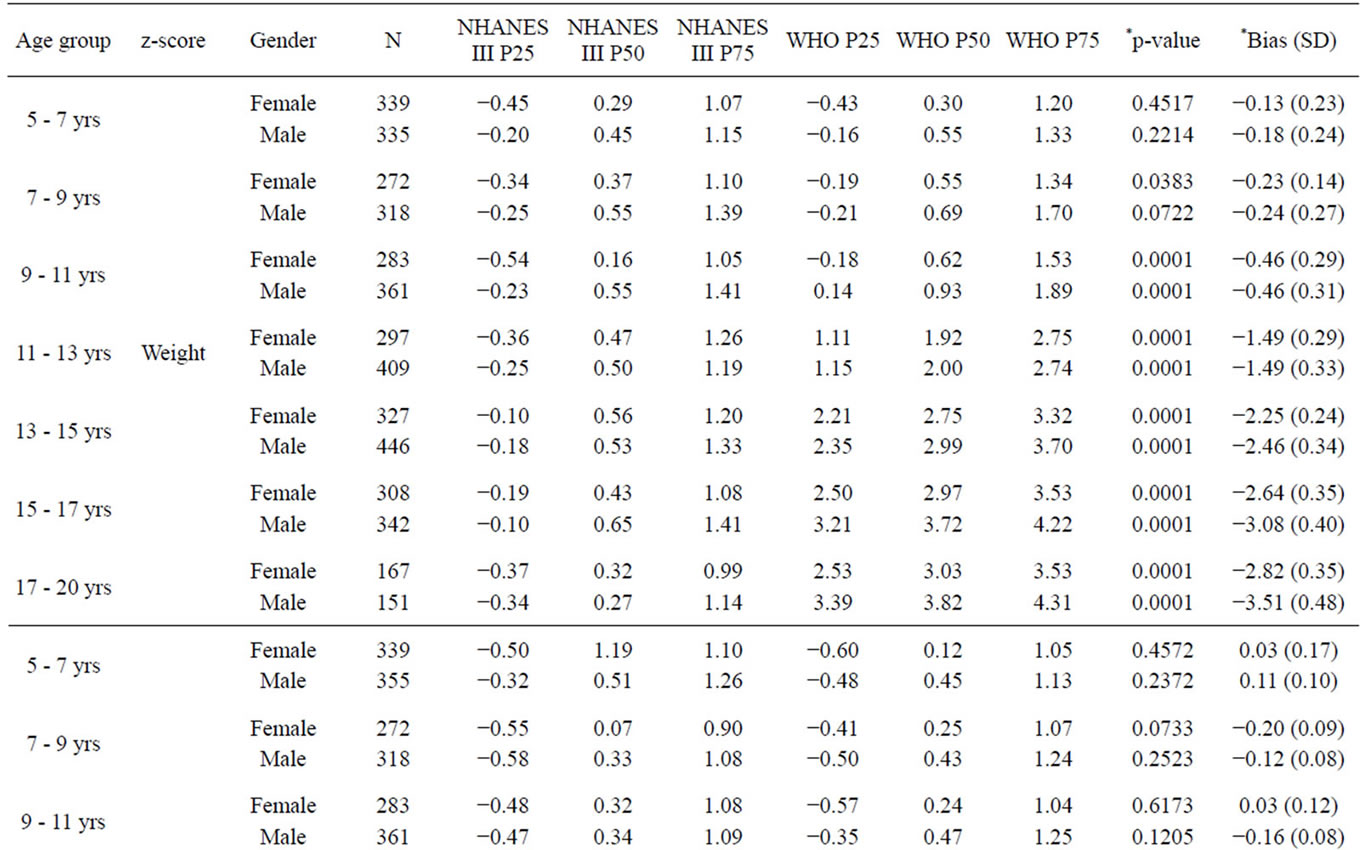
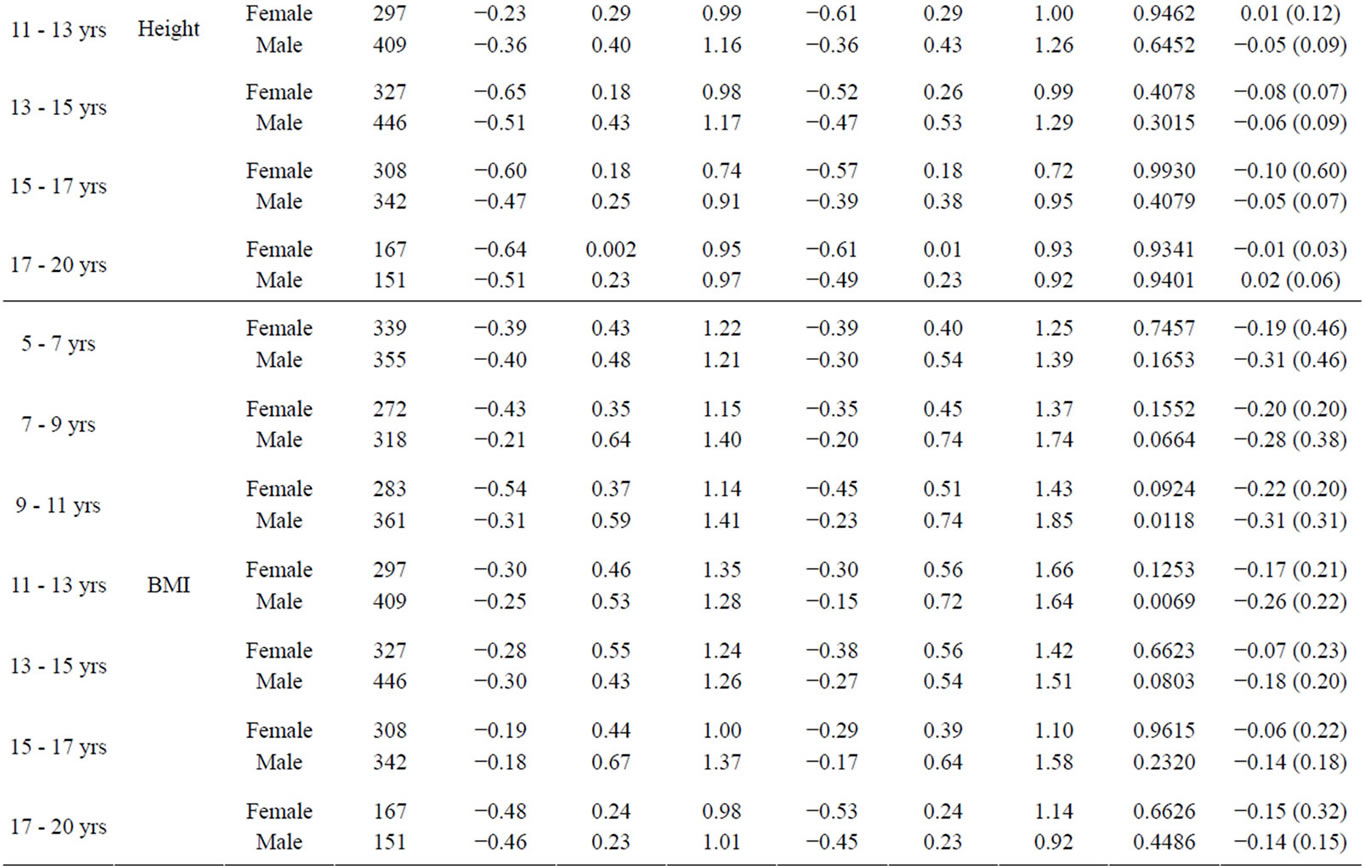
Table 3. Comparison of NHANES III and WHO weight, height and BMI z-scores of 4375 Canadian children of a single tertiary care centre stratified by gender (*p-value = Mann Whitney parametric t-test p-value, *Bias (SD) = Bland & Altman agreement test bias and standard deviation values).
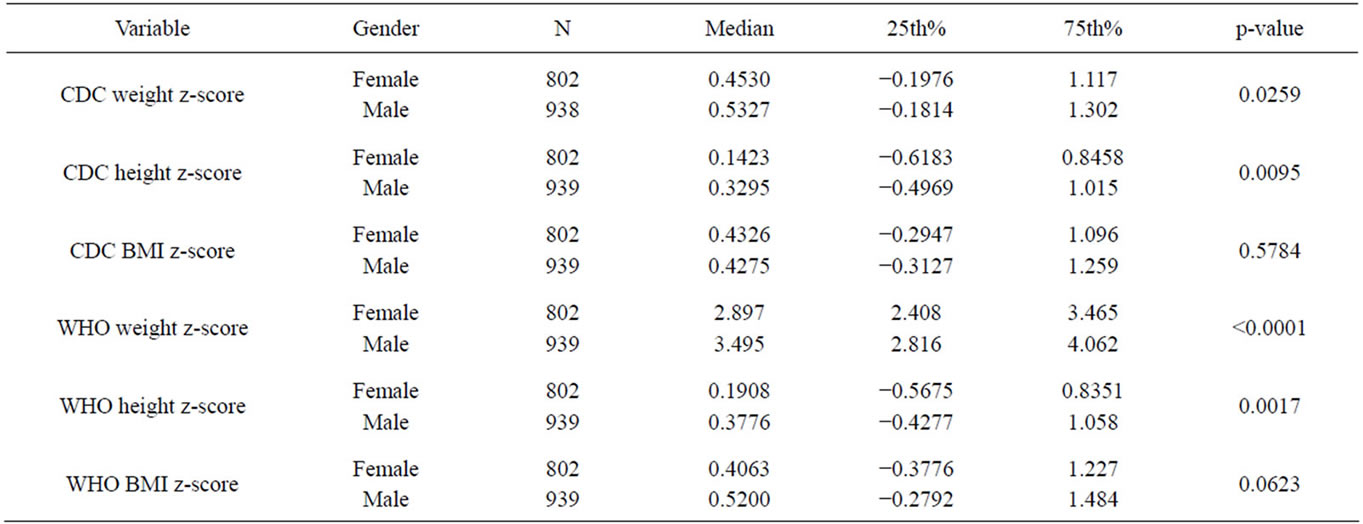
Table 4. Genderdescriptive statistics of the NAHNES III and WHO weight, height and BMI z-scores for adolescent (age 13 - 20 years) (*p value = Mann Whitney t-test probability).
patient populations, such as Mei et al. did in 10,844 children who participated in the California Child Health and Development study [12]. In that study, it was clearly shown that the choice of the growth chart would affect referrals for failure to thrive. Another, much smaller study on 337 Brazilian children, also less than five, identified a higher number of underweight children [13]. However, these studies only addressed young children. We only found a few studies that performed the same analysis in children aged 5 - 19. A study of 20,605 school children in 11 low-income countries demonstrated differences predominantly in the prevalence of thinness rather than wasting [14]. A Pakistani study of 1860 children demonstrated a higher proportion of over-nutrition when using the WHO growth charts, while thinness was lower [15]. The Pakistani study came to the conclusion that the WHO charts more adequately assessed the children because the z-scores were closer to zero. Kulaga et al. studied a Polish cohort using both the CDC and the WHO as well as a local growth chart and also found significant differences [16]. Presumably, the population of Canada with its high prevalence of obesity is different [8]. We are unaware of similar studies among G8 countries. Our study fills the gap and provides an analysis of older children. The extent of the differences is astounding: Application of the WHO growth charts would double the already high obesity rates among Canadian children and adolescents aged 5 - 20.
The intention of the developers of the WHO reference intervals has merit, and many organizations push for the implementation of these growth charts, recognizing that they are derived from standardized breast-fed children [7]. Unfortunately, the breastfeeding rate with exclusive breastfeeding up to 6 months of age in Canada is appallingly low. Canadian breast feeding rates are high at initiation of breastfeeding, but drop to undesirably low rates by 6 months: A recent study found breastfeeding intention (90.0%) and initiation (90.3%) rates to be high, although exclusive breastfeeding rates at 6 months after birth (14.4%) were much lower than desirable [17,18]. The question remains whether the different development in non-breastfed children should be considered abnormal. Of course, more effective national strategies to improve breastfeeding rates in Canada have to be developed. More importantly, the application of the new WHO growth charts will lead to a significantly higher proportion of children and adolescents being obese, thereby increasing the already high rate of childhood obesity in Canada. This has potential implications on the health care system. Also, the rate of underweight children will change, as we have clearly demonstrated, and the effect of this remains to be studied.
The study has several limitations. We used a convenient sample of hospital patients, not population data. We did not adjust for ethnicity, which is an important determinant of growth [19]. However, the population in South Western Ontario is largely Caucasian [8]. Further, the healthy weight study was not designed for the analysis of this question. We performed a post-hoc analysis on a population that reflects a “real-life” population. As outlined above, the magnitude of the differences between both growth charts has not previously been demonstrated. As such, we recommend using caution while interpreting results obtained by using both reference growth charts, especially when labelling results as abnormal.
5. CONCLUSION
In conclusion, WHO and NHANES III reference intervals provided for rather differing results when applied to a Canadian convenience sample of a tertiary care hospital. The differences varied by age, and the differences are most probably confounded by nutrition and activity. The rate of childhood obesity doubles when applying the WHO reference intervals. The user has to be very aware of these differences. We need additional studies to assist the paediatricians in the decision making process of whether or not to intervene because of abnormal z-scores. The ramifications of these differences are totally understudied.
REFERENCES
- Kuczmarski, R.J., Ogden, C.L., Grummer-Strawn, L.M., et al. (2000) CDC growth charts: United States. Advance data, 1-27.
- De Onis, M., Wijnhoven, T.M. and Onyango, A.W. (2004) Worldwide practices in child growth monitoring. Journal of Pediatrics, 144, 461-465. doi:10.1016/j.jpeds.2003.12.034
- De Onis, M., Onyango, A., Borghi, E., Siyam, A., Blossner, M. and Lutter, C. (2012) Worldwide implementation of the WHO Child Growth Standards. Public Health Nutrition, 1-8.
- Horwitz, A. (1983) Changing concepts of health and health services: New opportunities for nutrition promotion. Bulletin of the Pan American Health Organization, 17, 61-76.
- De Onis, M., Garza, C., Victora, C.G., Onyango, A.W., Frongillo, E.A. and Martines, J. (2004) The WHO multicentre growth reference study: Planning, study design, and methodology. Food and Nutrition Bulletin, 25, S15- S26.
- De Onis, M., Onyango, A.W., Borghi, E., Siyam, A., Nishida, C. and Siekmann, J. (2007) Development of a WHO growth reference for school-aged children and adolescents. Bulletin of the World Health Organization, 85, 660-667. doi:10.2471/BLT.07.043497
- Dietitians of Canada and Canadian Paediatric Society (2012) Prompting optimal monitoring of child growth in Canada: using the new WHO growth charts. http://www.dietitians.ca/Downloadable-Content/Public/tcg-position-paper.aspx
- Filler, G., Yasin, A., Kesarwani, P., Garg, A.X., Lindsay, R. and Sharma, A.P. (2011) Big mother or small baby: Which predicts hypertension? Journal of Clinical Hypertension (Greenwich), 13, 35-41. doi:10.1111/j.1751-7176.2010.00366.x
- De Onis, M., Garza, C., Onyango, A.W. and Borghi, E. (2007) Comparison of the WHO child growth standards and the CDC 2000 growth charts. The Journal of Nutrition, 137, 144-148.
- Grummer-Strawn, L.M., Reinold, C. and Krebs, N.F. (2010) Use of World Health Organization and CDC growth charts for children aged 0 - 59 months in the United States. MMWR Recommendations and Reports: Morbidity and Mortality Weekly Report Recommendations and Reports/Centers for Disease Control, 59, 1-15.
- Mei, Z., Ogden, C.L., Flegal, K.M. and Grummer-Strawn, L.M. (2008) Comparison of the prevalence of shortness, underweight, and overweight among US children aged 0 to 59 months by using the CDC 2000 and the WHO 2006 growth charts. Journal of Pediatrics, 153, 622-628. doi:10.1016/j.jpeds.2008.05.048
- Mei, Z. and Grummer-Strawn, L.M. (2011) Comparison of changes in growth percentiles of US children on CDC 2000 growth charts with corresponding changes on WHO 2006 growth charts. Clinical Pediatrics, 50, 402-407. doi:10.1177/0009922810392774
- Silveira, C.R., Beghetto, M.G., Carvalho, P.R. and Mello, E.D. (2011) Comparison of NCHS, CDC and WHO growth charts in the nutritional assessment of hospitalized children up to five years old. Nutricion Hospitalaria: Organo oficial de la Sociedad Espanola de Nutricion Parenteral y Enteral, 26, 465-471.
- Rousham, E.K., Roschnik, N., Baylon, M.A., et al. (2011) A comparison of the National Center for Health Statistics and new World Health Organization growth references for school-age children and adolescents with the use of data from 11 low-income countries. The American Journal of Clinical Nutrition, 94, 571-577. doi:10.3945/ajcn.110.008300
- Mushtaq, M.U., Gull, S., Mushtaq, K., et al. (2012) Height, weight and BMI percentiles and nutritional status relative to the international growth references among Pakistani school-aged children. BMC Pediatrics, 12, 31. doi:10.1186/1471-2431-12-31
- Kulaga, Z., Litwin, M., Tkaczyk, M., et al. (2010) The height-, weight-, and BMI-for-age of Polish school-aged children and adolescents relative to international and local growth references. BMC Public Health, 10, 109. doi:10.1186/1471-2458-10-109
- Chalmers, B., Levitt, C., Heaman, M., O’Brien, B., Sauve, R. and Kaczorowski, J. (2009) Breastfeeding rates and hospital breastfeeding practices in Canada: A national survey of women. Birth, 36, 122-132. doi:10.1111/j.1523-536X.2009.00309.x
- Grummer-Strawn, L.M. (2010) CDC efforts and leadership on breastfeeding. Breastfeeding Medicine: The Official Journal of the Academy of Breastfeeding Medicine, 5, 207-208. doi:10.1089/bfm.2010.0065
- Hof, M.H., van Dijk, A.E., van Eijsden, M., Vrijkotte, T.G. and Zwinderman, A.H. (2011) Comparison of growth between native and immigrant infants between 0 - 3 years from the Dutch ABCD cohort. Annals of Human Biology, 38, 544-555. doi:10.3109/03014460.2011.576701
NOTES
*Support/Funding for the study: This study was fully supported by Children’s Health Foundation in London, Ontario, Canada.
#Corresponding author.