Paper Menu >>
Journal Menu >>
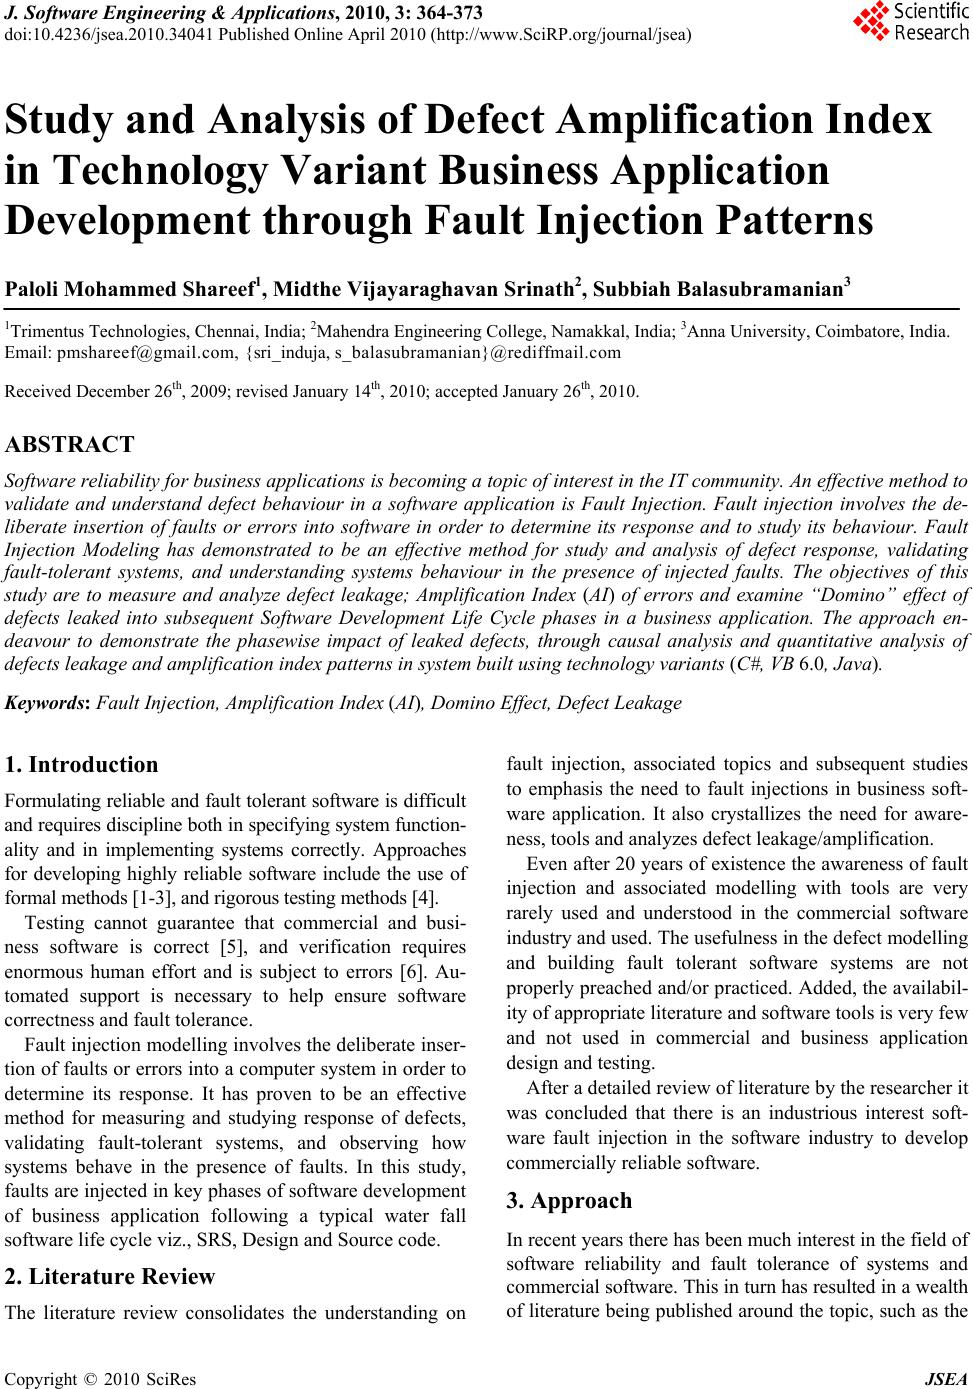 J. Software Engineering & Applications, 2010, 3: 364-373 doi:10.4236/jsea.2010.34041 Published Online April 2010 (http://www.SciRP.org/journal/jsea) Copyright © 2010 SciRes JSEA Study and Analysis of Defect Amplification Index in Technology Variant Business Application Development through Fault Injection Patterns Paloli Mohammed Shareef1, Midthe Vijayaraghavan Srinath2, Subbiah Balasubramanian3 1Trimentus Technologies, Chennai, India; 2Mahendra Engineering College, Namakkal, India; 3Anna University, Coimbatore, India. Email: pmsha reef@gmail.c om, {sri_induja, s_ba lasubramanian}@rediffma il.com Received December 26th, 2009; revised January 14th, 2010; accepted January 26th, 2010. ABSTRACT Software reliab ility for bu siness a pplica tions is be coming a topic of interest in th e IT community. An effective metho d to validate and understand defect behaviour in a software application is Fault Injection. Fault injection involves the de- liberate insertion of faults or errors into software in order to determine its response and to study its behaviour. Fault Injection Modeling has demonstrated to be an effective method for study and analysis of defect response, validating fault-tolerant systems, and understanding systems behaviour in the presence of injected faults. The objectives of this study are to measure and analyze defect leakage; Amplification Index (AI) of errors and examine “Domino” effect of defects leaked into subsequent Software Development Life Cycle phases in a business application. The approach en- deavour to demonstrate the phasewise impact of leaked defects, through causal analysis and quantitative analysis of defects leakage and amplifica tion index patterns in system built using technology variants (C#, VB 6.0, Java). Keywords: Fault Injection, Amplification Index (AI), Domino Effect, Defect Leakage 1. Introduction Formulating reliable and fault tolerant software is difficult and requires discipline both in specifying system function- ality and in implementing systems correctly. Approaches for developing highly reliable software include the use of formal methods [1-3], and ri gorous te sti ng methods [4]. Testing cannot guarantee that commercial and busi- ness software is correct [5], and verification requires enormous human effort and is subject to errors [6]. Au- tomated support is necessary to help ensure software correctness and fault tolerance. Fault injection modelling involves the deliberate in ser- tion of faults or errors into a computer system in order to determine its response. It has proven to be an effective method for measuring and studying response of defects, validating fault-tolerant systems, and observing how systems behave in the presence of faults. In this study, faults are injected in key phases of software development of business application following a typical water fall software life cycle viz., SRS, Design and Source code. 2. Literature Review The literature review consolidates the understanding on fault injection, associated topics and subsequent studies to emphasis the need to fault injections in business soft- ware application. It also crystallizes the need for aware- ness, tools and analyzes defect leakage/amplification. Even after 20 year s of ex istence th e awarene ss of fa ult injection and associated modelling with tools are very rarely used and understood in the commercial software industry and used. The us efuln ess in the defect mod elling and building fault tolerant software systems are not properly preach ed and/or practiced. Added, the av ailabil- ity of appropriate literature and software tools is very few and not used in commercial and business application design and testing. After a detailed review of literature by the researcher it was concluded that there is an industrious interest soft- ware fault injection in the software industry to develop commercially reliable software. 3. Approach In recent years there has been much interest in the field of software reliability and fault tolerance of systems and commercial software. This in tu rn has resulted in a wealth of literature being p ublished around the topic, such as th e  Study and Analysis of Defect Amplification Index in Technology Variant Business Application 365 Development through Fault Injection Patterns Fault Injection in the form of the ‘Marrying Software Fault Injection Technology Results with Software Reli- ability’ by Jeffrey Voas, Cigital Norman Schneidewind. Many critical business computer applications require “fault tolerance,” the ability to recover from errors or exceptional conditions. Error free software is very diffi- cult to create and creating fault tolerant software is an even greater challenge. Fault tolerant software must suc- cessfully recover from a multitude of error conditions to prevent harmful system failures. Software testing cannot demonstrate that a software system is completely correct. An enormous number of possible executions that must be examined in any real-world sized software system. Fault tolerance ex- pands the number of states (and thus execution histories) that must be tested, because inconsistent or erroneous states must also be tested. Mailing lists, websites, research and forums have been created in which all aspects of this fresh new niche soft- ware engineering area are discussed. People are inter- ested, partly because it is a new area but also because the whole field of commercial software reliability is in itself so interesting; as it holds so many wide ranging disci- plines, perspectives and logic at its core. Software reli- ability engineering is uniting professionals in disciplines that previously had little to do with one anoth er, it is cre- ating more opportunities for employment in the online environment, and it is changing the face and structure of all information that we seek out on the web. In the era of economic recession, customer demands reliable, certified and fault tolerant commercial and business software ap- plications. In this research, the focus is on software testing tech- niques that use fault injection. Several potentially pow- erful existing systems have drawbacks for practical ap- plication in business application development environ- ment. We first examine existing fault injection tech- niques and evaluate their potential for practical applica- tion for commercial and business software applications. Available and accessible literature infrastructure includ- ing premium subscribed IEEE and ACM resources were studied and summarized for literature review from 1986 (20 years). 4. Fault Injection Modelling Fault Injection Modelling (FIM) involves the deliberate insertion of faults or errors into a computer system in order to determine its response. It has proven to be an effective method for measuring and studying response of defects, validating fault-tolerant systems, and observing how systems behave in the presence of faults. In this study, faults are injected in all phases of software devel- opment life cycle viz., Requirements, Design and Source code. 4.1 Objectives The objectives of conducting these experiments are to measure process efficiencies, statistically study, analysis and report defect amplification of defects (Domino’s effect) across software development phases with a simi- lar system constructed with technological variation. The goal of this research is to understand the behav- iour of faults and defects pattern in commercial and business software application and defect leakage in each phase of application devel opment . Throughout the literature certain questions reoccur, which one would anticipate when a new field emerges in commercial software fault tolerance? People are inter- ested, and want to understand and define commercial software reliability and fault tolerance since the work on most fault injections and software reliability is found in life critical and mission critical application, so we try to answer the following questions; Why study Fault Injection Modelling? Why study business software fault tolerance re- quirements? Why are they called ‘Fault Injection & Error Seed- ing’? Why review Software Implemented Fault Injection (SWIFI)? What work was performed, current status and work proposed? These questions will be expanded upon throughout th e research, and seek to bring clarity to those who want to find the answers to the above, or to see if there truly are any answers! 4.2 Background Concepts A fault is a hardware or software defect, inconsistency, transient electrical field, or other abnormal circumstance. An error is an invalid internal state, which may or may not be detected by the system. A failure is an invalid output. Thus a fault or error be- comes a failure when it propagates to the output. There is a natural progression from fault to error to failure. Re- covery code is the part of a program that is designed to respond to error states. Recovery code executes after the program recognizes that some erroneous or abnormal state has been entered. This code should gracefully re- store the system to a valid state before a failure occurs. Figure 1 shows the progression from faults to errors and finally to failures. The recovery code should serve as a safety net to prevent the progression from error to fail- ure. A fault tolerant system should never fail, even if it has faults. Testing recovery code requires the modeling of bad states that accurately simulate exceptional situations. As much as 50% of a fault tolerant program can consist of recovery code. Although testing might include invalid Copyright © 2010 SciRes JSEA  Study and Analysis of Defect Amplification Index in Technology Variant Business Application 366 Development through Fault Injection Patterns data that executes some of the recovery code, often much of this code is never executed during normal testing. Any recovery code testing technique must be based upon an assumed fault model [7]. We assume that all faults will behave according to some specific rules. Any fault model can only consider a subset of all possible faults. For example, a common debugging practice is to insert a series of print statements in key positions. This debug- ging practice assumes a particular fault model. Faults will cause the program to execute in the incor- rect order and will be demonstrated Figure 2 illustrates the taxonomy of Fault Injection Techniques in the printed output. Clearly, not all faults will adhere to this model. No one fault model will fit all faults. However, a fault model can be very effective in detecting faults that fit th e model. Fault Injection technique of fault injection dates back to the 1970s when it was first used to induce faults at a hardware level. This type of fault injection is called Hardware Implemented Fault Injection (HWIFI) and attempts to simulate hardware failures within a system. The first experiments in hardware fault injection in- volved nothing more than shorting connections on circuit boards and observing the effect on the system (bridging faults). It was used primarily as a test of the dependabil- ity of the hardware system. Later specialised hardware was developed to extend this technique, such as devices to bombard specific areas of a circuit board with heavy Figure 1. Fault tolerance terms Figure 2. Taxonomy of fault injection techniques radiation. It was soon found that faults could be induced by software techniques and that aspects of this technique could be useful for assessing software systems. Collec- tively these techniques are known as Software Imple- mented Fault Inj ection (SWIFI) [8]. Martin defines software fault injections as faults which are injected at the software level by corrupting code or data. So faults are applicable at the implemen tation pha se when the code of the system is available, and it can be applied on an application to simulate either internal or external faults. Internal faults represent design and implementation faults, such as variables/parameters that are wrong or no t initialized, incorrect assignments or condition checks. External faults represent all external factors that are not related to faults in the code itself but that alter the sys- tem’s state. The injection of failures can discover errors that nor- mal procedures cannot. First, it tests the mechanisms of exception and treatment of failures that in normal cir- cumstances are not sufficiently proven an d, helps to ev a- luate the risk, verifying how much defective can be the system behavior in presence of errors. All of the injection failures methods are based on concrete hardware or software characteristics associated to systems which are applied, then, to realize generalizations is a very compli- cated task. 4.3 Prior Work on Fault Injection Fault injection can be used to modify either a program’s source code text or the machine state of an executing program. Figure 2 shows taxonomy of the key methods of fault injection. Fault injection techniques based on static analysis-program source modification-are mod- eled by the left subtree. The most common static fault injection is mutation testing. The right subtree in Figure 2 models dynamic fault injection techniques where changes are made to an actively running program’s state. Much of the recent fault injection research is concer ne d wi t h dy namic injection. 4.4 Domino’s Effect Domino’s effect is the cascading effect of defects from the initial stages of the pro ject to all the subsequent stag- es of the software life cycle. Errors undetected in one work product are ‘leaked’ to the child work product and amplifies defects in the child work product. This chain reaction causes an exponential defect leakage. E.g.: un- detected errors in requirements leak and cause a signifi- cant number of defects in design which, in turn, causes more defects in the source code. The result of this study is to arrive at an “Amplification Index” which will char- acterize the extent of impact or damage of phase-wise defects in subsequent Software Development Life Cycle Copyright © 2010 SciRes JSEA  Study and Analysis of Defect Amplification Index in Technology Variant Business Application 367 Development through Fault Injection Patterns (SDLC) phases. The defect components in a work product and leakage into subsequent phases are illustrated in Figure 3 below: 4.5 Trimentus Approach for Fault Injection Experiments Defects were deliberately injected into each phase (work product) in the software development life cycle of a typ- ical application development project and the effect of the defects injected was studied subsequently. The injected defects are typical defects that are characteristic of the software systems of a commercial application on Library Management System (LMS) and were chosen from the organizati onal defect dat abase. An approach was adopted towards stud ying the impact of defect amplification in a software system was causal analysis of the defects occurring in subsequent phases caused due to injected defects. Fault injection can occur in several ways: Additional code can be linked to the target program and executed synchronously with the program flow. A separate process can perform the injection asyn- chronously with the flow of the target process. Separate hardware can directly access the memory to modify the state, thus not affecting the timing char- acteristics of the target process. Overlay faults occur when a program writes into an incorrect location due to a faulty destination operand. Chillarege and Bowen claim that overlay faults account for 34% of the errors in systems programs. The experi- ment involved the use of failure acceleration, decreasing fault and error latency and increasing the prob ability that a fault will cause an error. The experiment applied failure acceleration by corrupting a large region of memory in a single injection. To inject an overlay fault, all bits in an entire page of physical memory are set to one. Because the page is in physical memory, the probability that the latency will be short is further increased. About 16% of the faults immediately crashed the system; about 14% caused a partial loss of service, which was usually re- covered from soon after. Half of the faults did not cause failures. These poten- tial hazards are failures waiting to occur. The injection Figure 3. Fault injection pattern process used was manual and only 70 faults were in- jected during the entire experiment. Software faults introduced include: Initialization faults: incorrectly or uninitialized vari- ables. They are modeled by dynamically replacing the initializing assembly instructions with incorrect values or no-ops. Assignment faults: incorrect assignment statements. Variable names on the right hand side are changed by dynamically mutating the assembly code. Condition check faults: missing condition checks, for example, failure to verify return values. Condi- tion checks are either entirely overwritten with no-ops, or replac ed a n incorrect condition check. Function faults: Invalid functions. The assembly code for a function is dynamically replaced with the assembly code from a manually rewritten alternate version. Initialization fau lts can be caught statically w ith a good compiler. The assignment and condition check faults are clearly relevant to the testing of recovery code, since an incorrect assignment or condition can be a condition that should force the execution of recovery code. Function faults are also relevant, especially if they could be auto- matically generated. Unfortunately, manual rewriting of sections of code is prohibitive in a large system. 4.6 Why Study Fault Injection Modelling? Fault Injection Modelling has gradually crept into prom- inence over the last decade as one of the new buzz words in software design. However, as Martin observes: “The main characteristic of fault injection software is that it is capable of injecting failures into any functional addressing unit by means of software, such as memory, registers, and peripherals. The goal of the fault injection software is to reproduce, in the logical scope, the errors that are reproduced after failures in the hardware. A good characterization of failure model should be allowed that this one was as versatile as possible, allowing a major number of combinations among the location, trigger con- ditions, kind of fault and duration, so that the coverage was maximum. Recent days, the Fault Injection tech- nique has been considered as a very useful tool to moni- tor and evaluate the behavior of computing systems in the presence of faults. It’s because the tool tries to pro- duce or simulate faults during an execution of the system under test, and then the behavior of the system is de- tected.”[9] Figure 4 illustrates the relative cost factor in the defect resolution as the work product elaborates in the Software Development Life Cycle phases; The Carnegie Mellon Software Engineering Institute1 1Carnegie Mellon Software Engineering Institute, the Business Case fo r Requirements Engineering, RE’ 2003, 12 Septem be r 2 0 03 . Copyright © 2010 SciRes JSEA 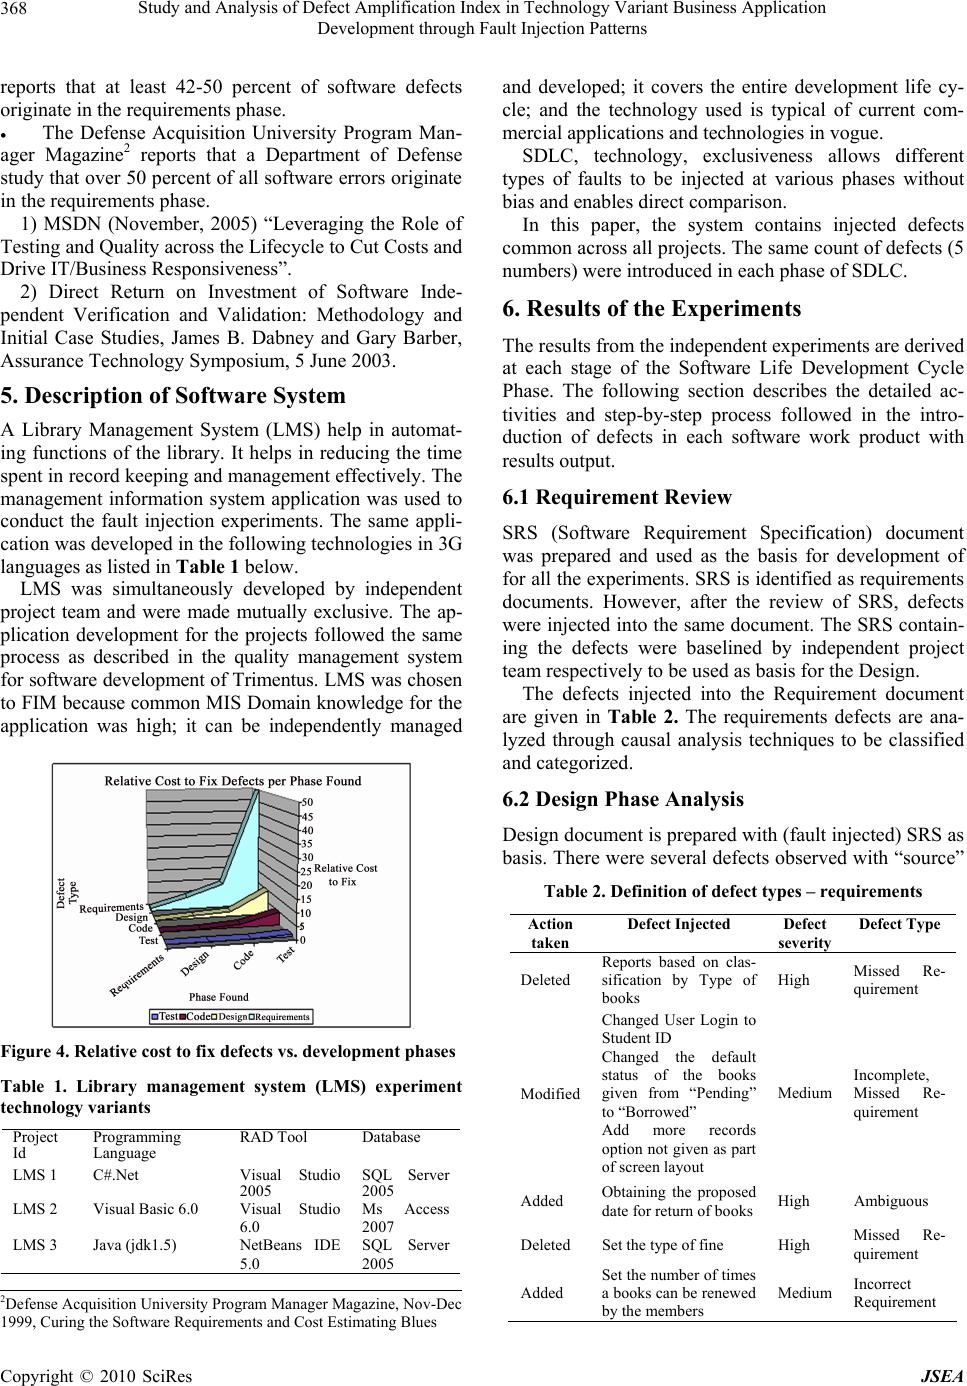 Study and Analysis of Defect Amplification Index in Technology Variant Business Application 368 Development through Fault Injection Patterns reports that at least 42-50 percent of software defects originate in the requirements phase. The Defense Acquisition University Program Man- ager Magazine2 reports that a Department of Defense study that over 50 percent of all software errors originate in the requirem ent s phase. 1) MSDN (November, 2005) “Leveraging the Role of Testing and Quality across the Lifecycle to Cut Costs and Drive IT/Business Responsiveness”. 2) Direct Return on Investment of Software Inde- pendent Verification and Validation: Methodology and Initial Case Studies, James B. Dabney and Gary Barber, Assurance Technology Symposium, 5 June 2003. 5. Description of Software System A Library Management System (LMS) help in automat- ing functions of the library. It helps in reducing the time spent in record keeping and management effectively. The management information system application was used to conduct the fault injection experiments. The same appli- cation was developed in the following technologies in 3G languages as listed in Table 1 below. LMS was simultaneously developed by independent project team and were made mutually exclusive. The ap- plication development for the projects followed the same process as described in the quality management system for software development of Trimentus. LMS was chosen to FIM because common MIS Domain knowledge for the application was high; it can be independently managed Figure 4. Relative cost to fix defects vs. development phases Table 1. Library management system (LMS) experiment technology variants Project Id Programming Language RAD Tool Database LMS 1 C#.Net Visual Studio 2005 SQL Server 2005 LMS 2 Visual Basic 6.0 Visual Studio 6.0 Ms Access 2007 LMS 3 Java (jdk1.5) NetBeans IDE 5.0 SQL Server 2005 and developed; it covers the entire development life cy- cle; and the technology used is typical of current com- mercial application s and technologies in vogue. SDLC, technology, exclusiveness allows different types of faults to be injected at various phases without bias and enables direct comparison. In this paper, the system contains injected defects common across all projects. The same count of defects (5 numbers ) we re introduced in each pha s e o f SD LC. 6. Results of the Experiments The results from the independent experiments are derived at each stage of the Software Life Development Cycle Phase. The following section describes the detailed ac- tivities and step-by-step process followed in the intro- duction of defects in each software work product with results output. 6.1 Requirement Review SRS (Software Requirement Specification) document was prepared and used as the basis for development of for all the experiments. SRS is identified as requirements documents. However, after the review of SRS, defects were injected into the same document. The SRS contain- ing the defects were baselined by independent project team respectively to be used as basis for the Design. The defects injected into the Requirement document are given in Table 2. The requirements defects are ana- lyzed through causal analysis techniques to be classified and categorized. 6.2 Design Phase Analysis Design document is prepared with (fault injected) SRS as basis. There were several defects observed with “source” Table 2. Definition of defect types – requirements Action taken Defect Injected Defect severity Defect Type Deleted Reports based on clas- sification by Type of books High Missed Re- quirement Modified Changed User Login to Student ID Changed the default status of the books given from “Pending” to “Borrowed” Add more records option not given as part of screen layout Medium Incomplete, Missed Re- quirement Added Obtaining the proposed date for return o f b o o k s High Ambiguous Deleted Set the type of fine High Missed Re- quirement Added Set the number of times a books can be renewed by the members Medium Incorrect Requirement 2Defense Acquisition University Program Manager Magazine, Nov-Dec 1999, Curing th e Software R equirements and Cost Estimating Blues Copyright © 2010 SciRes JSEA  Study and Analysis of Defect Amplification Index in Technology Variant Business Application 369 Development through Fault Injection Patterns as requirements. The Injected defects were major cause for design defects. 6.2.1 Design Revi ew Table 3 lists the number of defects injected independ- ently in Requirements and inherent defects detected after Requirements document review. Further, it lists the de- fect leakage to the child work product (Design) with in- herent defects detected after Design review for each ex- periment. 6.2.2 Design Defect Amplificati on: Techn o l ogy Variant Figure 5 represents the comparison of Amplification Index between the LMS developed on different tech- nologies. The amplification of design defects caused due to the injected requirement defects in LMS is evidenced in all technologies and more prominent in VB Microsoft technology. 6.2.3 Amplification Index (AI) for Requirements Table 3 and Table 4 represent the methodology that was used to calculate Requirement Amplification Index (i.e. impact of requirements defects on Design). 6.2.4 Defects in Design Table 5 lists the various types of known design defects that were introduced after design review. The defects are classified and categorized after causal analysis. Table 3. Defects injected-requirements to design Source SRS Design Injected Inherent Leaked Inherent LMS 1 5 4 4 8 LMS 2 5 8 7 6 LMS 3 5 5 7 9 Table 4. Defects amplification index computation-require- ments to design Application Formula AI (Requirements on Design) LMS1 No. of design defects caused due to injected Requirement Defects / No. of injected Re- quirement defects 2/5 = 0.5 (rounded) One requirement defect leaked causes 0.5 defect in design in C # technology LMS2 No. of design defects caused due to injected Requirement Defects / No. of injected Re- quirement defects 6/5 = 1.3 (rounded) One requirement defect leaked causes 1.3 defect in design in VB technology LMS3 No. of design defects caused due to injected Requirement Defects / No. of injected Re- quirement defects 4/5 = 0.8 (rounded) One requirement defect leaked causes 0.8 defect in design in Java technology Table 5. Definition of defect types – design Action taken Defect Injected Defect severity Defect Type Removed Validation and au- thentication of au- thorized students High Interface, Incomplete Modified Data Type Changed Medium Database, Incorrect Review finding Editing of book type by borrower High Incorrect Modified There is a possibility to add null records when no validations are made or no ex- ceptions are handled. Medium Incorrect Changed A datagrid displays the content only when the recordset is open. Low Database Incorrect 6.2.5 Statistical Analysis and Validation Based on the AI derived from the above requirement data analysis, a statistical study was carried out to understand and analyze the statistical significance and relationship of AI across phases. A hypothesis was formulated based on the conditions of analysis as follows; H0 : Requirements Amplification Index is same across tech- nologies H1 : Requirements Amplification Index is different between technologies Minitab tool was used to analyze the data set of Re- quirement Amplification Index. A simple T-test was run to validate the statistical significance of the requirement AI data across technologies. Minitab output on the Hypothesis Testing is listed in Table 6 below. The statistical rule of elimination is: 1) If the P- Value > 0.05, Then H0 is true and there is no difference in the groups. = Accept H0 2) If the Value < 0.05, Then H0 is false and there is a statistically significant difference. = Reject H0 and Ac- cept H1 Figure 5. Amplification index trend – design Copyright © 2010 SciRes JSEA  Study and Analysis of Defect Amplification Index in Technology Variant Business Application 370 Development through Fault Injection Patterns Table 6. St a tistical analysis co mp utati on One-Sample T: Test of mu = 0 vs mu not = 0 Variable N Mean StDev SE Mean AI 3 0.867 0.404 0.233 Variable 95.0% CI T P AI (–0.137, 1.871) 3.71 0.065 This results in: 0.065 > 0.05; so by the rule, Accept the Ho. To conclude that, “Requirements Amplification Index is same across technologies and there is no statistical significant difference on AI across technologies in the Library Management System (LMS) developed in dif- ferent technologies”. 6.3 Coding Phase Analysis Coding was performed with (fault injected) design as ba- sis. There were several defects observed with “source” as Design and Requirements. The Injected defects were the major cause for Code defects detected in Code revi ew. 6.3.1 Co de Review Table 7 appends to Table 3 with the number of defects injected independently with leaked defected in design document. Further, it lists the defect leakage from Design to Code with inherent defects detected after Code review for each experiment. 6.3.2 Co de Defect Amp l ification: Technology Variant Figure 6 represents the comparison of Amplification In- dex between the LMS developed on different technolo- gies. The amplification of coding defects caused due to the injected design defects in LMS is evidenced in all tech- nologies and more prominent in VB M icrosoft technology . 6.3.3 Amplification Index for Design Table 8 illustrates the methodology and computation details used to calculate Design Amplification Index (i.e. impact of Des ign defe cts on Code). A I Tr end - Technology W i se 0.9 1.9 1. 6 0.0 0.2 0.4 0.6 0.8 1.0 1.2 1.4 1.6 1.8 2.0 LMS 1LMS 2LMS 3 Coding Pha se - Technology AI Figure 6. Amplification index trend-coding Table 7. Defects injected-design to code Source SRS Design Code Injected Inherent Leaked + In- jected Inherent Leaked Inherent LMS 1 5 4 4 + 5 8 7 7 LMS 2 5 8 7 + 5 6 9 6 LMS 3 5 5 7 + 5 9 10 6 6.3.4 Statistical Analysis and Validation Similarly, based on the AI derived from the above design data analysis, a statistical study was carried out to under- stand and analyze the statistical significance and rela- tionship of AI acros s desi g n p hases. A hypothesis was formulated based on the conditions of analysis as follows; H0 : Design Amplification Index is same across technologies H1 : Design Amplification Index is different between technologies Minitab tool was used to analyze the data set of design Amplification Index. A simple T-test was run to validate the statistical significance of the design AI data across technologies. Minitab output on the Hypothesis Testing is listed in Table 9 below. The statistical rule of elimination is: 1) If the P- Value > 0.05, Then H0 is true and there is no difference in the groups. = Accept H0 2) If the Value < 0.05, Then Ho is false and there is a statistically significant difference. = Reject H0 and Ac- cept H1 This results in: 0.038 < 0.05; so by the rule, Reject H0 and Accept H1. To conclude that, “Design Amplification Index is dif- ferent across technologies and there is a statistical sig- nificant difference on design AI across technologies in Table 8. Defects amplification index computation-design to code ApplicationFormula AI (Design on Code) LMS1 No. of Code defects caused due to injected Design Defects / No. of injected Design defects 4.9/5 = 0.9 (rounded) One design defect leaked causes 0.9 defect in code in C # technology LMS2 No. of Code defects caused due to injected Design Defects / No. of injected Design defects 9/5 = 1.9 (rounded) One design defect leaked causes 1.9 defect in code in VB technology LMS3 No. of Code defects caused due to injected Design Defects / No. of injected Design defects 8/5 = 1.6 (rounded) One design defect leaked causes 1.6 defect in code in Java technology Copyright © 2010 SciRes JSEA  Study and Analysis of Defect Amplification Index in Technology Variant Business Application 371 Development through Fault Injection Patterns Table 9. Statistical analysis computation One-Sample T: Test of mu = 0 vs mu not = 0 Variable N Mean StDev SE Mean AI 3 1.467 0.513 0.296 Variable 95.0% CI T P AI (0.192, 2.741) 4.95 0.038 the Library Management System (LMS) developed in different technologies”. 6.4 Testing Phase Analysis Testing was performed with (fault injected) code as basis. There were several defects observed with “source” as Coding, Design and Requirements. The injected defects were the major cause for Code defects detected i n Testing. 6.4.1 Testing Table 10 appends to Table 7 with the number of defects injected independently with leaked defected in Code. Further, it lists the defect leakage from Code to Test Cases with inherent defects detected after Test Case re- view for each experiment. 6.4.2 Test Defect Amplification: Technology Variant Figure 7 represents the comparison of Amplification In- dex between the LMS developed on different technologies. The amplification of test defects caused due to the injected code defects in LMS is evidenced in all technologies and more prominent i n VB Microsoft t echnology . 6.4.3 Amplification Index for Code Table 11 illustrates the methodology and computation details used to calculate Test Amplification Index (i.e. impact of Code defects on Test results). 6.4.4 Statistical Analysis and Validation Similarly, based on the AI derived from the above code data analysis, a statistical study was carried out to under- stand and analyze the statistical significance and rela- tionship of AI across test phase. Table 10. Defects injected-code to test Source Design Code Testing Leaked + Injected Inher- ent Leaked + Injected Inher- ent Leaked Inher- ent LMS1 4 + 5 8 7 + 5 7 9 0 LMS2 7 + 5 6 9 + 5 6 14 4 LMS3 7 + 5 9 10 + 5 6 15 2 Table 11. Defects amplification index computation-code to test Application Formula AI (Code on Test results) LMS1 No. of Test results de- fects caused due to in- jected Code Defects / No. of injected Code defects 9/5 = 1.9 (rounded) One code defect leaked causes 1.9 defect in test results in C # technology LMS2 No. of Test results de- fects caused due to in- jected Code Defects / No. of injected Code defects 11/5 = 2.1 (rounded) One code defect leaked causes 2.1 defect in test results in VB technology LMS3 No. of Test results de- fects caused due to in- jected Code Defects / No. of injected Code defects 7/5 = 1.5 (rounded) One code defect leaked causes 1.5 defect in test results in Java technology A hypothesis was formulated based on the conditions of analysis as follows; Ho : Code Amplifica t i on Index is same across technologies H1 : Code Amplifi cation Index is differ ent between te chnologies Minitab tool was used to analyze the data set of Code Amplification Index. A simple T-test was run to validate the statistical significance of the code AI data across technologies. Minitab output on the Hypothesis Testing is listed in Table 12 below. The statistical rule of elimination is: 1) If the P- Value > 0.05, Then Ho is true and there is no difference in the groups. = Accept Ho 2) If the Value < 0.05, Then Ho is false and there is a statistically significant difference. = Reject Ho and Ac- cept H1 This results in: 0.009 < 0.05; so by the rule, Reject Ho and Accept H1. To conclude that, “Code Amplification Index is dif- ferent across technologies and there is a statistical sig- nificant difference on design AI across technologies in the LiBrary Management System (LMS) developed in different technologies”. AI Tre nd - Technology Wise 1.9 2.1 1.5 0.0 0.5 1.0 1.5 2.0 2.5 LMS 1LMS 2LMS 3 Testing Phase - Technology AI Figure 7. Amplification index trend-testing Copyright © 2010 SciRes JSEA  Study and Analysis of Defect Amplification Index in Technology Variant Business Application 372 Development through Fault Injection Patterns Table 12. Statistical analysis computation One-Sample T: Test of mu = 0 vs mu not = 0 Variable N Mean StDev SE Mean AI 3 1.833 0.306 0.176 Variable 95.0% CI T P AI ( 1.074, 2.592) 10.39 0.009 7. Conclusions AI Trend Anal y sis The Amplification Index indicates the extent of dam- age caused by a defect in various phases of the project. The index increases with every step in the life cycle of the project. This is evident in th e case of Microsoft tech- nologies (VB and C#.net) but AI in the case of open source technologies such Java, the AI increases in re- quirements and design but in code, it is found have mar- ginal decrease compared to other technologies. It is also seen that defects amplification in the VB Technology show substantial increase in the amplification index across phases compared to other selected technologies. The relative growth of AI across phases in Java tech- nology is less compared to Microsoft technology. This indicates a better fault tolerance for Java technology. It was concluded and validated statistically that; Requirement defects amplification index across on identified technologies remains are same. Design and Code defects amplification index across on technologies vary based on technologies for the common application developed in the same domain. Figure 8 illustrates the consolidated Amplification Index trend across technologies classified under each phase of SD LC; The defect leakage analysis emphasizes the impor- tance of thorough and systematic reviews in the early stages of a software project with an emphasis on defect prevention. The analysis indicates a high increase of cost and effort to remove the defects at later stages. The number of defects increases exponentially as a direct result of defects leaked from previous stages. Figure 9 consolidated the defect leakage pattern across technologies distributed each SDLC phase. 8. Future Experiments Currently, the study is being extended to analyze the ef- fect of the defects and amplification index in the devel- opment phases of the different domain based projects developed with same technology. Guidelines for review time and effort estimation are being computed by analyzing and defining the review and test stop criteria. Error seeding during testing can be A I Tr e nd - Te chnology W ise 0.8 1.6 1.5 1.3 1.9 2.1 0.5 0.9 1.9 0.0 0.5 1.0 1.5 2.0 2.5 ReqDesign Coding Phases AI Java VB C#.Net Figure 8. Amplification index trend – technology wise Figure 9. Defect leakage carried out to define the test stop criteria. 9. Limitations of Experiments The following are the limitations of the experiments: Causal analysis is relatively subjectiv e to understand the cause of amplified defect. This required detailed review and discussion with project team and techni- cal/technology experts. Defect removal efficiency percentage used for ex- periments in different technologies are based on a test in a sample requirement, design and code with known defects provided to project members and re- view efficiency percentage derived from the defects detected. It is verified that the skill set of the analysts and programmers working in the projects are same and/or similar across technologies. The experiments do not consider specialized auto- mated tools and techniques used in the development of software work products which could have impact of the work product output quality. REFERENCES [1] A. Hall, “Seven Myths of Formal Methods,” IEEE Soft- ware, September 1990, pp. 11-19. [2] C. B. Jones, “Systematic Software Development Using VDM,” Prentice-Hall International, London, 1986. Copyright © 2010 SciRes JSEA  Study and Analysis of Defect Amplification Index in Technology Variant Business Application Development throug h Fault Injection Patterns Copyright © 2010 SciRes JSEA 373 [3] S. J. Garland, J. V. Guttag and J. J. Horning. “Debugging Larch Shared Language Specifications,” IEEE Transac- tions on Software Engineering, September 1990, pp. 1044-1057. [4] W. Howden, “A Functional Approach to Program Testing and Analysis,” IEEE Transactions on Software Engi- neering, October 1986, pp. 997-1005. [5] L. J. White, “Basic mathematical Definitions and Results in Testing,” In: B. Chandrasekaran and S. Radicchi, Ed., Computer Program Testing, North-Holland, 1981, pp. 13-24. [6] R. DeMillo, R. Lipton and A. Perlis, “Social Processes and Proofs of Theorems and Programs,” Communications of the ACM, May 1979, pp. 803-820. [7] B. W. Johnson, “Design and Analysis of Fault-Tolerant Digital Systems,” Addison-Wesley, Massachusetts, 1989. [8] D. Dreilinger and L. J. Lin, “Using Fault Injection to Test Software Recovery Code,” November 1995. [9] N. G. M. Leme, E. Martins and C. M. F. Rubira, “A Software Fault Injection Pattern System,” Proceedings of the 9th Brazilian Symposium on Fault-Tolerant Comput- ing, Florianópolis, 5-7 March 2001, pp. 99-113. |