Paper Menu >>
Journal Menu >>
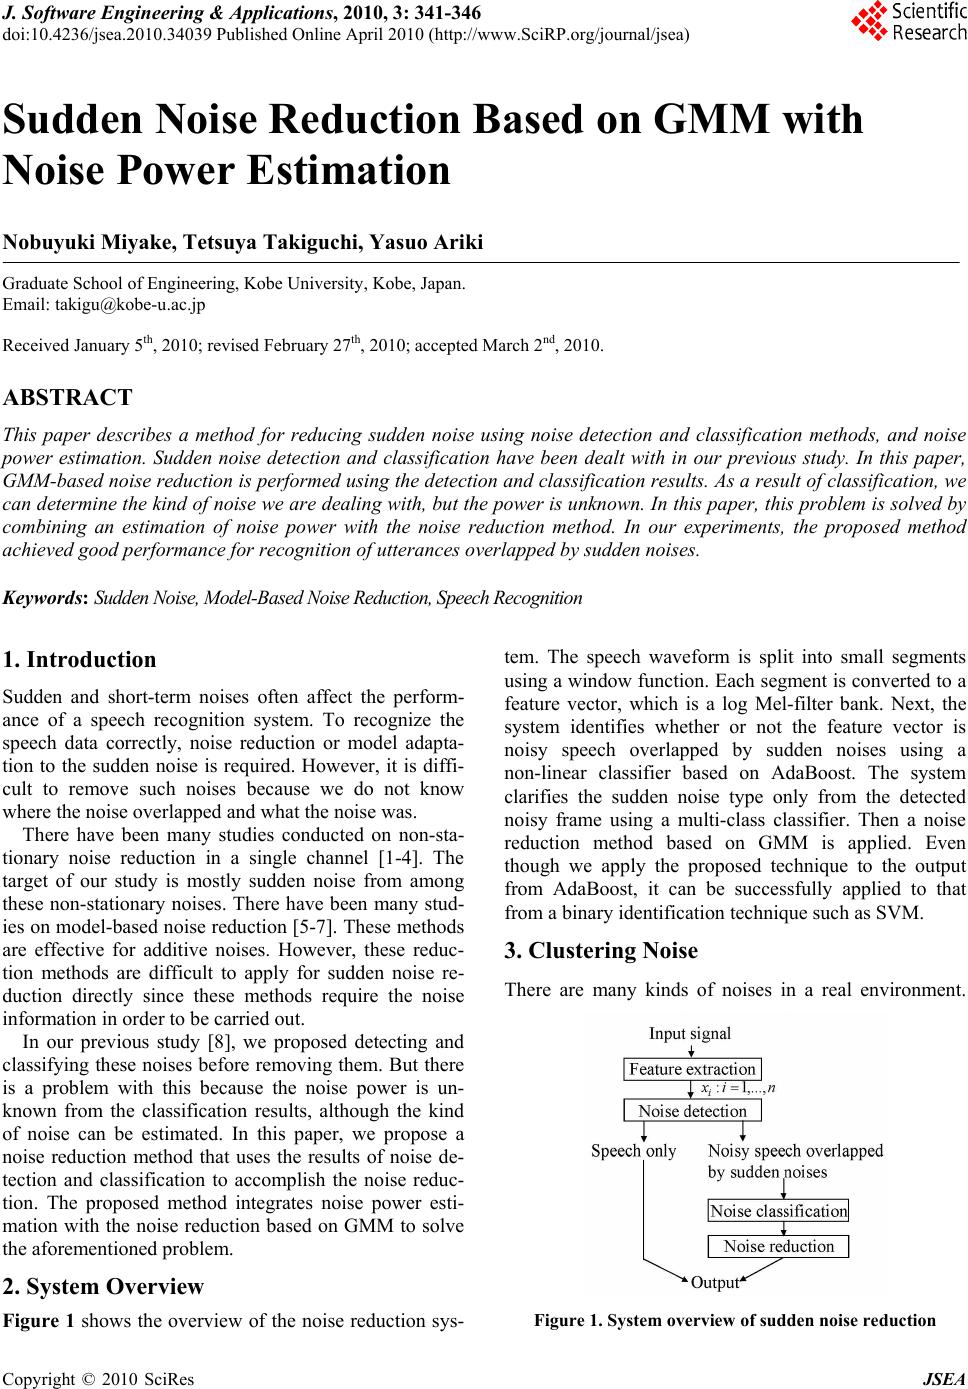 J. Software Engineering & Applications, 2010, 3: 341-346 doi:10.4236/jsea.2010.34039 Published Online April 2010 (http://www.SciRP.org/journal/jsea) Copyright © 2010 SciRes JSEA 341 Sudden Noise Reduction Based on GMM with Noise Power Estimation Nobuyuki Miyake, Tetsuya Takiguchi, Yasuo Ariki Graduate School of Engineering, Kobe University, Kobe, Japan. Email: takigu@kobe-u.ac.jp Received January 5th, 2010; revised February 27th, 2010; accepted March 2nd, 2010. ABSTRACT This paper describes a method for reducing sudden noise using noise detection and classification methods, and noise power estimation. Sudden noise detection and classification have been dealt with in our previous study. In this paper, GMM-based noise reduction is performed using the de tection and classification resu lts. As a result of cla ssification, we can determine the kind of noise we a re dealing with, but the power is unknown. In this pap er, this problem is solved by combining an estimation of noise power with the noise reduction method. In our experiments, the proposed method achieved good perf or mance for recogniti on o f utt e ra nces overlapped by sudden noises. Keywords: Sudden Noise, Model-Based Noise Reduction, Speech Recognit ion 1. Introduction Sudden and short-term noises often affect the perform- ance of a speech recognition system. To recognize the speech data correctly, noise reduction or model adapta- tion to the sudden noise is required. However, it is diffi- cult to remove such noises because we do not know where the noise overlapped and what the noise was. There have been many studies conducted on non-sta- tionary noise reduction in a single channel [1-4]. The target of our study is mostly sudden noise from among these non-stationary noises. There have been many stud- ies on model-based noise reduction [5-7]. These methods are effective for additive noises. However, these reduc- tion methods are difficult to apply for sudden noise re- duction directly since these methods require the noise information in order to be carried out. In our previous study [8], we proposed detecting and classifying these noises before removing them. But there is a problem with this because the noise power is un- known from the classification results, although the kind of noise can be estimated. In this paper, we propose a noise reduction method that uses the results of noise de- tection and classification to accomplish the noise reduc- tion. The proposed method integrates noise power esti- mation with the noise reduction based on GMM to solve the aforementioned problem. 2. System Overview Figure 1 shows the overview of the noise reduction sys- tem. The speech waveform is split into small segments using a window function. Each segment is converted to a feature vector, which is a log Mel-filter bank. Next, the system identifies whether or not the feature vector is noisy speech overlapped by sudden noises using a non-linear classifier based on AdaBoost. The system clarifies the sudden noise type only from the detected noisy frame using a multi-class classifier. Then a noise reduction method based on GMM is applied. Even though we apply the proposed technique to the output from AdaBoost, it can be successfully applied to that from a binary identification technique such as SVM. 3. Clustering Noise There are many kinds of noises in a real environment. Figure 1. System overview of sudden noise r eduction 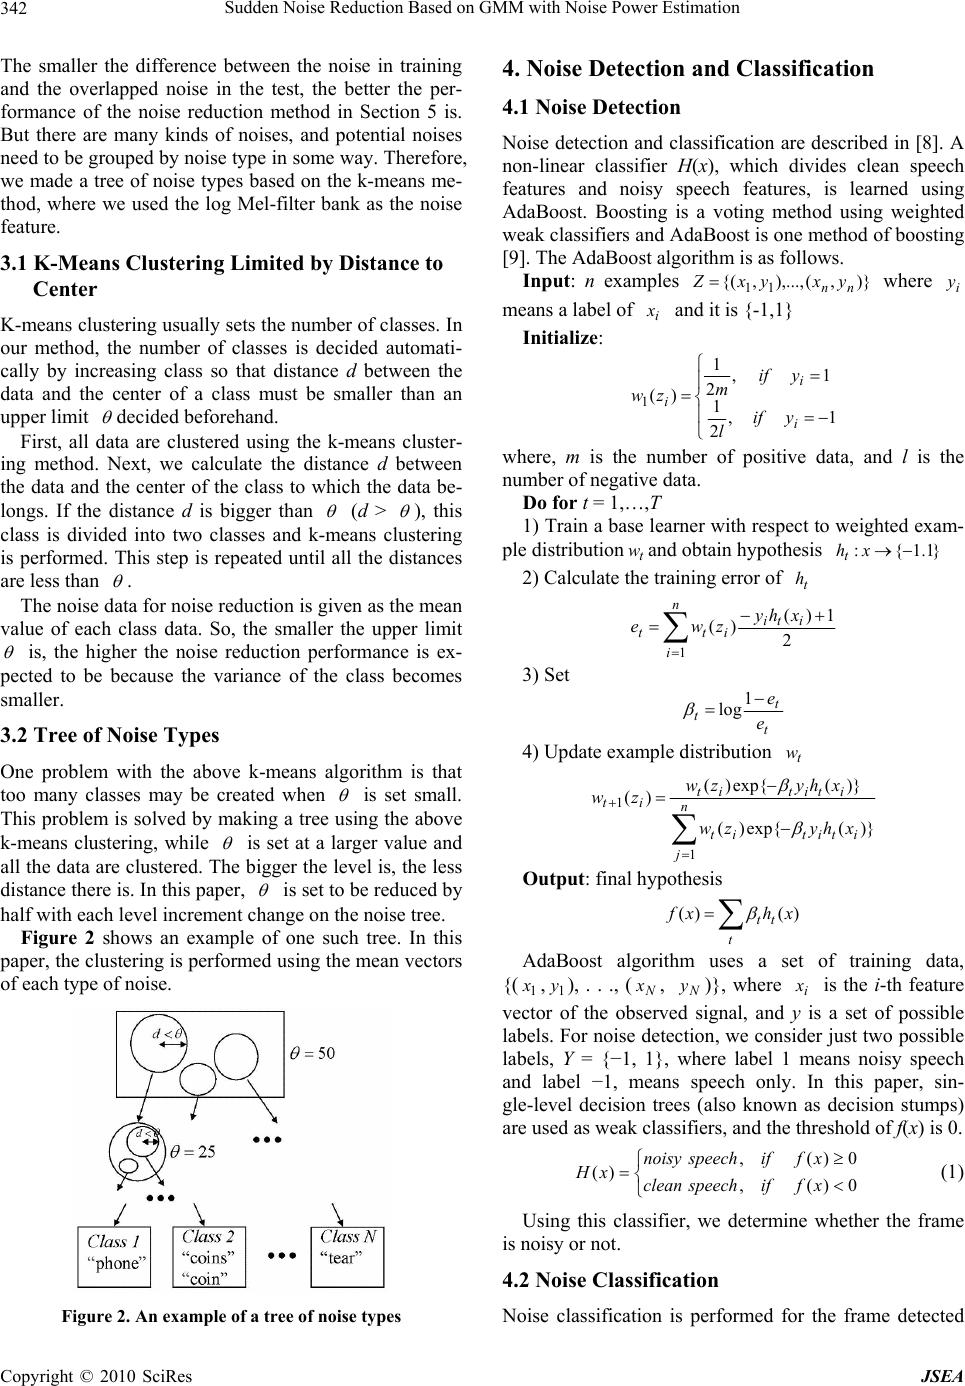 Sudden Noise Reduction Based on GMM with Noise Power Estimation 342 The smaller the difference between the noise in training and the overlapped noise in the test, the better the per- formance of the noise reduction method in Section 5 is. But there are many kinds of noises, and potential noises need to be grouped by noise type in some way. Therefore, we made a tree of noise types based on the k-means me- thod, where we used the log Mel-filter bank as the noise feature. 3.1 K-Means Clustering Limited by Distance to Center K-means clustering usually sets the number of classes. In our method, the number of classes is decided automati- cally by increasing class so that distance d between the data and the center of a class must be smaller than an upper limit decided beforehand. First, all data are clustered using the k-means cluster- ing method. Next, we calculate the distance d between the data and the center of the class to which the data be- longs. If the distance d is bigger than (d > ), this class is divided into two classes and k-means clustering is performed. This step is repeated until all the distances are less than . The noise data for noise reduction is given as the mean value of each class data. So, the smaller the upper limit is, the higher the noise reduction performance is ex- pected to be because the variance of the class becomes smaller. 3.2 Tree of Noise Types One problem with the above k-means algorithm is that too many classes may be created when is set small. This problem is solved by making a tree using the above k-means clustering, while is set at a larger value and all the data are clustered. The bigger the level is, the less distance there is. In this paper, is set to be reduced by half with each level increment change on the noise tree. Figure 2 shows an example of one such tree. In this paper, the clustering is performed using the mean vectors of each type of noise. Figure 2. An example of a tree of noise types 4. Noise Detection and Classification 4.1 Noise Detection Noise detection and classification are described in [8]. A non-linear classifier H(x), which divides clean speech features and noisy speech features, is learned using AdaBoost. Boosting is a voting method using weighted weak classifiers and AdaBoost is one method of boosting [9]. The AdaBoost algorithm is as follows. Input: n examples where means a label of and it is {-1,1} )},(),...,,{( 11nn yxyxZi y i x Initialize: 1, 2 1 1, 2 1 )( 1 i i iyif l yif m zw where, m is the number of positive data, and l is the number of negative data. Do for t = 1,…,T 1) Train a base learner with respect to weighted exam- ple distributionand obtain hypothesis t w}1.1{: xht 2) Calculate the training error of t h n i iti itt xhy zwe 12 1)( )( 3) Set t t te e 1 log 4) Update example distribution t w n j ititit ititit it xhyzw xhyzw zw 1 1 )}(exp{)( )}(exp{)( )( Output: final hypothesis t tt xhxf)()( AdaBoost algorithm uses a set of training data, {( ,), . . ., (, )}, where is the i-th feature vector of the observed signal, and y is a set of possible labels. For noise detection, we consider just two possible labels, Y = {−1, 1}, where label 1 means noisy speech and label −1, means speech only. In this paper, sin- gle-level decision trees (also known as decision stumps) are used as weak classifiers, and the threshold of f(x) is 0. 1 x1 yN xN yi x 0)(, 0)(, )( xfifspeechclean xfifspeechnoisy xH (1) Using this classifier, we determine whether the frame is noisy or not. 4.2 Noise Classification Noise classification is performed for the frame detected Copyright © 2010 SciRes JSEA 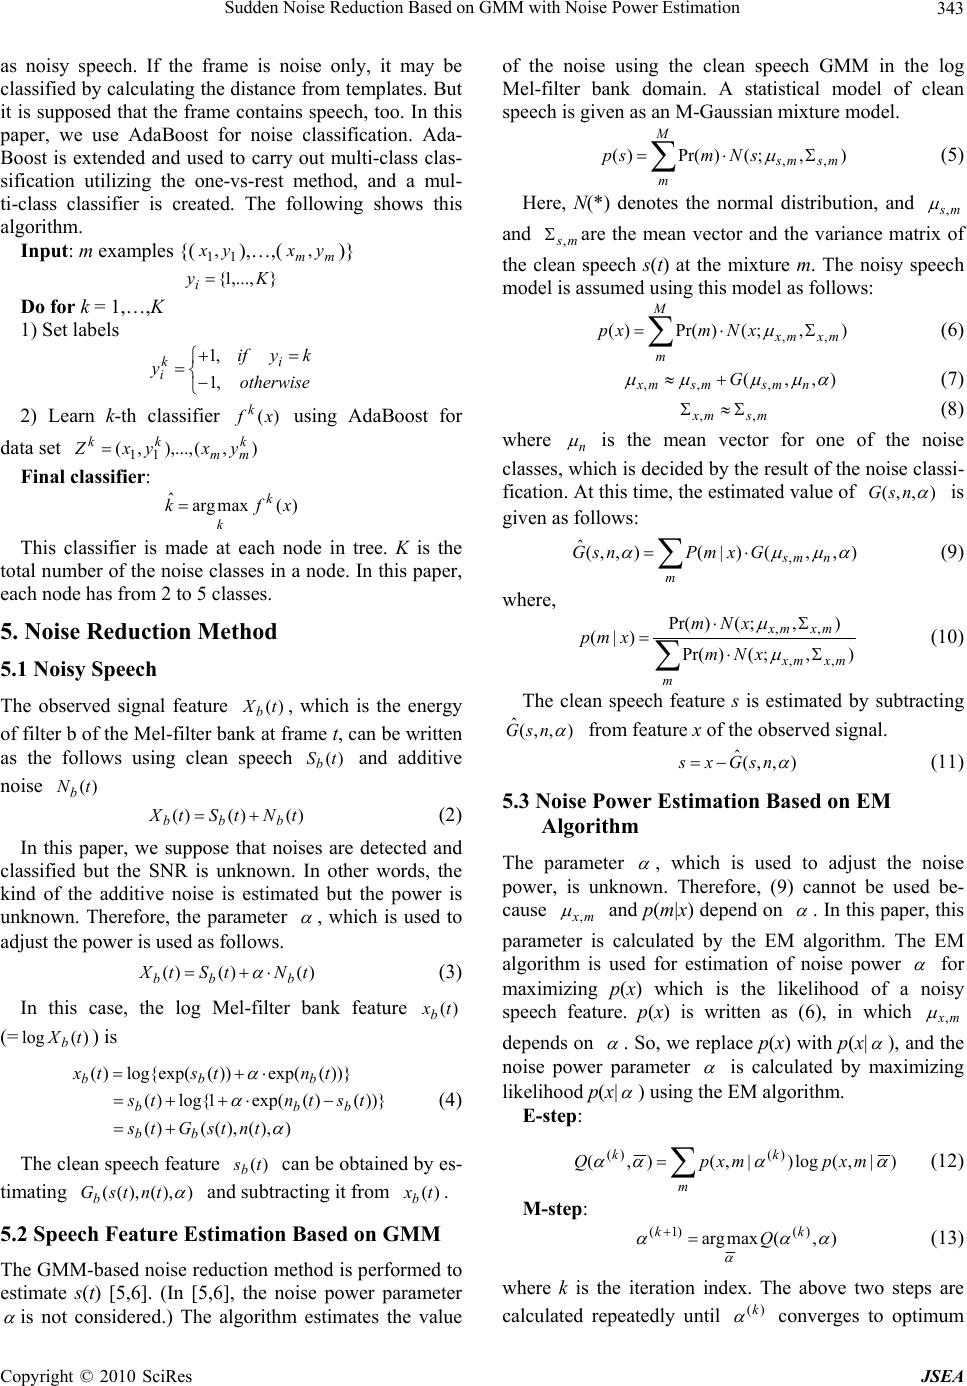 Sudden Noise Reduction Based on GMM with Noise Power Estimation343 as noisy speech. If the frame is noise only, it may be classified by calculating the distance from templates. But it is supposed that the frame contains speech, too. In this paper, we use AdaBoost for noise classification. Ada- Boost is extended and used to carry out multi-class clas- sification utilizing the one-vs-rest method, and a mul- ti-class classifier is created. The following shows this algorithm. Input: m examples {(),…,( )} 11,yx mm yx, },...,1{Kyi Do for k = 1,…,K 1) Set labels otherwise kyif yi k i,1 ,1 2) Learn k-th classifier using AdaBoost for data set )(xf k ), k m y(),...,,(11m kk xyxZ Final classifier: )(maxarg ˆxfk k k This classifier is made at each node in tree. K is the total number of the noise classes in a node. In this paper, each node has from 2 to 5 classes. 5. Noise Reduction Method 5.1 Noisy Speech The observed signal feature , which is the energy of filter b of the Mel-filter bank at frame t, can be written as the follows using clean speech and additive noise )(tXb )(tSb )(tNb )()()( tNtStX bbb (2) In this paper, we suppose that noises are detected and classified but the SNR is unknown. In other words, the kind of the additive noise is estimated but the power is unknown. Therefore, the parameter , which is used to adjust the power is used as follows. )()()(tNtStX bbb (3) In this case, the log Mel-filter bank feature (= ) is )(txb )(log tXb )),(),(()( ))}()(exp(1log{)( ))}(exp())(log{exp()( tntsGts tstnts tntstx bb bbb bbb (4) The clean speech feature can be obtained by es- timating )(tsb )),(),(( tntsGb and subtracting it from . )(txb 5.2 Speech Feature Estimation Based on GMM The GMM-based noise reduction method is performed to estimate s(t) [5,6]. (In [5,6], the noise power parameter is not considered.) The algorithm estimates the value of the noise using the clean speech GMM in the log Mel-filter bank domain. A statistical model of clean speech is given as an M-Gaussian mixture model. M m msms sNmsp),;()Pr()( ,, (5) Here, N(*) denotes the normal distribution, and ms, and ms, are the mean vector and the variance matrix of the clean speech s(t) at the mixture m. The noisy speech model is assumed using this model as follows: M m mxmx xNmxp ),;()Pr()( ,, (6) ),,( ,,, nmsmsmx G (7) msmx ,, (8) where n is the mean vector for one of the noise classes, which is decided by the result of the noise classi- fication. At this time, the estimated v),,( alue of nsG is given as follows: m nms GxmPnsG ),,()|(),,( ˆ, (9) where, m mxmx mxmx xNm xNm xmp ),;()Pr( ),;()Pr( )|( ,, ,, (10) The clean speech feature s is estimated by subtracting from feature x of the observed signal. ),,( ˆ nsG ),,( ˆ nsGxs (11) 5.3 Noise Power Estimation Based on EM Algorithm The parameter , which is used to adjust the noise power, is unknown. Therefore, (9) cannot be used be- cause mx, and p(m|x) depend on . In this paper, this parameter is calculated by the EM algorithm. The EM algorithm is used for estimation of noise power for maximizing p(x) which is the likelihood of a noisy speech feature. p(x) is written as (6), in which mx, depends on . So, we replace p(x) with p(x| ), and the noise power parameter is calculated by maximizing likelihood p(x| ) using the EM algorithm. E-step: m kk mxpmxpQ )|,(log)|,(),( )()( (12) M-step: ),(maxarg)()1( kk Q (13) where k is the iteration index. The above two steps are calculated repeatedly until converges to optimum )( k Copyright © 2010 SciRes JSEA 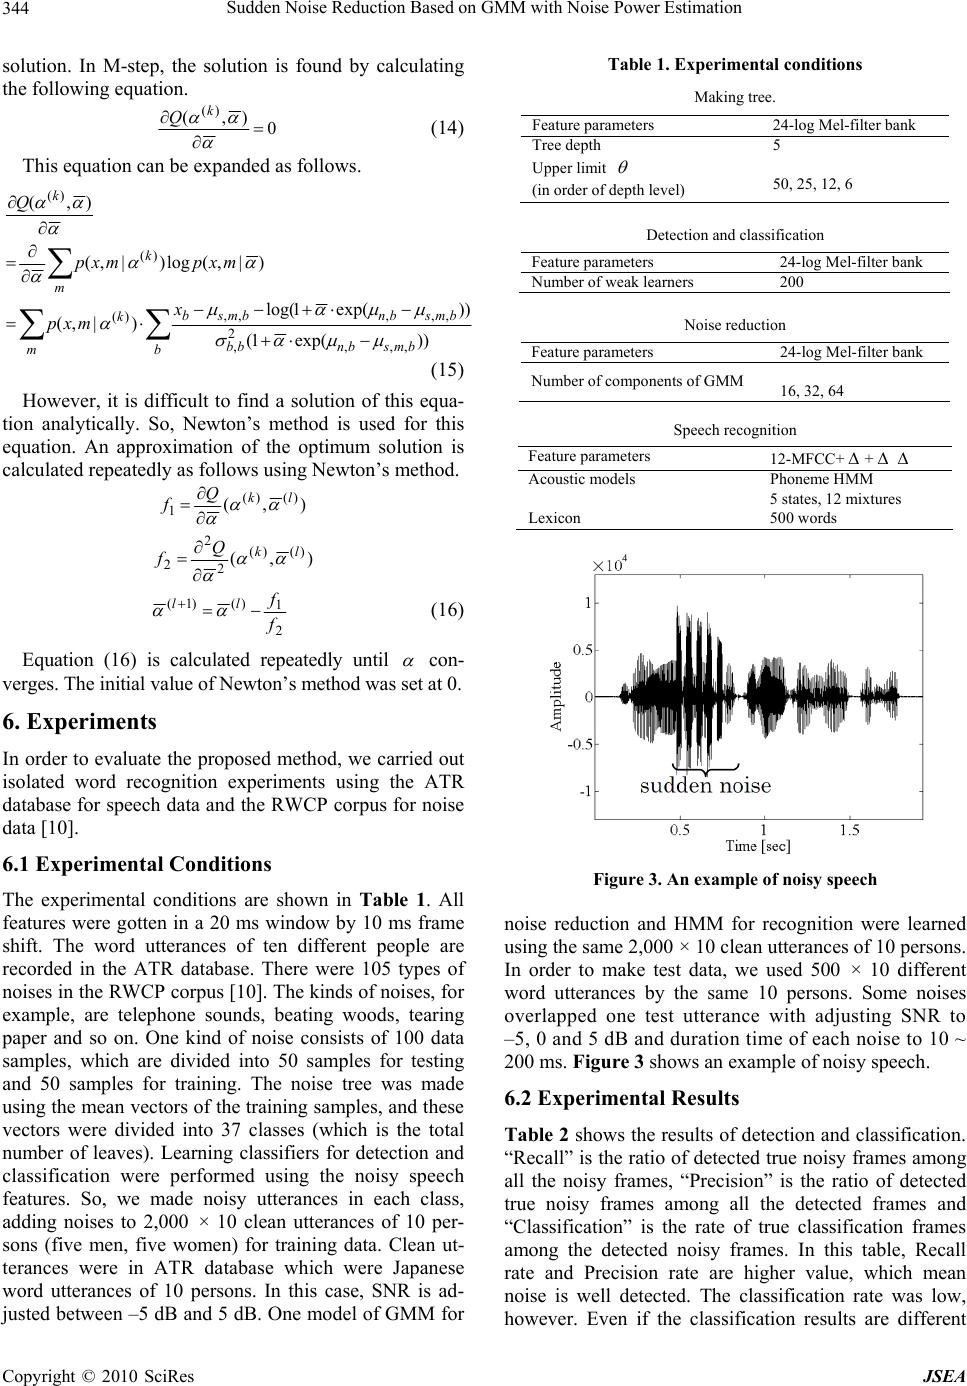 Sudden Noise Reduction Based on GMM with Noise Power Estimation 344 solution. In M-step, the solution is found by calculating the following equation. 0 ),( )( k Q (14) This equation can be expanded as follows. bbmsbnbb bmsbnbmsb m k m k k x mxp mxpmxp Q ))exp(1( ))exp(1log( )|,( )|,(log)|,( ),( ,,, 2 , ,,,,, )( )( )( (15) However, it is difficult to find a solution of this equa- tion analytically. So, Newton’s method is used for this equation. An approximation of the optimum solution is calculated repeatedly as follows using Newton’s method. ),()()( 1lk Q f ),( )()( 2 2 2lk Q f 2 1 )()1( f f ll (16) Equation (16) is calculated repeatedly until con- verges. The initial value of Newton’s method was set at 0. 6. Experiments In order to evaluate the proposed method, we carried out isolated word recognition experiments using the ATR database for speech data and the RWCP corpus for noise data [10]. 6.1 Experimental Conditions The experimental conditions are shown in Table 1. All features were gotten in a 20 ms window by 10 ms frame shift. The word utterances of ten different people are recorded in the ATR database. There were 105 types of noises in the RWCP corpus [10]. The kinds of noises, for example, are telephone sounds, beating woods, tearing paper and so on. One kind of noise consists of 100 data samples, which are divided into 50 samples for testing and 50 samples for training. The noise tree was made using the mean vectors of the training samples, and these vectors were divided into 37 classes (which is the total number of leaves). Learning classifiers for detection and classification were performed using the noisy speech features. So, we made noisy utterances in each class, adding noises to 2,000 × 10 clean utterances of 10 per- sons (five men, five women) for training data. Clean ut- terances were in ATR database which were Japanese word utterances of 10 persons. In this case, SNR is ad- justed between –5 dB and 5 dB. One model of GMM for Table 1. Experimental conditions Making tree. Feature parameters 24-log Mel-filter bank Tree depth 5 Upper limit (in order of depth level) 50, 25, 12, 6 Detection and classification Feature parameters 24-log Mel-filter bank Number of weak learners 200 Noise reduction Feature parameters 24-log Mel-filter bank Number of components of GMM 16, 32, 64 Speech recognition Feature parameters 12-MFCC+ + Acoustic models Phoneme HMM 5 states, 12 mixtures Lexicon 500 words × Figure 3. An example of noisy speech noise reduction and HMM for recognition were learned using the same 2,000 × 10 clean utterances of 10 persons. In order to make test data, we used 500 × 10 different word utterances by the same 10 persons. Some noises overlapped one test utterance with adjusting SNR to –5, 0 and 5 dB and duration time of each noise to 10 ~ 200 ms. Figure 3 shows an example of noisy speech. 6.2 Experimental Results Table 2 shows the results of detection and classification. “Recall” is the ratio of detected true noisy frames among all the noisy frames, “Precision” is the ratio of detected true noisy frames among all the detected frames and “Classification” is the rate of true classification frames among the detected noisy frames. In this table, Recall rate and Precision rate are higher value, which mean noise is well detected. The classification rate was low, however. Even if the classification results are different Copyright © 2010 SciRes JSEA 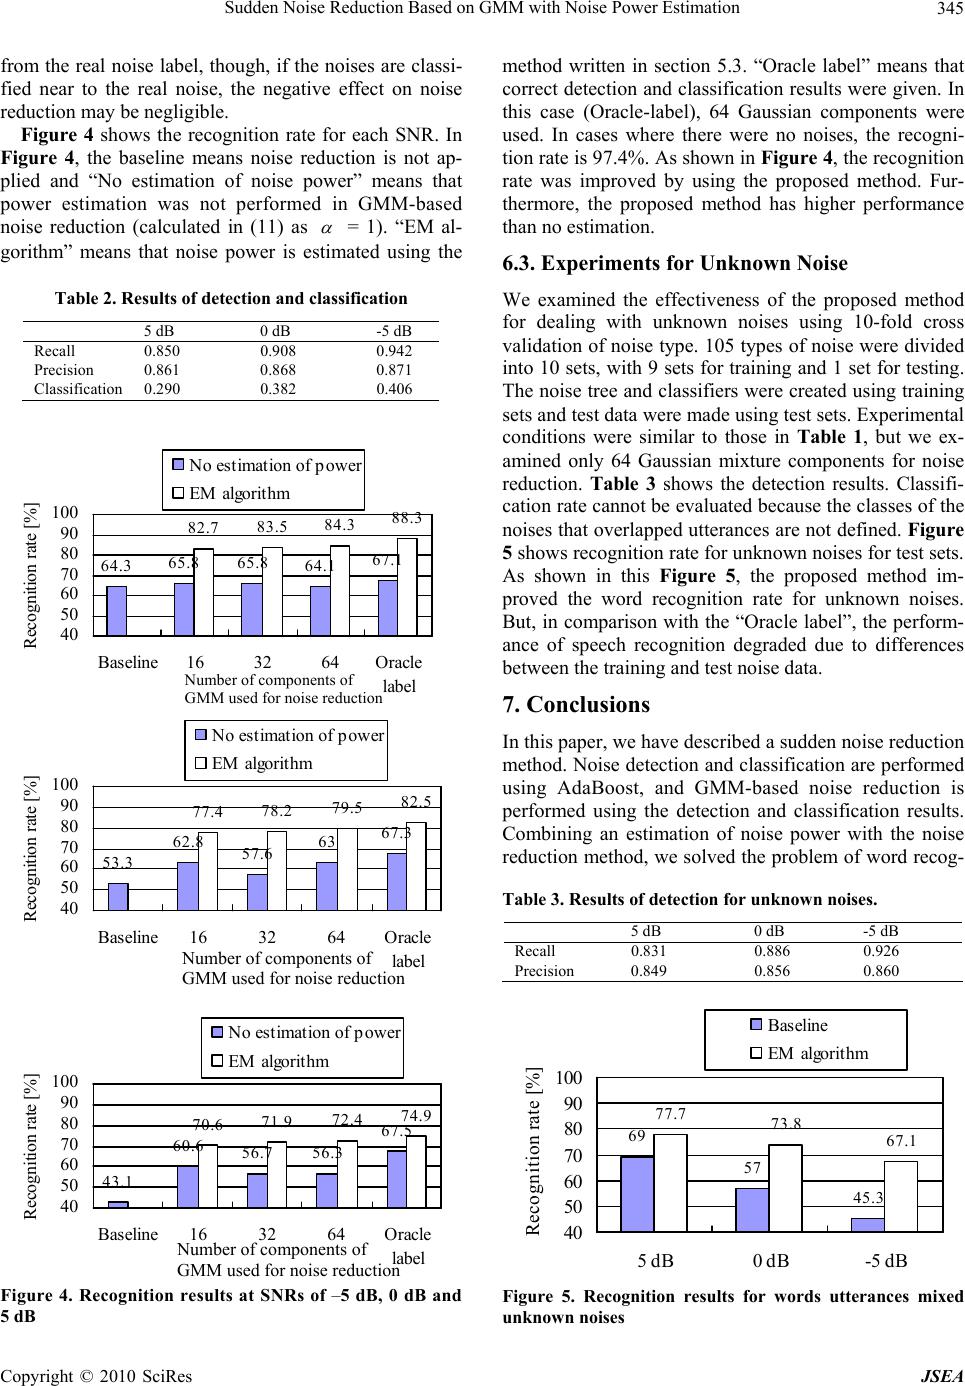 Sudden Noise Reduction Based on GMM with Noise Power Estimation345 from the real noise label, though, if the noises are classi- fied near to the real noise, the negative effect on noise reduction may be negligible. Figure 4 shows the recognition rate for each SNR. In Figure 4, the baseline means noise reduction is not ap- plied and “No estimation of noise power” means that power estimation was not performed in GMM-based noise reduction (calculated in (11) as = 1). “EM al- gorithm” means that noise power is estimated using the Table 2. Results of detection and classification 5 dB 0 dB -5 dB Recall 0.850 0.908 0.942 Precision 0.861 0.868 0.871 Classification 0.290 0.382 0.406 64.3 65.865.8 64.1 67.1 82.7 83.5 84.3 88.3 40 50 60 70 80 90 100 Baseline163264Oracle label Recognition rate [%] No estimation of power EM algorithm 53.3 62.8 57.6 63 67.3 77.478.2 79.5 82.5 40 50 60 70 80 90 100 Baseline163264Oracle label Recognition rate [%] No estimation of power EM algorithm 43.1 60.6 56.7 56.3 67.5 70.671.9 72.4 74.9 40 50 60 70 80 90 100 Baseline163264Oracle label Recognition rate [%] No estimation of power EM algorithm Figure 4. Recognition results at SNRs of –5 dB, 0 dB and 5 dB method written in section 5.3. “Oracle label” means that correct detection and classification results were given. In this case (Oracle-label), 64 Gaussian components were used. In cases where there were no noises, the recogni- tion rate is 97.4%. As shown in Figure 4, the recognition rate was improved by using the proposed method. Fur- thermore, the proposed method has higher performance than no estimation. 6.3. Experiments for Unknown Noise We examined the effectiveness of the proposed method for dealing with unknown noises using 10-fold cross validation of noise type. 105 types of noise were divided into 10 sets, with 9 sets for training and 1 set for testing. The noise tree and classifiers were created using training sets and test data were made using test sets. Experimental conditions were similar to those in Table 1, but we ex- amined only 64 Gaussian mixture components for noise reduction. Table 3 shows the detection results. Classifi- cation rate cannot be evaluated because the classes of the noises that overlapped utterances are not defined. Figure 5 shows recognition rate for unknown noises for test sets. As shown in this Figure 5, the proposed method im- proved the word recognition rate for unknown noises. But, in comparison with the “Oracle label”, the perform- ance of speech recognition degraded due to differences between the training and test noise data. Number of components of GMM used for noise reduction 7. Conclusions In this paper, we have described a sudden noise reduction method. Noise detection and classification are performed using AdaBoost, and GMM-based noise reduction is performed using the detection and classification results. Combining an estimation of noise power with the noise reduction method, we solved the problem of word recog- Table 3. Results of detection for unknown noises. 5 dB 0 dB -5 dB Recall 0.831 0.886 0.926 Precision 0.849 0.856 0.860 Number of components of GMM used for noise reduction 69 57 45.3 77.7 73.8 67.1 40 50 60 70 80 90 100 5 dB0 dB-5 dB Recognition rate [%] Baseline EM algorithm Figure 5. Recognition results for words utterances mixed unknown noises Number of components of GMM used for noise reduction Copyright © 2010 SciRes JSEA  Sudden Noise Reduction Based on GMM with Noise Power Estimation Copyright © 2010 SciRes JSEA 346 nition when that noise power was unknown. Our pro- posed method improved the word recognition rate, al- though admittedly, the classification accuracy was not high. Furthermore, although this method was effective for unknown noises, it will need combination of a noise adaptation, tracking technique and so on. In future re- search, we will attempt to verify effectiveness of this new method in dealing with sudden noise when a large vocabulary is used. REFERENCES [1] M. Fujimoto, et al., “Particle Filter Based Non-Stationary Noise Tracking for Robust Speech Recognition,” Proceedings of International Conference on Acoustics, Speech, and Signal Processing (ICASSP), 2005, pp. 257-260. [2] M. Kotta, et al., “Speech Enhancement in Non-Stationary Noise Environments Using Noise Properties,” Speech Communication, Vol. 48, No. 11, 2006, pp. 96-109. [3] T. Jitsuhiro, et al., “Robust Speech Recognition Using Noise Suppression Based on Multiple Composite Models and Multi-Pass Search,” Proceedings of Automatic Speech Recognition and Understanding (ASRU), 2007, pp. 53-58. [4] T. Hirai, S. Kuroiwa, S. Tsuge, F. Ren, M. A. Fattah, “A Speech Emphasis Method for Noise-Robust Speech Recognition by Using Repetitive Phrase,” Proceedings of International Conference on Chemical Thermodynamics (ICCT), 2006, pp. 1-4. [5] P. J. Moreno, B. Raj and R. M. Stern, “A Vector Taylor Series Approach for Environment Independent Speech Recognition,” Proceedings of International Conference on Acoustics, Speech, and Signal Processing (ICASSP), 1996, pp. 733-736. [6] J. C. Segura, et al., “Model-Based Compensation of the Additive Noise for Continuous Speech Recognition. Experiments Using the AURORA II Database and Tasks,” Proceedings of Eurospeech, 2001, pp. 221-224. [7] L. Deng, et al., “Enhancement of Log Mel Power Spectra of Speech Using a Phase-Sensitive Model of the Acoustic Environment and Sequential Estimation of the Corrupting Noise,” IEEE Transactions on Speech and Audio Pro- cessing, Vol. 12, 2004, pp. 133-143. [8] N. Miyake, T. Takiguchi and Y. Ariki, “Noise Detection and Classification in Speech Signals with Boosting,” IEEE Workshop on Statistical Signal Processing (SSP), 2007, pp. 778-782. [9] Y. Freund, et al., “A Decision-Theoretic Generalization of On-Line Learning and an Application to Boosting,” Journal of Computer and System Sciences, Vol. 55, 1997, pp. 119-139. [10] S. Nakamura, et al., “Acoustical Sound Database in Real Environments for Sound Scene Understanding and Hands-Free Speech Recognition,” Proceedings of 2nd ICLRE, 2000, pp. 965-968. |