Paper Menu >>
Journal Menu >>
 J. Biomedical Science and Engineering, 2009, 2, 20-23 Published Online February 2009 in SciRes. http://www.scirp.org/journal/jbise JBiSE Researches on a practical system for concentration detection of human exhaled CO2 gas Rong-Guo Yan1, Bin Ge1, Hai-Ming Xie1 School of medical instrument and food engineering, University of Shanghai for Science and Technology, Shanghai 200093. Correspondence should be ad- dressed to Rong-Guo Yan (yanrongguo@usst.edu.cn), Tel: +86 21 55271115. Received July 30th, 2008; revised November 12th, 2008; accepted November 19th, 2008 ABSTRACT In clinics, especially in the emergency depart- ment, carbon dioxide (CO2) is considered as the sixth vital sign in evaluating a patient’s medical status. However, its wide applications in devel- oping countries are dissatisfactory due to their high cost compared to their economic growth. In order to develop a practical system for con- centration detection of human exhaled CO2 gas for our own, we studied the detection principle based upon the non-dispersive infrared (NDIR) measuring technique and related Lambert- Beer’s equation carefully, gave out our func- tional circuit design of the system, and provided the corresponding graphical user interface (GUI) for CO2 detection. Finally, the experiment shows that it may be a practical system, and will give benefits for the development of our medical care in the future. Keywords: CO2 Concentration Detection, NDIR, Lambert-Beer’s Equation, Detection Module, Instrument Module 1. INTRODUCTION As we know, carbon dioxide (CO2), as a gas byproduct produced by human cellular metabolism and finally ex- haled out into the air through our noise, can be measured to reflect the systematic functions of metabolism, circu- lation and ventilation [1,2,3]. Especially, through the noninvasive monitoring of end-tidal carbon dioxide (ETCO2), which is also known as capnography measur- ing the maximum carbon dioxide level reached at the end of each breath [4,5,6], it can provide the doctor or the nurse the sixth vital sign, as important as five other signs, i.e., respiration, heart rate, temperature, blood pressure and pain in evaluating the medical status of the subjects. In America, capnography, other than monitoring pulse oxygen saturation, has already been considered as one of the “basic standards” for monitoring for all the subjects receiving anesthesia. The most common principles for CO2 detection are based upon non-dispersive infrared (NDIR) measure- ment or based upon chemical reactions. Commonly, chemical CO2 gas sensors with sensitive layers have the principal advantage of very low energy consumption and can be reduced in size to fit into microelectronic based systems. However, compared with the NDIR measure- ment principle [7], chemical CO2 sensors face major obstacles like short-and long term drift effects and a rather low overall lifetime [8,9]. Although the technology carried out for monitoring expired CO2 gas based upon NDIR is not a new tech- nology [10,11,12], its wide applications, such as in me- chanical ventilator, anesthesia machine, and etc., in de- veloping countries are still left in a dissatisfactory condi- tion due to its high cost compared to their economic growth. However nowadays, with the development of integrated circuits and non-dispersive infrared (NDIR) sensing technology, its utilization by clinicians outside the operating room or anesthesia realm has also grown, especially in the emergency department. Thus, this paper will present the principle for CO2 gas concentration measurement; introduce its functional cir- cuit design that we applied; and provide its current ex- perimental result to show its practicability for use. 2. PRINCIPLE FOR DETECTION The method we used for concentration detection of CO2 gas is based upon the NDIR measuring technique and a so-called well-known Lambert-Beer’s equation [13]. The equation is given as follow: kcl eII − ∗= 0 (1) Where, I0 = the intensity of light incident on the sample; I = the measured intensity of light after the sample; k = the absorption coefficient of the analyte gas at the characteristic wavelength (cm2); c = the concentration of the analyte gas (1/cm3); l = the path-length or the distance that the light trav- erses the sample gas (cm). Let The project is supported by the research award fund for selectively culturing excellent young teachers in higher educations in shanghai (grant No. slg-07045). SciRes Copyright © 2009 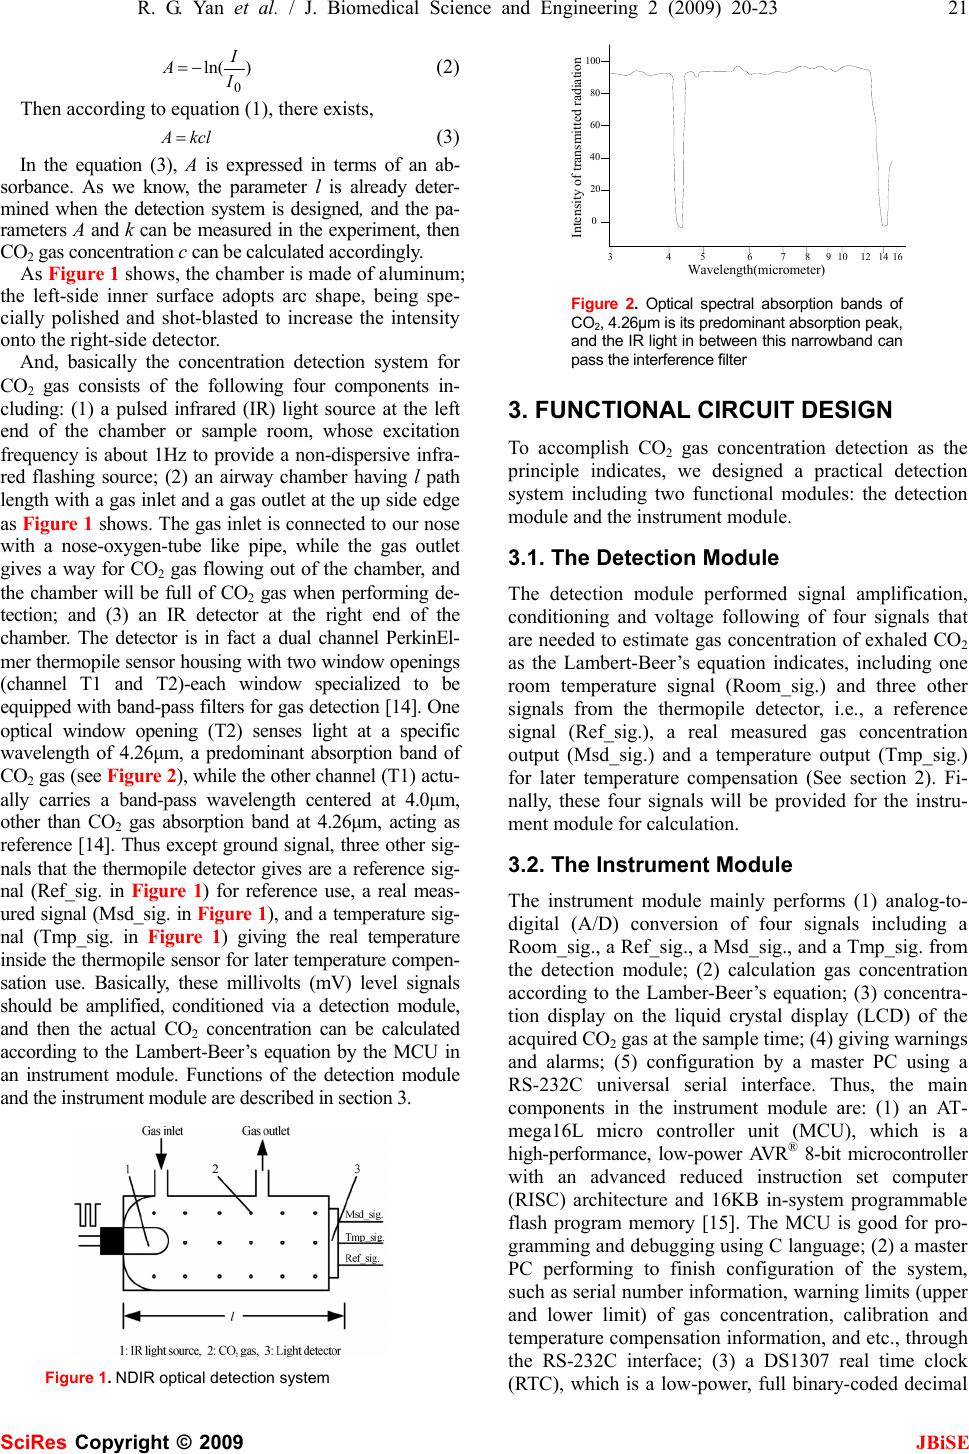 R. G. Yan et al. / J. Biomedical Science and Engineering 2 (2009) 20-23 21 SciRes Copyright © 2009 JBiSE )ln( 0 I I A−= (2) Then according to equation (1), there exists, kclA = (3) In the equation (3), A is expressed in terms of an ab- sorbance. As we know, the parameter l is already deter- mined when the detection system is designed, and the pa- rameters A and k can be measured in the experiment, then CO2 gas concentration c can be calculated accordingly. As Figure 1 shows, the chamber is made of aluminum; the left-side inner surface adopts arc shape, being spe- cially polished and shot-blasted to increase the intensity onto the right-side detector. And, basically the concentration detection system for CO2 gas consists of the following four components in- cluding: (1) a pulsed infrared (IR) light source at the left end of the chamber or sample room, whose excitation frequency is about 1Hz to provide a non-dispersive infra- red flashing source; (2) an airway chamber having l path length with a gas inlet and a gas outlet at the up side edge as Figure 1 shows. The gas inlet is connected to our nose with a nose-oxygen-tube like pipe, while the gas outlet gives a way for CO2 gas flowing out of the chamber, and the chamber will be full of CO2 gas when performing de- tection; and (3) an IR detector at the right end of the chamber. The detector is in fact a dual channel PerkinEl- mer thermopile sensor housing with two window openings (channel T1 and T2)-each window specialized to be equipped with band-pass filters for gas detection [14]. One optical window opening (T2) senses light at a specific wavelength of 4.26μm, a predominant absorption band of CO2 gas (see Figure 2), while the other channel (T1) actu- ally carries a band-pass wavelength centered at 4.0μm, other than CO2 gas absorption band at 4.26μm, acting as reference [14]. Thus except ground signal, three other sig- nals that the thermopile detector gives are a reference sig- nal (Ref_sig. in Figure 1) for reference use, a real meas- ured signal (Msd_sig. in Figure 1), and a temperature sig- nal (Tmp_sig. in Figure 1) giving the real temperature inside the thermopile sensor for later temperature compen- sation use. Basically, these millivolts (mV) level signals should be amplified, conditioned via a detection module, and then the actual CO2 concentration can be calculated according to the Lambert-Beer’s equation by the MCU in an instrument module. Functions of the detection module and the instrument module are described in section 3. Figure 1. NDIR optical detection system 34567 891012 14 16 0 20 40 60 80 100 Wavelength(micrometer) Intensity of transmitted radiation Figure 2. Optical spectral absorption bands of CO2, 4.26μm is its predominant absorption peak, and the IR light in between this narrowband can pass the interference filter 3. FUNCTIONAL CIRCUIT DESIGN To accomplish CO2 gas concentration detection as the principle indicates, we designed a practical detection system including two functional modules: the detection module and the instrument module. 3.1. The Detection Module The detection module performed signal amplification, conditioning and voltage following of four signals that are needed to estimate gas concentration of exhaled CO2 as the Lambert-Beer’s equation indicates, including one room temperature signal (Room_sig.) and three other signals from the thermopile detector, i.e., a reference signal (Ref_sig.), a real measured gas concentration output (Msd_sig.) and a temperature output (Tmp_sig.) for later temperature compensation (See section 2). Fi- nally, these four signals will be provided for the instru- ment module for calculation. 3.2. The Instrument Module The instrument module mainly performs (1) analog-to- digital (A/D) conversion of four signals including a Room_sig., a Ref_sig., a Msd_sig., and a Tmp_sig. from the detection module; (2) calculation gas concentration according to the Lamber-Beer’s equation; (3) concentra- tion display on the liquid crystal display (LCD) of the acquired CO2 gas at the sample time; (4) giving warnings and alarms; (5) configuration by a master PC using a RS-232C universal serial interface. Thus, the main components in the instrument module are: (1) an AT- mega16L micro controller unit (MCU), which is a high-performance, low-power AVR® 8-bit microcontroller with an advanced reduced instruction set computer (RISC) architecture and 16KB in-system programmable flash program memory [15]. The MCU is good for pro- gramming and debugging using C language; (2) a master PC performing to finish configuration of the system, such as serial number information, warning limits (upper and lower limit) of gas concentration, calibration and temperature compensation information, and etc., through the RS-232C interface; (3) a DS1307 real time clock (RTC), which is a low-power, full binary-coded decimal 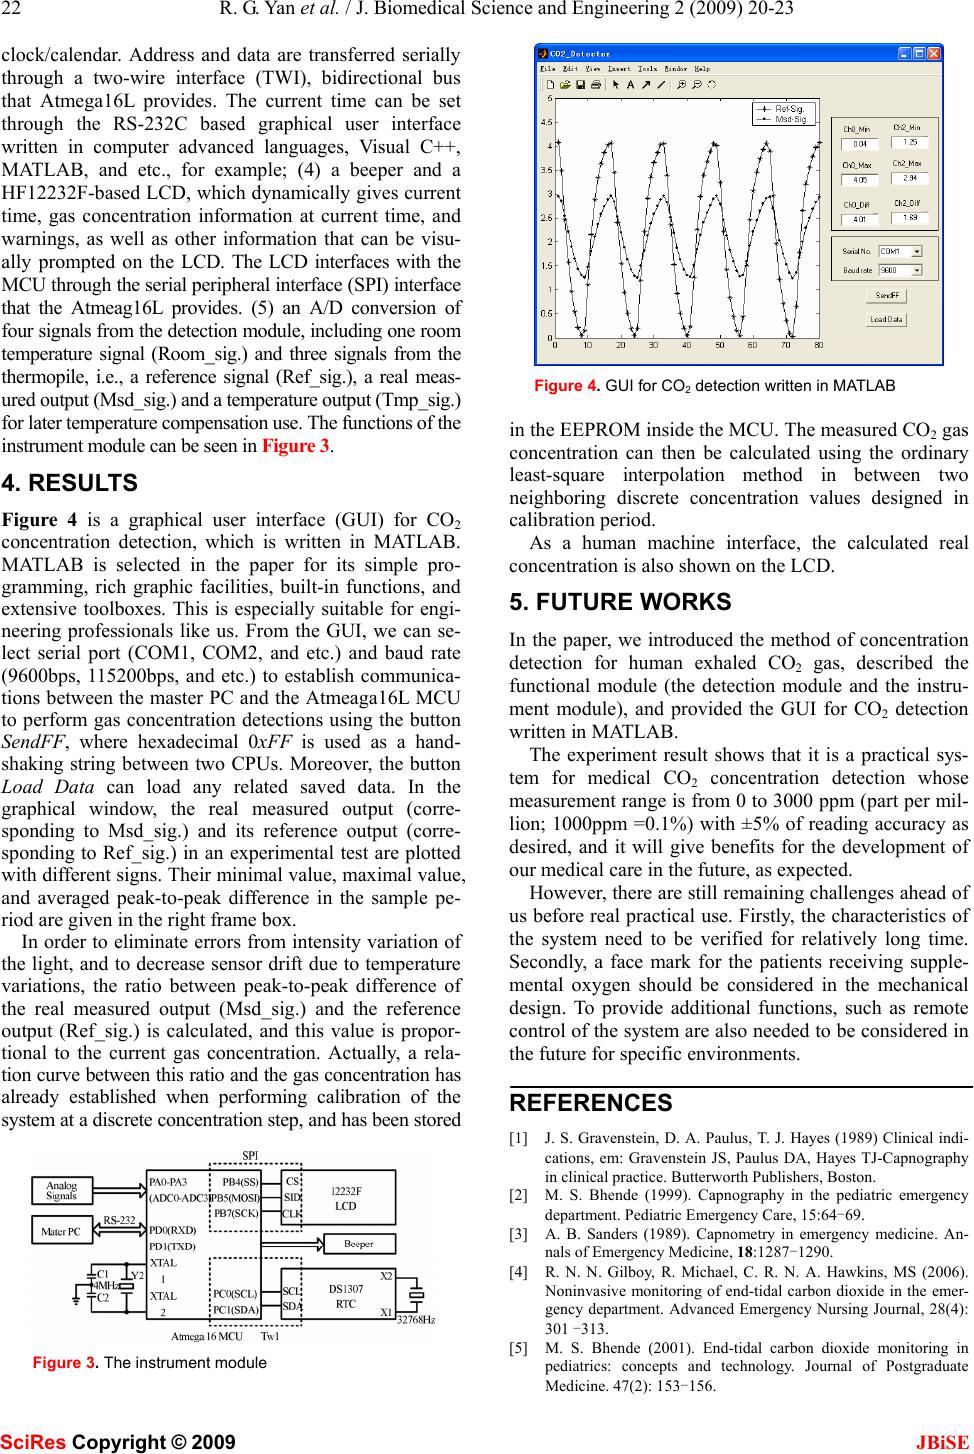 22 R. G. Yan et al. / J. Biomedical Science and Engineering 2 (2009) 20-23 SciRes Copyright © 2009 JBiSE clock/calendar. Address and data are transferred serially through a two-wire interface (TWI), bidirectional bus that Atmega16L provides. The current time can be set through the RS-232C based graphical user interface written in computer advanced languages, Visual C++, MATLAB, and etc., for example; (4) a beeper and a HF12232F-based LCD, which dynamically gives current time, gas concentration information at current time, and warnings, as well as other information that can be visu- ally prompted on the LCD. The LCD interfaces with the MCU through the serial peripheral interface (SPI) interface that the Atmeag16L provides. (5) an A/D conversion of four signals from the detection module, including one room temperature signal (Room_sig.) and three signals from the thermopile, i.e., a reference signal (Ref_sig.), a real meas- ured output (Msd_sig.) and a temperature output (Tmp_sig.) for later temperature compensation use. The functions of the instrument module can be seen in Figure 3. 4. RESULTS Figure 4 is a graphical user interface (GUI) for CO2 concentration detection, which is written in MATLAB. MATLAB is selected in the paper for its simple pro- gramming, rich graphic facilities, built-in functions, and extensive toolboxes. This is especially suitable for engi- neering professionals like us. From the GUI, we can se- lect serial port (COM1, COM2, and etc.) and baud rate (9600bps, 115200bps, and etc.) to establish communica- tions between the master PC and the Atmeaga16L MCU to perform gas concentration detections using the button SendFF, where hexadecimal 0xFF is used as a hand- shaking string between two CPUs. Moreover, the button Load Data can load any related saved data. In the graphical window, the real measured output (corre- sponding to Msd_sig.) and its reference output (corre- sponding to Ref_sig.) in an experimental test are plotted with different signs. Their minimal value, maximal value, and averaged peak-to-peak difference in the sample pe- riod are given in the right frame box. In order to eliminate errors from intensity variation of the light, and to decrease sensor drift due to temperature variations, the ratio between peak-to-peak difference of the real measured output (Msd_sig.) and the reference output (Ref_sig.) is calculated, and this value is propor- tional to the current gas concentration. Actually, a rela- tion curve between this ratio and the gas concentration has already established when performing calibration of the system at a discrete concentration step, and has been stored Figure 3. The instrument module Figure 4. GUI for CO2 detection written in MATLAB in the EEPROM inside the MCU. The measured CO2 gas concentration can then be calculated using the ordinary least-square interpolation method in between two neighboring discrete concentration values designed in calibration period. As a human machine interface, the calculated real concentration is also shown on the LCD. 5. FUTURE WORKS In the paper, we introduced the method of concentration detection for human exhaled CO2 gas, described the functional module (the detection module and the instru- ment module), and provided the GUI for CO2 detection written in MATLAB. The experiment result shows that it is a practical sys- tem for medical CO2 concentration detection whose measurement range is from 0 to 3000 ppm (part per mil- lion; 1000ppm =0.1%) with ±5% of reading accuracy as desired, and it will give benefits for the development of our medical care in the future, as expected. However, there are still remaining challenges ahead of us before real practical use. Firstly, the characteristics of the system need to be verified for relatively long time. Secondly, a face mark for the patients receiving supple- mental oxygen should be considered in the mechanical design. To provide additional functions, such as remote control of the system are also needed to be considered in the future for specific environments. REFERENCES [1] J. S. Gravenstein, D. A. Paulus, T. J. Hayes (1989) Clinical indi- cations, em: Gravenstein JS, Paulus DA, Hayes TJ-Capnography in clinical practice. Butterworth Publishers, Boston. [2] M. S. Bhende (1999). Capnography in the pediatric emergency department. Pediatric Emergency Care, 15:64-69. [3] A. B. Sanders (1989). Capnometry in emergency medicine. An- nals of Emergency Medicine, 18:1287-1290. [4] R. N. N. Gilboy, R. Michael, C. R. N. A. Hawkins, MS (2006). Noninvasive monitoring of end-tidal carbon dioxide in the emer- gency department. Advanced Emergency Nursing Journal, 28(4): 301 -313. [5] M. S. Bhende (2001). End-tidal carbon dioxide monitoring in pediatrics: concepts and technology. Journal of Postgraduate Medicine. 47(2): 153-156. 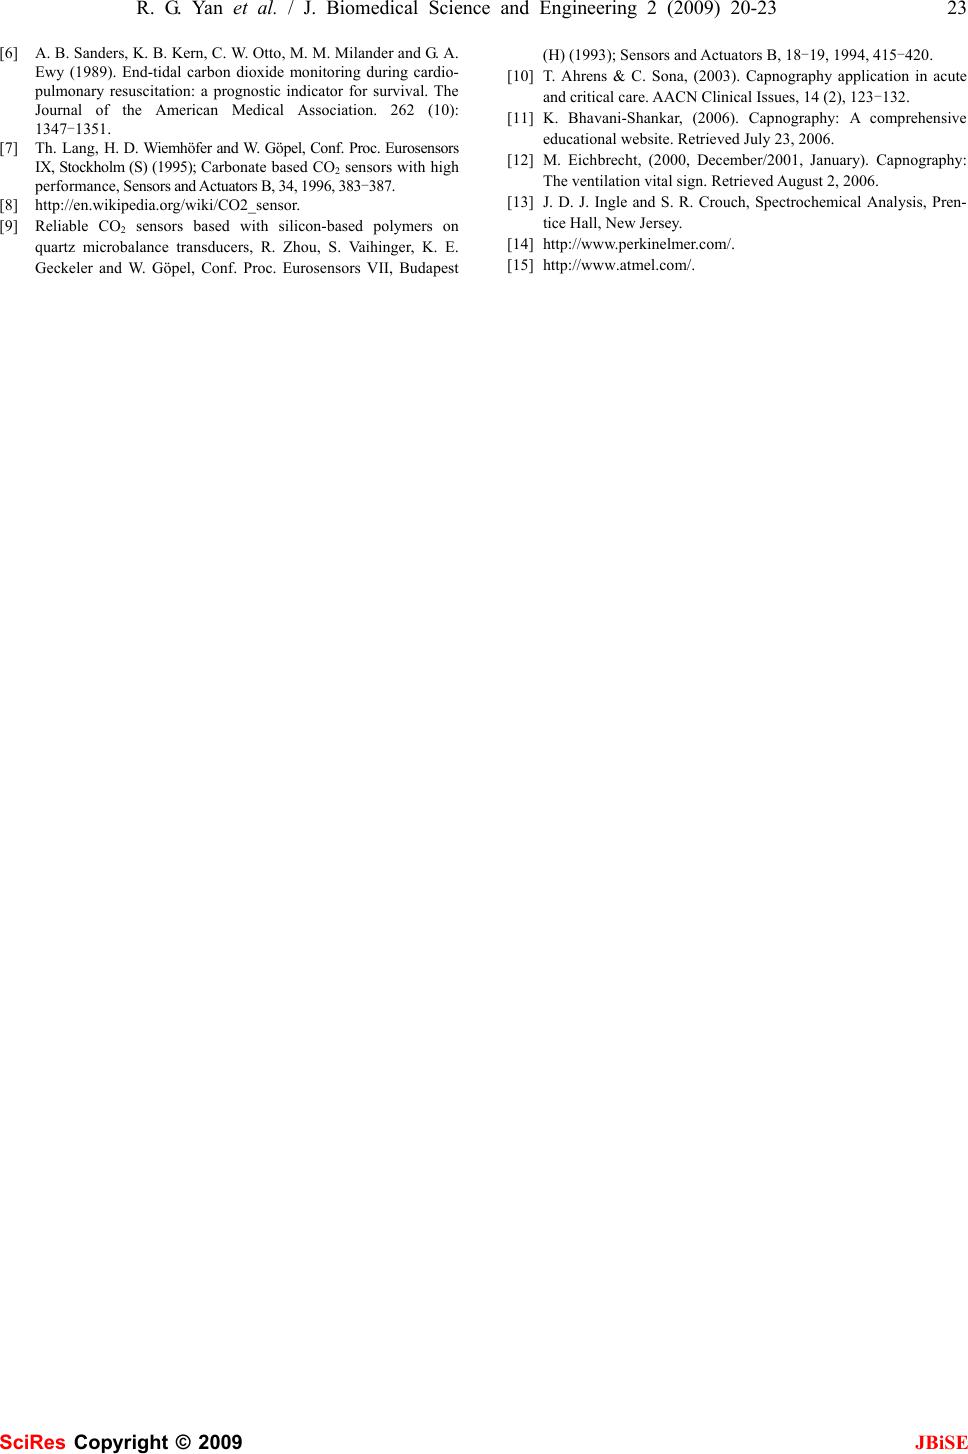 R. G. Yan et al. / J. Biomedical Science and Engineering 2 (2009) 20-23 23 SciRes Copyright © 2009 JBiSE [6] A. B. Sanders, K. B. Kern, C. W. Otto, M. M. Milander and G. A. Ewy (1989). End-tidal carbon dioxide monitoring during cardio- pulmonary resuscitation: a prognostic indicator for survival. The Journal of the American Medical Association. 262 (10): 1347-1351. [7] Th. Lang, H. D. Wiemhöfer and W. Göpel, Conf. Proc. Eurosensors IX, Stockholm (S) (1995); Carbonate based CO2 sensors with high performance, Sensors and Actuators B, 34, 1996, 383-387. [8] http://en.wikipedia.org/wiki/CO2_sensor. [9] Reliable CO2 sensors based with silicon-based polymers on quartz microbalance transducers, R. Zhou, S. Vaihinger, K. E. Geckeler and W. Göpel, Conf. Proc. Eurosensors VII, Budapest (H) (1993); Sensors and Actuators B, 18-19, 1994, 415-420. [10] T. Ahrens & C. Sona, (2003). Capnography application in acute and critical care. AACN Clinical Issues, 14 (2), 123-132. [11] K. Bhavani-Shankar, (2006). Capnography: A comprehensive educational website. Retrieved July 23, 2006. [12] M. Eichbrecht, (2000, December/2001, January). Capnography: The ventilation vital sign. Retrieved August 2, 2006. [13] J. D. J. Ingle and S. R. Crouch, Spectrochemical Analysis, Pren- tice Hall, New Jersey. [14] http://www.perkinelmer.com/. [15] http://www.atmel.com/. |