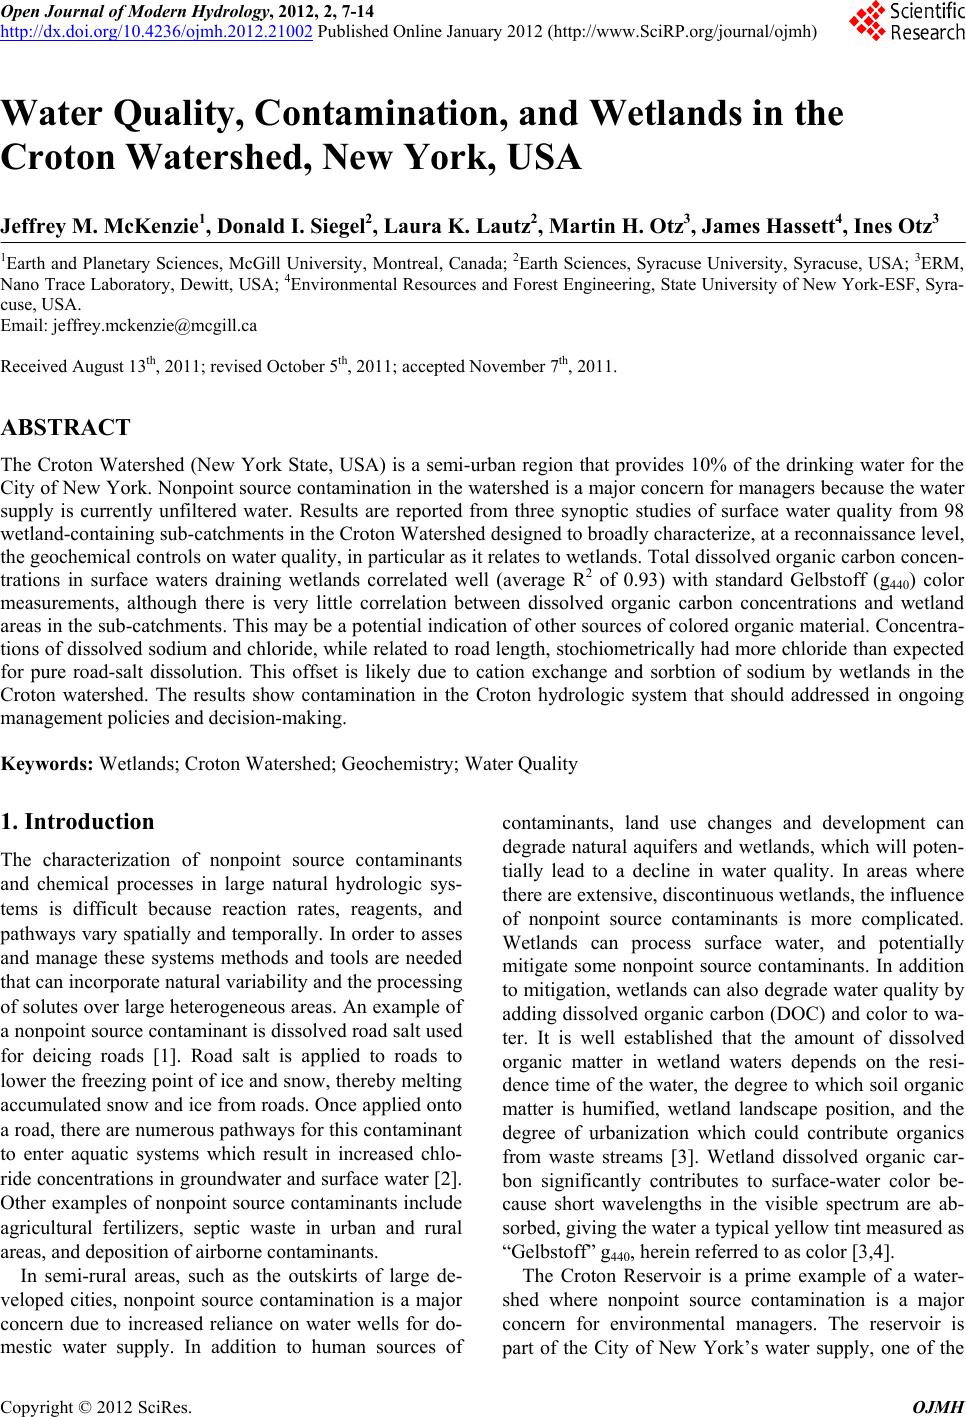
 Open Journal of Modern Hydrology, 2012, 2, 7-14 http://dx.doi.org/10.4236/ojmh.2012.21002 Published Online January 2012 (http://www.SciRP.org/journal/ojmh) 1 Water Quality, Contamination, and Wetlands in the Croton Watershed, New York, USA Jeffrey M. McKenzie1, Donald I. Siegel2, Laura K. Lautz2, Martin H. Otz3, James Hassett4, Ines Otz3 1Earth and Planetary Sciences, McGill University, Montreal, Canada; 2Earth Sciences, Syracuse University, Syracuse, USA; 3ERM, Nano Trace Laboratory, Dewitt, USA; 4Environmental Resources and Forest Engineering, State University of New York-ESF, Syra- cuse, USA. Email: jeffrey.mckenzie@mcgill.ca Received August 13th, 2011; revised October 5th, 2011; accepted November 7th, 2011. ABSTRACT The Croton Watershed (New York State, USA) is a semi-urban region that provides 10% of the drinking water for the City of New York. Nonpoint source contamination in the watershed is a major concern for managers because the water supply is currently unfiltered water. Results are reported from three synoptic studies of surface water quality from 98 wetland-containing sub-catchments in the Croton Watershed designed to broadly characterize, at a reconnaissance level, the geochemical controls on water quality, in particular as it relates to wetlands. To tal dissolved organic carbon concen - trations in surface waters draining wetlands correlated well (average R2 of 0.93) with standard Gelbstoff (g440) color measurements, although there is very little correlation between dissolved organic carbon concentrations and wetland areas in the sub-catchments. This may be a potential indication of other sources of colored organic material. Concentra- tions of dissolved sodium and chloride, while related to road length, stochiometrically had more chloride than expected for pure road-salt dissolution. This offset is likely due to cation exchange and sorbtion of sodium by wetlands in the Croton watershed. The results show contamination in the Croton hydrologic system that should addressed in ongoing management policies and decision-making. Keywords: Wetlands; Croton Watershed; Geochemistry; Water Quality 1. Introduction The characterization of nonpoint source contaminants and chemical processes in large natural hydrologic sys- tems is difficult because reaction rates, reagents, and pathways vary spatially and temporally. In order to asses and manage these systems methods and tools are needed that can incorporate natural variability an d the processing of solutes over large heterogeneous areas. An example of a nonpoint source co ntaminant is disso lved road salt used for deicing roads [1]. Road salt is applied to roads to lower the freezing point of ice and snow, thereby melting accumulated snow and ice from roads. Once applied onto a road, the re are nu mer ou s pathways for this contaminant to enter aquatic systems which result in increased chlo- ride concentrations in groundwater and surface water [2]. Other examples of nonpoint source contaminants include agricultural fertilizers, septic waste in urban and rural areas, and deposition of airborne contaminants. In semi-rural areas, such as the outskirts of large de- veloped cities, nonpoint source contamination is a major concern due to increased reliance on water wells for do- mestic water supply. In addition to human sources of contaminants, land use changes and development can degrade natural aq uifers and wetlands, which will poten- tially lead to a decline in water quality. In areas where there are extensive, discontinuous wetlands, the in fluence of nonpoint source contaminants is more complicated. Wetlands can process surface water, and potentially mitigate some nonpoint source contaminants. In addition to mitigation, wetlands can also degrade water quality by adding dissolved organic carbon (DOC) and color to wa- ter. It is well established that the amount of dissolved organic matter in wetland waters depends on the resi- dence time of the water, the degree to which so il organic matter is humified, wetland landscape position, and the degree of urbanization which could contribute organics from waste streams [3]. Wetland dissolved organic car- bon significantly contributes to surface-water color be- cause short wavelengths in the visible spectrum are ab- sorbed, giving the water a typical yellow tint measured as “Gelbstoff” g440, herein referred to as color [3,4]. The Croton Reservoir is a prime example of a water- shed where nonpoint source contamination is a major concern for environmental managers. The reservoir is part of the City of New York’s water supply, one of the Copyright © 2012 SciRes. OJMH  Water Quality, Contamination, and Wetlands in the Croton Watershed, New York, USA 8 most famous and extensive water supply systems in the world [5,6]. During the 1990’s the water quality in the Croton reservoir became degraded because of residential, commercial, and industrial development within the wa- tershed [7]. Although the water is no t filtered for domes- tic distribution, it is disinfected by chlorination. Even by-products from the chlorination, such as trihalome- thanes and haloacetic acids, are sometimes present in the water and during late fall the water may even exceed drinking water standards [8]. Heisig [8] first addressed nonpoint source contamina- tion in the Croton reservoir system by studying the con- trols of baseflow in several sub-catchments. He found that the surface water chemistry appears to be dominated by road salt dissolution. Nitrate concentrations are clo- sely related to the density houses no t connected to a mu- nicipal sewer system (i.e. having a septic-field system), and nitrate concentrations were lowered by riparian wet- lands. However, his studies were in largely urbanized areas of the watershed. The Croton watershed is notable for having extensive wetlands that cover 6% of the total watershed area [9]. While these wetlands have important hydrologic func- tionality, many questions remain regarding their interac- tion with nonpoint source contaminants. This study fo- cuses on the interaction of wetlands with these types of contaminates, and in particular water coloration and road deicers. Water coloration affects the public’s perception of water quality [10] and is an indicator of some aspects of ecosystem function related to oxygenation [11], resi- dence time, and degree of biodegradable material in catchments [12,13]. Road deicers (also known as road salt), primarily in the form of sodium chloride or calcium chloride, are spread directly onto the road surface during winter and enter the environment as surface runoff or spray resulting from plowing and vehicle splashing. Al- though there are numerous studies documenting the det- rimental and increasing effect of road salt on groundwa- ter and surface water [1,8,14,15] there is little research on how wetlands affect the fate and transport of road salt. We used a synoptic sampling approach over the Cro- ton Watershed in an attempt to understand the function and interaction of wetlands on water chemistry, including water coloration and road salt contamination. The Croton Watershed was chosen because of its water resource value, extensive size, and range of conditions within sub-watersheds, including urbanization and wetland cov- erage. Additionally the study tested the applicability of synoptic sampling as a monitoring tool and for studying impacts on water quality. The approach included a large number of samples capturing different seasonal pictures of chemical and coloration variability. Within a large watershed such as the Croton Reservoir, sampling many places for water quality parameters within local land- scapes can link water quality changes with landscape change, broad hydrogeochemical processes and geospa- tial data tied to landscape ch anges [16]. 2. Experiment Design 2.1. Study Area The Croton Reservoir is a semi-rural area with a popula- tion of more than 175,000 [17] and contains three con- trolled lakes and twelve reservoirs built on the Croton River which provide 10% of the drinking water to the City of New York [18,19]. Discharge from the Croton Water- shed flows either to the New Croton Reservoir, the New Croton Aqueduct, or to maintain flow in the Croton River. More than 100 wetlands cover about 6% of the Croton Watershed [9], with the remaining area covered by for- ested uplands, urban development, lakes, and reservoirs. The wetlands discharge to reservoirs and streams that flow southward across the watershed. Of the included wetlands, 70% by area are classified as palustrine, cov- ered by trees, shrubs, persistent emergent plants, emer- gent mosses, and lichens. These systems are underlain by glacial till and covered by organic-rich soil and peat less than 50 cm deep. Freshwater wetlands comprise 30% of the remaining wetlands, with just traces of riverine wet- lands in some of the sub-watersheds. The wetlands usu- ally constitute less than 25 % of their watersheds (Figure 1; unpublished data from N.Y. City Department of Envi- ronmental Protection). Figure 1. Map of the Croton Watershed, including the sub-watersheds, for which the outflow was sampled as part of the synoptic sampling. The sampled sub-watersheds are shaded by percent wetland area. Copyright © 2012 SciRes. OJMH  Water Quality, Contami n a t ion, and Wetl a nds in the Croton Watershed, New York, USA Copyright © 2012 SciRes. OJMH 9 The glacial till that overlies bedrock in the Croton wa- tershed consists of mostly silicate and aluminosilicate minerals [20-22]. Silicate minerals dissolve slowly com- pared to carbonate minerals [23] and wetlands in the Croton watershed have total dissolved solids concentra- tions generally less than 150 mg/L, much less than in regions underlain by carbonate minerals. Consequently, road salt and domestic contaminants that might enter wetland watersheds should be clearly identifiable. 2.2. Sampling and Analytical Methods The Croton watershed was divided into 103 sub-catch- ments ranging in area from 0.1 to 78.8 km2, with an average of 5.8 km2. These basins were chosen based on site access and variability of urbanization, wetland cove- rage, and geolog y. The total wetland cover age of the 103 sub-basins contains 80% of the total Croton wetland area (Figure 1). Surface water samples were collected at the outflow of these sub-basins, timed to capture the major points in wetland hydroperiods; summer (June 13, 2000), baseflow before leaf fall (October 12, 2001), and in early winter (November 30, 2001). The number of samples collected during each campaign was not exactly the same due to road access, number of investigators available to sample, and time constraints. The watershed was in drought conditions throughout most of the sampling period. The hydrological conditions prior to and during each synoptic sampling were com- pared to long-term data from the National Oceanic and Atmospheric Administration’s National Climatic Data Center from the Yorktown Heights and Danbury mete- orological stations (NCDC Cooperative Network Index Numbers 309670 and 61762 respectively), presented in Table 1 with station location s on Figure 1. The amount of precipitation prior to the first sampling was slightly above historical averages, and was below average before the second and third samplings. The antecedent meteorological conditions had only a minor influence on the synoptic sampling; e.g. during the Oct- ober 2001 synoptic sampling stream discharge was not- ably lower for some sampling points, and a few of the smaller wetlands had little to no measurable outflow. For each synoptic sampling campaign all of the water samples and field measurements were collected within a 24-hour period. At each sample collection point, field measurements were made of pH, specific conductance, and color. Collected samples were kept at 4˚C and analyzed shortly after delivery to analytical facilities. Concentrations of Na, Ca, Fe, silicon and other base metals were measured by direct current plasma spectr- oscopy in the Department of Earth Sciences at Syracuse University. Concentrations of dissolved organic carbon, major anions, and nitrate were measured at the State University of New York, College of Environmental Sci- ence and Forestry using ion chromatography and other standard methods. Color was assessed using the “Gel- bstoff” wavelength of 440 nm of absorption (g440), a standard indicator of the “concentration” of yellow pro- ducing organic matter in water, and was measured on filtered (0.45 um) water with a spectrophometer. Values for HCO3 were not measured directly for the October and November samplings and are calculated as the sample charge balance difference. Replicates, duplicates, and analysis of standards indicate a precision of ~3% and accuracy of ~7% for all of the analyses. Geospatial data was provided by the NY State Depart- ment of Environmental Protection and was analyzed using ESRI ArcInfo to delineate sub-watershed boundaries. For each sampled sub-watershed, the area, housing density, total road length and wetland area were calculated. 3. Results and Discussion 3.1. Major Chemistry The three synoptic sampling campaigns collected surface water at the outlets of 88, 86 , and 103 sub-catchments in June, October, and November, 2001 respectively from within the Croton Reservoir area. Table 2 lists summary statistics for the measured variables for each synoptic sampling. Figure 2 presents the major ion chemistry data on a Piper Plot [23,24], a graphical representation of hy- rochemical data where ion chemistry from individual d Table 1. Summary of precipitation records at the Yorktown Heights and Danbury meteorological stations prior to the three synoptic samplings. Values are in inches of water. Station locations are on Figure 1. Synoptic Sampling Total Pre- cipitation Previous 5 Days (Dan- bury) Total Pre- cipitation Previous 14 Days (Dan- bury) Total Pre- cipitation Previous 5 Days (Yorktown Heights) Total Pre- cipitation Previous 14 Days (Yorktown Heights) Monthly Total, (Danbury) Monthly Average, (Danbury) Monthly Tot al, (YorktownHeights) Monthly Average, (YorktownHeights) #1—June 13, 2000 1.3 5.6 0.7 3.8 6.6 (June)4.0 5.4 (June) 4.4 #2—October 12, 2001 0 .8 0.0 0.6 1.1 (Oct)3.7 1.2 (Oct) 3.9 #3—November 30, 2001 .1 .9 0.8 1.1 1.2 (Nov)4.5 1.3 (Nov) 4.5  Water Quality, Contamination, and Wetlands in the Croton Watershed, New York, USA 10 Table 2. Summary statistics of parameters measured in the three synoptic samplings. Synoptic Statistic Solute Concentration (in ppm) G440 (1/m) pH (ph Units) E.C. (us/cm) DOC HCO3CaSiFeSrMgK Na Cl NO3SO4 Mean 3.2 7.0 246.3 4.962.718.94.30.40.16.31.8 16.1 28.5 1.49.6 Standard Deviation 2.5 0.3 108.2 2.534.58.61.80.70.13.30.8 9.4 17.6 1.83.7 Minimum 0.3 6.2 37.0 0.67.72.80.00.00.00.50.0 1.6 1.6 0.01.8 Maximum 12.27.7 597.0 14.8208.946.77.56.70.419.1 4.7 60.8 99.6 9.321.3 13/06/2000 (n = 88) Range 11.91.5 560.0 14.1201.244.07.56.70.418.6 4.7 59.2 98.0 9.319.5 Mean 2.1 6.8 431.3 4.9N/A 33.95.00.00.111.5 3.8 32.1 61.8 3.414.9 Standard Deviation 1.8 6.6 186.8 4.0N/A14.52.10.10.15.52.8 23.7 42.4 8.111.2 Minimum 0.2 5.8 82.0 1.0 N/A 5.70.50.00.01.60.8 3.3 2.3 0.00.4 Maximum 11.07.5 919.0 30.5N/A66.513.40.60.227.2 21.3 115.0 229.7 59.673.7 12/10/2001 (n = 86) Range 10.81.8 837.0 29.6N/A60.812.90.60.225.6 20.5 111.7 227.4 59.673.3 Mean 2.3 6.9 395.9 5.1N/A 31.45.00.10.110.6 3.5 26.2 59.5 2.115.1 Standard Deviation 2.4 6.8 189.7 4.2N/A14.72.00.10.06.21.9 19.5 41.1 5.39.0 Minimum 0.3 5.9 48.0 1.1 N/A 5.50.40.00.01.40.7 2.9 2.4 0.04.0 Maximum 16.17.6 1111.0 31.3N/A84.08.80.80.340.4 12.5 122.0 227.2 52.264.8 30/11/2001 (n = 103) Range 15.81.7 1063.0 30.2N/A78.58.40.80.339.0 11.8 119.1 224.8 52.260.9 samples is projected onto the ‘Piper Diamond’. The loca- tion of a sample on this diamond provides information about sample source and potential mixing relationships. Commonly, waters with a Ca-Mg-HCO3 signature are thought to indicate a glacial till or carbonate rock source, the Ca-SO4 signature is indicative of gypsum dissolution or sulfide oxidation, and waters with a Na-Cl signature are indicative of brine or road salt contamination. For the October and November samples alkalinity is calculated by charge balance. The Piper Plot (Figure 2) shows that almost all of the water samples, independent of time of sampling, primarily fall on in a linear grouping that connects the Ca-Mg-HCO3 apex to a point between the Na-Cl (60%) and Ca-SO4 (40%) apexes. The trend in the data shows the mixing of road salt contaminated runoff with the regional groundwa- ter that is derived from surface glacial deposits and is a clear indicator of ubiquitous nonpoint source contamina- tion by road salt. The samples are mixed also by the Ca-SO4 apex, suggesting a sulfate source such as dissolve- ing gypsum or Ca, which is found in road deicers that are applied at colder temperatures. 3.2. Controls on Water Color Water coloration can be a function of either DOC and/or Fe in the water column, therefore water samples were analyzed for g440, DOC, and Fe. The minimum and maximum measured g440 values were 0.3 and 16.1 1/m, with an average and standard deviation for all samples of 2.5 1/m and standard deviation of 2.2. The average DOC concentration was 5.0 ppm, with progressively increasing standard deviations for each sampling. The Fe concen- trations were consistently near detection limits, with an average for all samples of 0.2 ppm, but with a standard deviation of 0.3. The highest Fe concentrations were observed in the June 2000 samplin g, including 4 samples with Fe concentrations above 0.8 ppm. The color of the waters, measured by g440, was closely correlated with the concentrations of dissolved organic carbon (Figure 3(a)). The Pearson Correlation Co e f f ic i en t was r = 0.961, 0.895, and 0.921 for the June 2000, October 2001, and November 2001 synoptic samplings respectively. The range of observed DOC concentrations is similar to that found in small streams within the Croton Reservoir [8]. An alternative hypothesis that water color was related to Fe was not supported by the data; there is only a very weak trend of increasing g440 with iron concentrations. Therefore, DOC is likely the primary control on color of wetland surface waters in the Croton Watershed, although the g440 method of meas- uring color may not be entirely effective to measure the color from iron precipitates and other colloidal material in water [9]. Iron does not appear to influence the water color, however Fe measured concentrations were relatively low for the three samplings with the exceptions of a few sam- ples from the June 2000 sampling (Figure 3(b)). These high values may be a result of the relatively wet antece- dent moisture conditions at the time of sampling. Flooding can lead to water logged soils and reducing conditions that increase mobilization and lead to higher concentra- tions of Fe [25]. Sub-watersheds that have a large wetland area should contribute a greater amount of DOC per unit area than Copyright © 2012 SciRes. OJMH 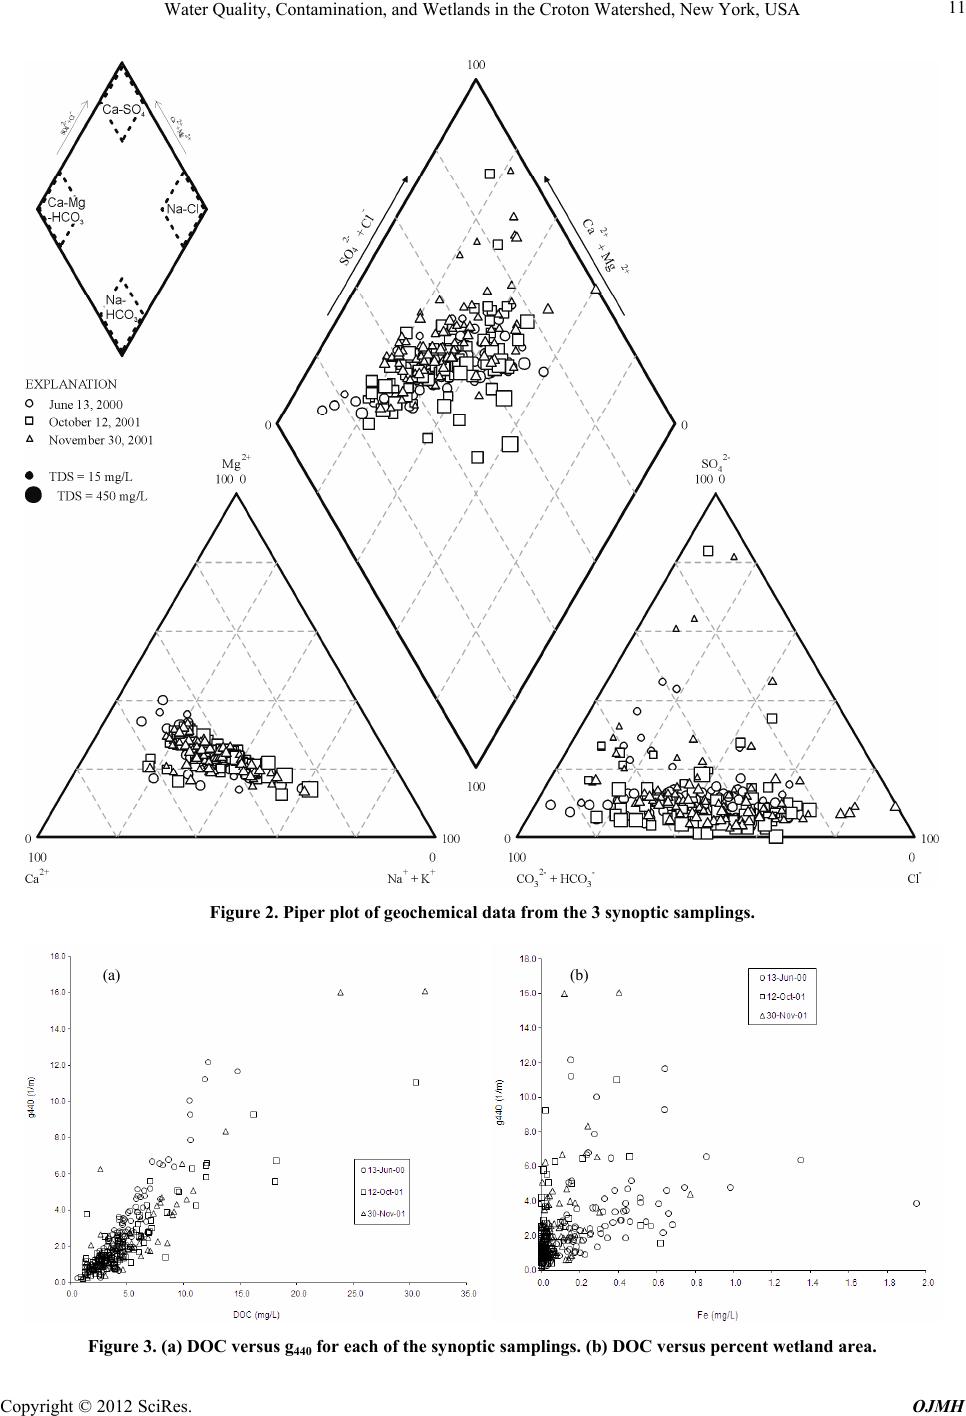 Water Quality, Contami n a t ion, and Wetl a nds in the Croton Watershed, New York, USA 11 Figure 2. Piper plot of geochemical data from the 3 synoptic samplings. (a) (b) Figure 3. (a) DOC versus g440 for each of the synoptic samplings. (b) DOC versus percent wetland area. Copyright © 2012 SciRes. OJMH  Water Quality, Contamination, and Wetlands in the Croton Watershed, New York, USA 12 sub-watersheds with less wetland because of increased residence times in wetland soils, leading to a greater opp- ortunity for the dissolution of DOC due to organic oxi- dation and degradation. Most biodegradation processes follow first-order kinetics [21] and are fast when organic decomposition begins and labile carbon compounds are released. With time, the ratio of refractory carbon to la- bile carbon may increase as DOC, consisting mostly of colored organic acids in peatland settings, is discharged from the wetlands. The water chemistry results from the three synoptic samplings do not fully support the hypothesis that greater wetland area correlates with increased DOC and color, but rather that the link between wetland coverage, DOC, and color in the Croton watershed is complex, perhaps because residence time for surface water in many of the small wetlands are too short to produce large amounts of DOC in the waters, compared to wetlands in other wa- tersheds underlain by peat. An additional source of DOC load may be contribution from septic and sewage ineffi- ciency, which remains to be determined. 3.3. Nitrate The quantification of septi c discharges by di rect or i ndi rect measurement from seepage faces and other hydrologic discharge points from homes was not directly measured. Nonetheless, the ubiquity of septic contamination, even in the less developed regions of the Croton system, is clear from analysis of nitrate concentrations. Concentrations of nitrate (Table 2 ), ranging from non-detectable to 59.6 ppm, exceeding what normally is found in undeveloped water- sheds in the northeast of the United States, less than 1 mg/L. In the Croton Reservoir, nitrate concentrations mea- sured in the synoptic sampling waters did not correlate to percent wetland area per sub-watershed area, absolute wetland area per sub-watershed area, nor housing density. Concentrations of nitrate were lower during the June 2000 sampling compared to the other two samplings, likely due to dilution from precipitation (Table 1). The non-correl- ation between nitrate and simple geospatial data is likely a result of the sampling method where samples were taken from sub-basins with wetlands rather than near uplands where septic discharge would be more proximate. Addi- tionally there is likely denitrification by the time septic water reaches the sub-basin outlets [25,26]. 3.4. Road Salt The mean sodium and chloride concentrations measured over the three synoptic samplings were 24.8 ppm and 50.3 ppm respectively (Figure 4(a)). In contrast to the nitrate distribution, it was possible to identify that road salt or salt from water softeners was measurable in all of the sampled waters. The measured chloride concentra- tions in the study were similar in magnitu de to those pre- viously reported for streams in the Croton Reservoir [8,27]. Chloride is a very good tracer in natural systems as it is relatively unreactive, and the dominate source should be road salt, with minor contributions from do- mesticwaste and water-softeners [28]. Sodium is the primary cation contributed from road salt dissolution, with minor contributions from calcium and magnesium depending on the type of deicer used and weather condi- tions [8,29]. Stoichiometrically, the sodiumchloride ratio of the collected samples should fall on a 1:1 line for the dissolution of pure halite, and less th an one if sorbtion or cation exchange processes act as a sodium sink, and greater than one if there are other sources of sodium, such as domestic septic systems. Figure 4(a) shows that the measured chloride—sodium concentrations from the samples clearly have a slope less than one. A histogram of the ratio of sodium versus chloride concentrations (Figure 4(b)) shows sodium concentra- tions decrease relative to chloride seasonally. Assuming deicers are primarily applied in December through March (a) 0 5 10 15 20 25 30 35 0.1 0.3 0.5 0.7 0.9 1.1 1.3 1.5 1.7 1.9 2.1 2.3 2.5 2.7 Na (meq/L) / Cl (meq/L) Frequency June 13, 2000 (median = 0.88) October 12, 2001 (median = 0.71) November 30, 2001 (median = 0.66) (b) Figure 4. (a) Sodium versus Chloride for each of the three synoptic samplings. (b) Histogram of sodium to chloride ratio for each of the three synoptic samplings, showing a decrease in the relative concentration of sodium with time from the winter season. Copyright © 2012 SciRes. OJMH  Current Distortion Evaluation in Traction 4Q Constant Switching Frequency Converters 13 (snowfall), the observed progressive decrease in the me- dian sodium-chloride ratio from June to October to No- vember possibly indicates that with increased residence time there is increased sorbtion and cation exchange, the- reby decreasing the sodium concentration. Assuming a road-salt source, chloride concentrations in water from the sampled sub-watersheds should be re- lated to the length of roads per unit watershed area and there is such a relationship, albeit weak (R 2 = 0.21, 0.07, and 0.07 for the June 2000, Octob er 2001 , an d Nov ember 2001 synoptic samplings respectively; Figure 5). The relationship between housing density and chloride is stronger (R2 = 0.28, 0.18, and 0.14 for the June 2000, October 2001, and November 2001 synoptic samplings respectively). Apparent salt contamination is present in remote areas also, although there the source for the salt may be septic systems. The maximum chloride concentrations are measured in the October 2001 and November 2001 samplings, with concentrations in excess of 225 ppm, whereas the maxi- mum concentration observed in the June 2000 sampling is less than half of this at 99.6 ppm. These results likely indicate that wetland systems are being flushed by the wet ante- cedent moisture conditions, and the lower con- centrations are a result of dilution by meteoric derived water. 4. Summary and Conclusions The three synoptic studies were successful in character- izing contamination in the Croton Reservoir. In particular it was found that: 1) The source of colored water, as measured by g440, within the Croton reservoir system is DOC. Considering the extent of the wetland spatial co verage, they should be the primary source of DOC is wetlands. There is not a strong correlation between DOC concentrations and wet- land cover, indicating that contributions from other so urc es, such as septic systems, may be significant. 2) Salt contamination to the Croton watershed wetlands Figure 5. Chloride versus road length, showing a weak trend between increasing road length and chloride concen- trations in surface water. is ubiquitous, and by inference, probably is ubiqui- tous in other watersheds of the northeastern United States wherever roads are salted or water softeners are used. Road salt in all sub-watersheds discharges to the Croton system, even from watersheds that are relatively sparsely populated. 3) Nitrate concentrations in wetlands in the Croton watershed are generally higher than expected for pristine wetlands, and consequently suggest discharge of leachate from septic systems. The wetlands in the Croton water- shed are incapable of completely processing this nutrient by denitrification becaus e of short residence times. 4) The Croton watershed is a very important compo- nent of the New York City drinking water supply, and is vulnerable from population increases potentially leading to increased septic syste m and water softener byproducts and increased road salt in surface water. From a policy standpoint, it is obvious that the protection and en- hancement of these wetlands is a critical component of maintained water quality. Our research suggests that sig- nificant amounts of nitrate and DOC are entering the surface water system from septic systems, though this was not the focus of the research nor were direct meas- urements of leachate made for comparison. The Croton watershed is potentially vulnerable to on- going degradation, due in large part to increasing popula- tion and development that will encro ach on wetland areas, increase road density, and other land-use changes. Bal- ancing water protection policy between local zoning and regulations and the water quality for end u sers is difficult from a policy standpoint [29]. Recent research has shown a general increase in surface water DOC related primar- ily to decreases in acid deposition and climate change [29]. In the Croton watershed, the effect of climate change may be manifested as a lowering of wetland wa- ter-table elevations, leading to increased release of DOC [30]. Considering the close connection between DOC and color it is hypothesized that the presence of colored water in the Croton watershed will increase over time. 5. Acknowledgements The authors thank the NY Department of Environmental Protection for financial support of this project. REFERENCES [1] S. S. Kaushal, P. M Groffman, G. E. Likens, K. T. Belt, W. P. Stack, V. R. Kelly, L. E. Band and G. T. Fisher, “Increased Salinization of Fresh Water in the Northeast- ern United States,” Proceedings of the National Academy of Sciences, Vol. 102, No. 38, 2005, pp. 13517-13520. doi:10.1073/pnas.0506414102 [2] P. T. Harte and P. R. Trowbridge, “Mapping of Road- Salt-Contaminated Groundwater Discharge and Estima- tion of Chloride Load to a Small Stream in Southern New Copyright © 2012 SciRes. OJMH 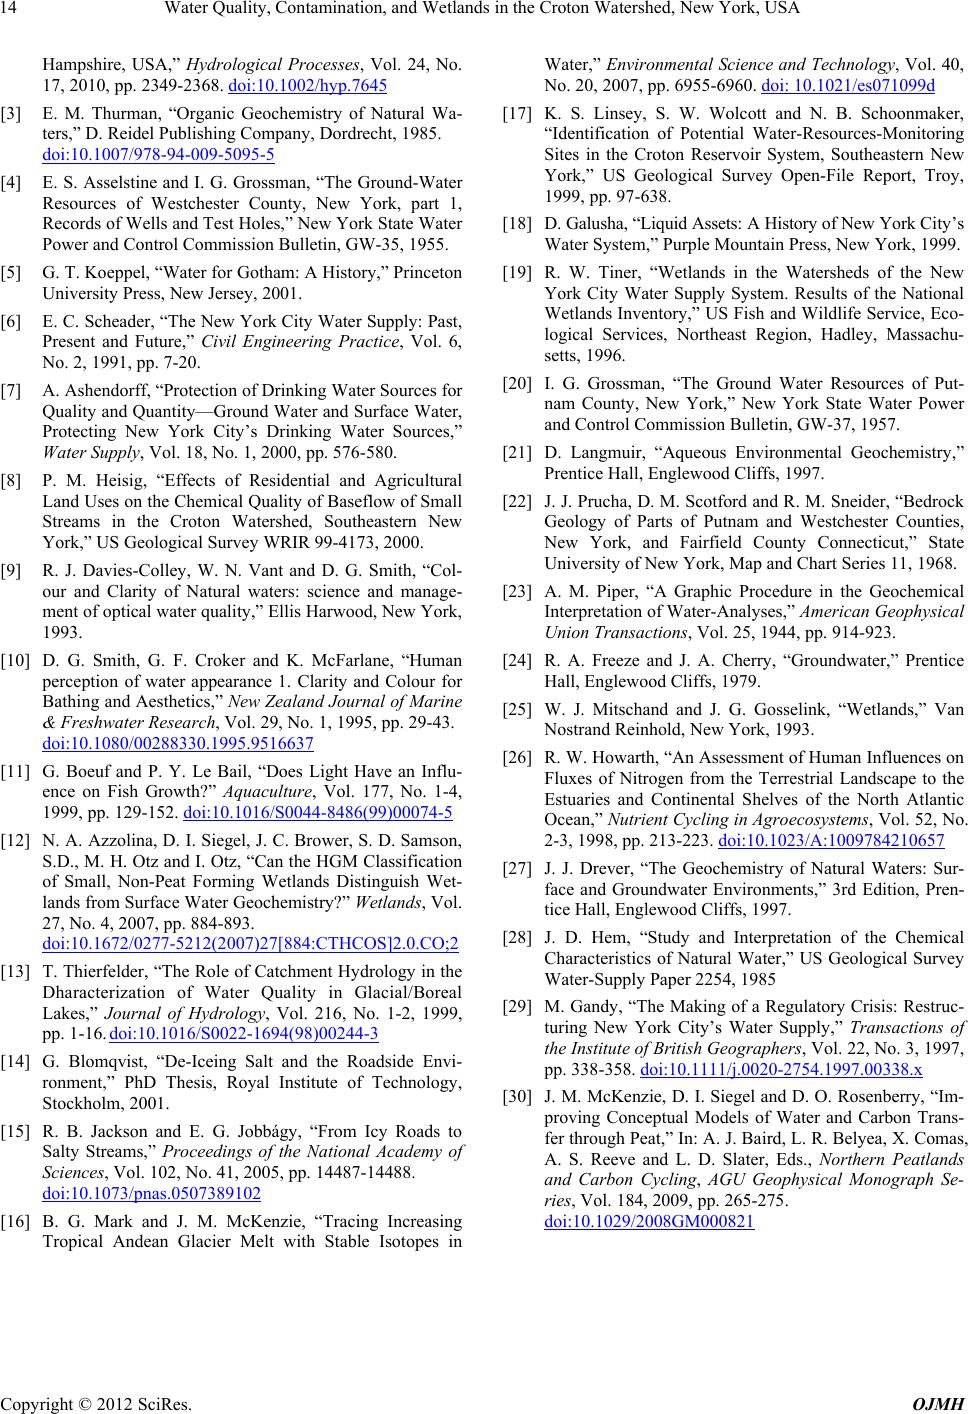 Water Quality, Contamination, and Wetlands in the Croton Watershed, New York, USA Copyright © 2012 SciRes. OJMH 14 Hampshire, USA,” Hydrological Processes, Vol. 24, No. 17, 2010, pp. 2349-2368. doi:10.1002/hyp.7645 [3] E. M. Thurman, “Organic Geochemistry of Natural Wa- ters,” D. Reidel Publishing Company, Dordrecht, 1985. doi:10.1007/978-94-009-5095-5 [4] E. S. Asselstine and I. G. Grossman, “The Ground-Water Resources of Westchester County, New York, part 1, Records of Wells and Test Holes,” New York State Water Power and Control Commission Bulletin, GW-35, 1955. [5] G. T. Koeppel, “Water for Gotham: A History,” Princeton University Press, New Jersey, 2001. [6] E. C. Scheader, “The New York City Wate r Supply: Past, Present and Future,” Civil Engineering Practice, Vol. 6, No. 2, 1991, pp. 7-20. [7] A. Ashendorff, “Protection of Drinking Water Sources for Quality and Quantity—Ground Water and Surface Water, Protecting New York City’s Drinking Water Sources,” Water Supply, Vol. 18, No. 1, 2000, pp. 576-580. [8] P. M. Heisig, “Effects of Residential and Agricultural Land Uses on the Chemical Quality of Baseflow of Small Streams in the Croton Watershed, Southeastern New York,” US Geological Survey WRIR 99-4173, 2000. [9] R. J. Davies-Colley, W. N. Vant and D. G. Smith, “Col- our and Clarity of Natural waters: science and manage- ment of optical water quality,” Ellis Harwood, New York, 1993. [10] D. G. Smith, G. F. Croker and K. McFarlane, “Human perception of water appearance 1. Clarity and Colour for Bathing and Aesthetics,” New Zealand Journal of Marine & Freshwater Research, Vol. 29, No. 1, 1995, pp. 29-43. doi:10.1080/00288330.1995.9516637 [11] G. Boeuf and P. Y. Le Bail, “Does Light Have an Influ- ence on Fish Growth?” Aquaculture, Vol. 177, No. 1-4, 1999, pp. 129-152. doi:10.1016/S0044-8486(99)00074-5 [12] N. A. Azzolina, D. I. Siegel, J. C. Brower, S. D. Samson, S.D., M. H. Otz and I. Otz, “Can the HGM Classification of Small, Non-Peat Forming Wetlands Distinguish Wet- lands from Surface Water Geochemistry?” Wetlands, Vol. 27, No. 4, 2007, pp. 884-893. doi:10.1672/0277-5212(2007)27[884:CTHCOS]2.0.CO;2 [13] T. Thierfelder, “The Role of Catchment Hydrology in the Dharacterization of Water Quality in Glacial/Boreal Lakes,” Journal of Hydrology, Vol. 216, No. 1-2, 1999, pp. 1-16. doi:10.1016/S0022-1694(98)00244-3 [14] G. Blomqvist, “De-Iceing Salt and the Roadside Envi- ronment,” PhD Thesis, Royal Institute of Technology, Stockholm, 2001. [15] R. B. Jackson and E. G. Jobbágy, “From Icy Roads to Salty Streams,” Proceedings of the National Academy of Sciences, Vol. 102, No. 41, 2005, pp. 14487-14488. doi:10.1073/pnas.0507389102 [16] B. G. Mark and J. M. McKenzie, “Tracing Increasing Tropical Andean Glacier Melt with Stable Isotopes in Water,” Environmental Science and Technology, Vol. 40, No. 20, 2007, pp. 6955-6960. doi: 10.1021/es071099d [17] K. S. Linsey, S. W. Wolcott and N. B. Schoonmaker, “Identification of Potential Water-Resources-Monitoring Sites in the Croton Reservoir System, Southeastern New York,” US Geological Survey Open-File Report, Troy, 1999, pp. 97-638. [18] D. Galusha, “Liquid A ssets: A Hi story of Ne w Yo rk C ity’ s Water System,” Purple Mountain Press, New York, 1999. [19] R. W. Tiner, “Wetlands in the Watersheds of the New York City Water Supply System. Results of the National Wetlands Inventory,” US Fish and Wildlife Service, Eco- logical Services, Northeast Region, Hadley, Massachu- setts, 1996. [20] I. G. Grossman, “The Ground Water Resources of Put- nam County, New York,” New York State Water Power and Control Commission Bulletin, GW-37, 1957. [21] D. Langmuir, “Aqueous Environmental Geochemistry,” Prentice Hall, Englewood Cliffs, 1997. [22] J. J. Prucha, D. M. Scotford and R. M. Sneider, “Bedrock Geology of Parts of Putnam and Westchester Counties, New York, and Fairfield County Connecticut,” State University of New York, Map and Chart Series 11, 1968. [23] A. M. Piper, “A Graphic Procedure in the Geochemical Interpretation of Water-Analyses,” American Geophysical Union Transactions, Vol. 25, 1944, pp. 914-923. [24] R. A. Freeze and J. A. Cherry, “Groundwater,” Prentice Hall, Englewood Cliffs, 1979. [25] W. J. Mitschand and J. G. Gosselink, “Wetlands,” Van Nostrand Reinhold, New York, 1993. [26] R. W. Howarth, “An Assessment of Human Influences on Fluxes of Nitrogen from the Terrestrial Landscape to the Estuaries and Continental Shelves of the North Atlantic Ocean,” Nutrient Cycling in Agroecosystems, Vol. 52, No. 2-3, 1998, pp. 213-223. doi:10.1023/A:1009784210657 [27] J. J. Drever, “The Geochemistry of Natural Waters: Sur- face and Groundwater Environments,” 3rd Edition, Pren- tice Hall, Englewood Cliffs, 1997. [28] J. D. Hem, “Study and Interpretation of the Chemical Characteristics of Natural Water,” US Geological Survey Water-Supply Paper 2254, 1985 [29] M. Gandy, “The Making of a Regulatory Crisis: Restruc- turing New York City’s Water Supply,” Transactions of the Institute of British Geographers, Vol. 22, No. 3, 1997, pp. 338-358. doi:10.1111/j.0020-2754.1997.00338.x [30] J. M. McKenzie, D. I. Sie gel and D. O. Rosenberry, “Im- proving Conceptual Models of Water and Carbon Trans- fer through Peat,” In: A. J. Baird, L. R. Belyea, X. Comas, A. S. Reeve and L. D. Slater, Eds., Northern Peatlands and Carbon Cycling, AGU Geophysical Monograph Se- ries, Vol. 184, 2009, pp. 265-275. doi:10.1029/2008GM000821
|