Paper Menu >>
Journal Menu >>
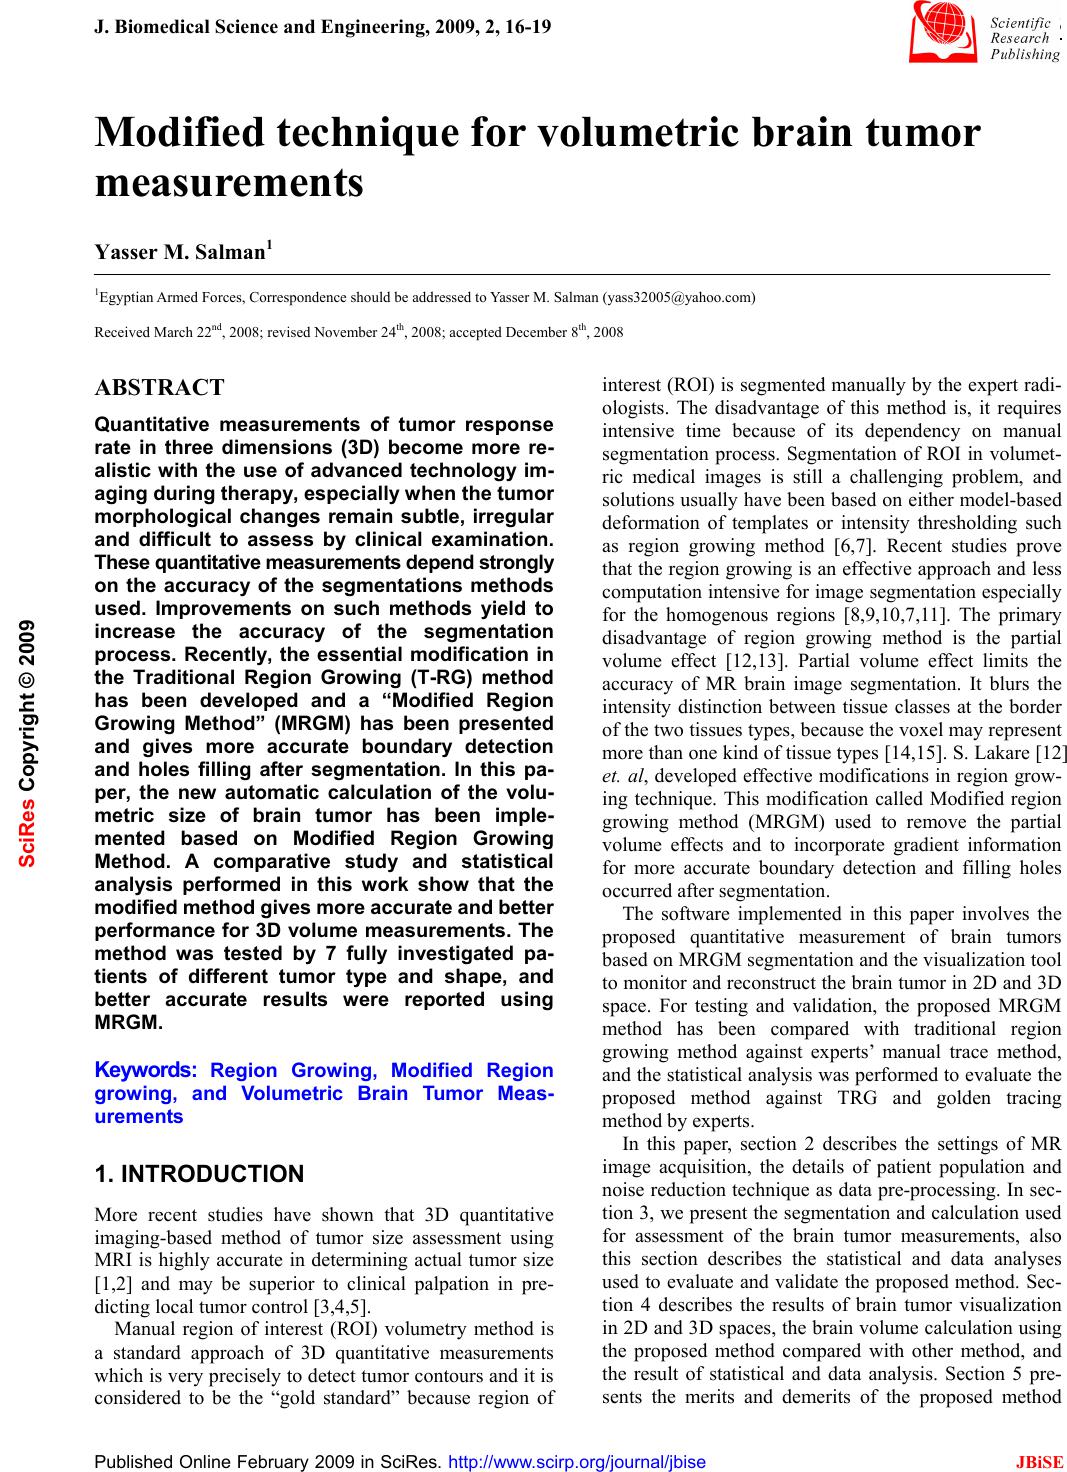 J. Biomedical Science and Engineering, 2009, 2, 16-19 Published Online February 2009 in SciRes. http://www.scirp.org/journal/jbise JBiSE 16 Modified technique for volumetric brain tumor measurements Yasser M. Salman1 1Egyptian Armed Forces, Correspondence should be addressed to Yasser M. Salman (yass32005@yahoo.com) Received March 22nd, 2008; revised November 24th, 2008; accepted December 8th, 2008 ABSTRACT Quantitative measurements of tumor response rate in three dimensions (3D) become more re- alistic with the use of advanced technology im- aging during therapy, especially when the tumor morphological changes remain subtle, irregular and difficult to assess by clinical examination. These quantitative measurements depend strongly on the accuracy of the segmentations methods used. Improvements on such methods yield to increase the accuracy of the segmentation process. Recently, the essential modification in the Traditional Region Growing (T-RG) method has been developed and a “Modified Region Growing Method” (MRGM) has been presented and gives more accurate boundary detection and holes filling after segmentation. In this pa- per, the new automatic calculation of the volu- metric size of brain tumor has been imple- mented based on Modified Region Growing Method. A comparative study and statistical analysis performed in this work show that the modified method gives more accurate and better performance for 3D volume measurements. The method was tested by 7 fully investigated pa- tients of different tumor type and shape, and better accurate results were reported using MRGM. Keywords: Region Growing, Modified Region growing, and Volumetric Brain Tumor Meas- urements 1. INTRODUCTION More recent studies have shown that 3D quantitative imaging-based method of tumor size assessment using MRI is highly accurate in determining actual tumor size [1,2] and may be superior to clinical palpation in pre- dicting local tumor control [3,4,5]. Manual region of interest (ROI) volumetry method is a standard approach of 3D quantitative measurements which is very precisely to detect tumor contours and it is considered to be the “gold standard” because region of interest (ROI) is segmented manually by the expert radi- ologists. The disadvantage of this method is, it requires intensive time because of its dependency on manual segmentation process. Segmentation of ROI in volumet- ric medical images is still a challenging problem, and solutions usually have been based on either model-based deformation of templates or intensity thresholding such as region growing method [6,7]. Recent studies prove that the region growing is an effective approach and less computation intensive for image segmentation especially for the homogenous regions [8,9,10,7,11]. The primary disadvantage of region growing method is the partial volume effect [12,13]. Partial volume effect limits the accuracy of MR brain image segmentation. It blurs the intensity distinction between tissue classes at the border of the two tissues types, because the voxel may represent more than one kind of tissue types [14,15]. S. Lakare [12] et. al, developed effective modifications in region grow- ing technique. This modification called Modified region growing method (MRGM) used to remove the partial volume effects and to incorporate gradient information for more accurate boundary detection and filling holes occurred after segmentation. The software implemented in this paper involves the proposed quantitative measurement of brain tumors based on MRGM segmentation and the visualization tool to monitor and reconstruct the brain tumor in 2D and 3D space. For testing and validation, the proposed MRGM method has been compared with traditional region growing method against experts’ manual trace method, and the statistical analysis was performed to evaluate the proposed method against TRG and golden tracing method by experts. In this paper, section 2 describes the settings of MR image acquisition, the details of patient population and noise reduction technique as data pre-processing. In sec- tion 3, we present the segmentation and calculation used for assessment of the brain tumor measurements, also this section describes the statistical and data analyses used to evaluate and validate the proposed method. Sec- tion 4 describes the results of brain tumor visualization in 2D and 3D spaces, the brain volume calculation using the proposed method compared with other method, and the result of statistical and data analysis. Section 5 pre- sents the merits and demerits of the proposed method SciRes Copyright © 2009 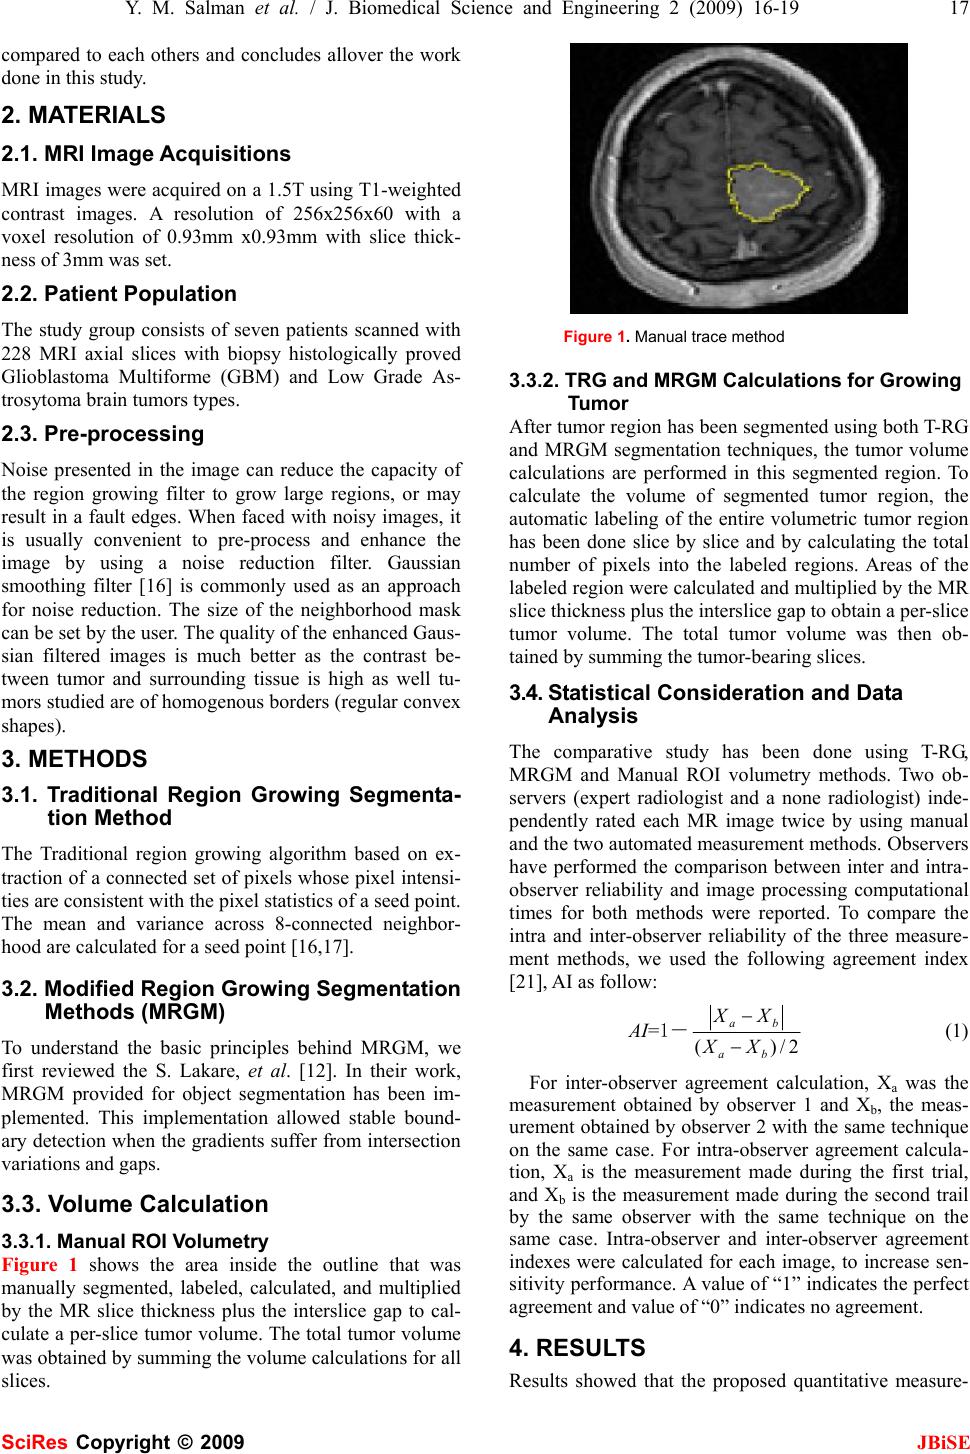 Y. M. Salman et al. / J. Biomedical Science and Engineering 2 (2009) 16-19 17 SciRes Copyright © 2009 JBiSE compared to each others and concludes allover the work done in this study. 2. MATERIALS 2.1. MRI Image Acquisitions MRI images were acquired on a 1.5T using T1-weighted contrast images. A resolution of 256x256x60 with a voxel resolution of 0.93mm x0.93mm with slice thick- ness of 3mm was set. 2.2. Patient Population The study group consists of seven patients scanned with 228 MRI axial slices with biopsy histologically proved Glioblastoma Multiforme (GBM) and Low Grade As- trosytoma brain tumors types. 2.3. Pre-processing Noise presented in the image can reduce the capacity of the region growing filter to grow large regions, or may result in a fault edges. When faced with noisy images, it is usually convenient to pre-process and enhance the image by using a noise reduction filter. Gaussian smoothing filter [16] is commonly used as an approach for noise reduction. The size of the neighborhood mask can be set by the user. The quality of the enhanced Gaus- sian filtered images is much better as the contrast be- tween tumor and surrounding tissue is high as well tu- mors studied are of homogenous borders (regular convex shapes). 3. METHODS 3.1. Traditional Region Growing Segmenta- tion Method The Traditional region growing algorithm based on ex- traction of a connected set of pixels whose pixel intensi- ties are consistent with the pixel statistics of a seed point. The mean and variance across 8-connected neighbor- hood are calculated for a seed point [16,17]. 3.2. Modified Region Growing Segmentation Methods (MRGM) To understand the basic principles behind MRGM, we first reviewed the S. Lakare, et al. [12]. In their work, MRGM provided for object segmentation has been im- plemented. This implementation allowed stable bound- ary detection when the gradients suffer from intersection variations and gaps. 3.3. Volume Calculation 3.3.1. Manual ROI Volumetry Figure 1 shows the area inside the outline that was manually segmented, labeled, calculated, and multiplied by the MR slice thickness plus the interslice gap to cal- culate a per-slice tumor volume. The total tumor volume was obtained by summing the volume calculations for all slices. Figure 1. Manual trace method 3.3.2. TRG and MRGM Calculations for Growing Tumor After tumor region has been segmented using both T-RG and MRGM segmentation techniques, the tumor volume calculations are performed in this segmented region. To calculate the volume of segmented tumor region, the automatic labeling of the entire volumetric tumor region has been done slice by slice and by calculating the total number of pixels into the labeled regions. Areas of the labeled region were calculated and multiplied by the MR slice thickness plus the interslice gap to obtain a per-slice tumor volume. The total tumor volume was then ob- tained by summing the tumor-bearing slices. 3.4. Statistical Consideration and Data Analysis The comparative study has been done using T-RG, MRGM and Manual ROI volumetry methods. Two ob- servers (expert radiologist and a none radiologist) inde- pendently rated each MR image twice by using manual and the two automated measurement methods. Observers have performed the comparison between inter and intra- observer reliability and image processing computational times for both methods were reported. To compare the intra and inter-observer reliability of the three measure- ment methods, we used the following agreement index [21], AI as follow: AI=1― 2/)( ba ba XX XX − − (1) For inter-observer agreement calculation, Xa was the measurement obtained by observer 1 and Xb, the meas- urement obtained by observer 2 with the same technique on the same case. For intra-observer agreement calcula- tion, Xa is the measurement made during the first trial, and Xb is the measurement made during the second trail by the same observer with the same technique on the same case. Intra-observer and inter-observer agreement indexes were calculated for each image, to increase sen- sitivity performance. A value of “1” indicates the perfect agreement and value of “0” indicates no agreement. 4. RESULTS Results showed that the proposed quantitative measure- 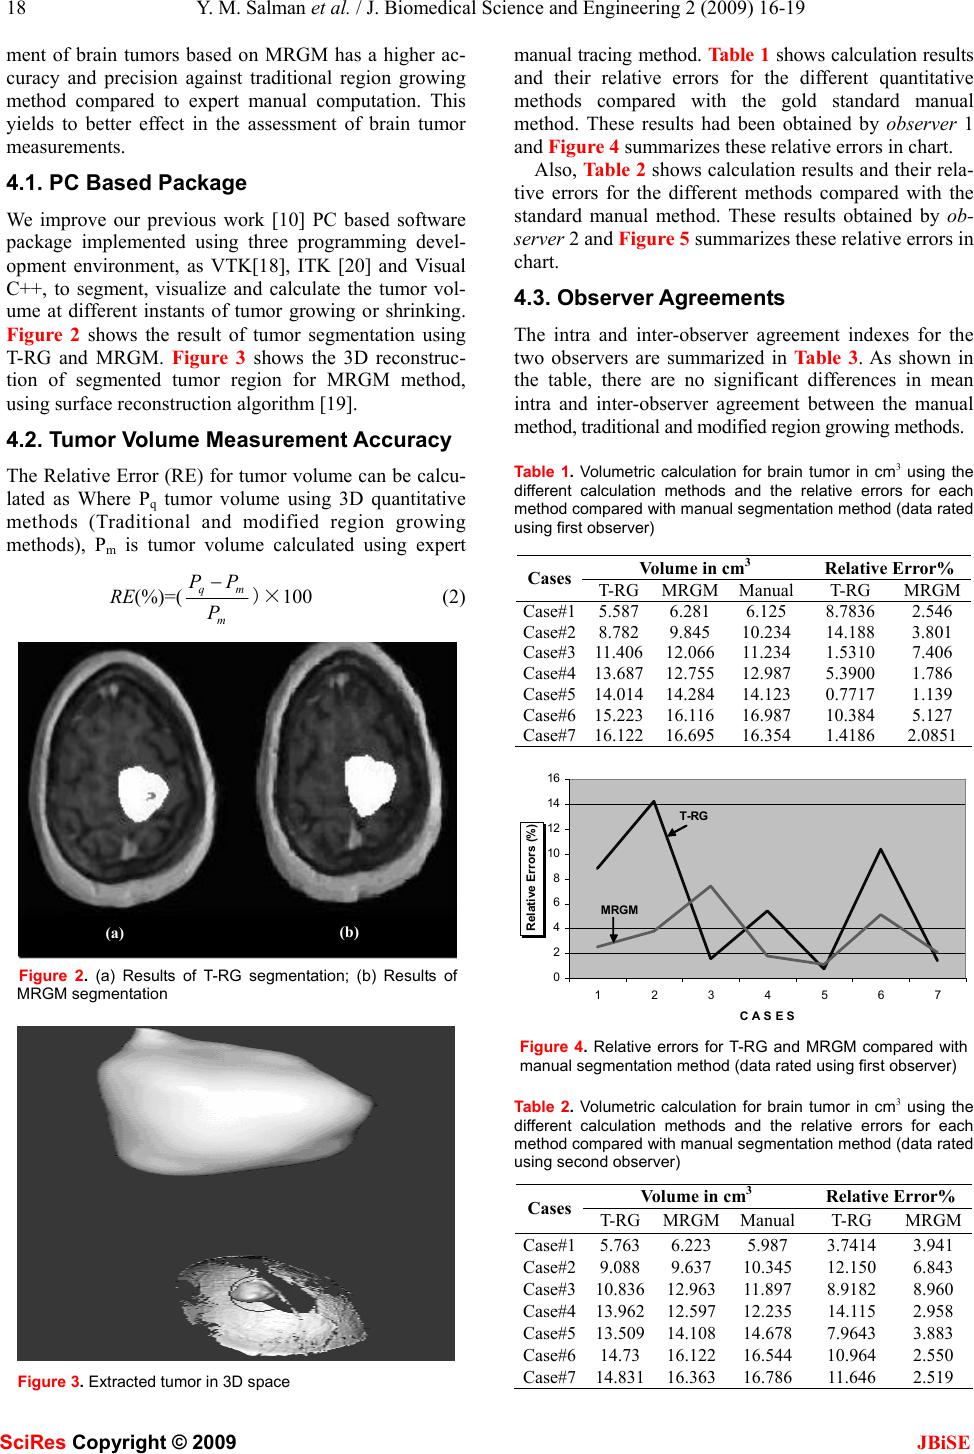 18 Y. M. Salman et al. / J. Biomedical Science and Engineering 2 (2009) 16-19 SciRes Copyright © 2009 JBiSE ment of brain tumors based on MRGM has a higher ac- curacy and precision against traditional region growing method compared to expert manual computation. This yields to better effect in the assessment of brain tumor measurements. 4.1. PC Based Package We improve our previous work [10] PC based software package implemented using three programming devel- opment environment, as VTK[18], ITK [20] and Visual C++, to segment, visualize and calculate the tumor vol- ume at different instants of tumor growing or shrinking. Figure 2 shows the result of tumor segmentation using T-RG and MRGM. Figure 3 shows the 3D reconstruc- tion of segmented tumor region for MRGM method, using surface reconstruction algorithm [19]. 4.2. Tumor Volume Measurement Accuracy The Relative Error (RE) for tumor volume can be calcu- lated as Where Pq tumor volume using 3D quantitative methods (Traditional and modified region growing methods), Pm is tumor volume calculated using expert RE(%)=( m mq P PP−)×100 (2) Figure 2. (a) Results of T-RG segmentation; (b) Results of MRGM segmentation Figure 3. Extracted tumor in 3D space manual tracing method. Table 1 shows calculation results and their relative errors for the different quantitative methods compared with the gold standard manual method. These results had been obtained by observer 1 and Figure 4 summarizes these relative errors in chart. Also, Table 2 shows calculation results and their rela- tive errors for the different methods compared with the standard manual method. These results obtained by ob- server 2 and Figure 5 summarizes these relative errors in chart. 4.3. Observer Agreements The intra and inter-observer agreement indexes for the two observers are summarized in Table 3. As shown in the table, there are no significant differences in mean intra and inter-observer agreement between the manual method, traditional and modified region growing methods. Table 1. Volumetric calculation for brain tumor in cm3 using the different calculation methods and the relative errors for each method compared with manual segmentation method (data rated using first observer) Volume in cm3 Relative Error% Cases T-RGMRGMManual T-RG MRGM Case#15.5876.2816.125 8.7836 2.546 Case#28.7829.84510.234 14.188 3.801 Case#311.40612.06611.234 1.5310 7.406 Case#413.68712.75512.987 5.3900 1.786 Case#514.01414.28414.123 0.7717 1.139 Case#615.22316.11616.987 10.384 5.127 Case#716.12216.69516.354 1.4186 2.0851 0 2 4 6 8 10 12 14 16 1234567 C A S E S Relative Errors (%) T-RG MRGM Figure 4. Relative errors for T-RG and MRGM compared with manual segmentation method (data rated using first observer) Table 2. Volumetric calculation for brain tumor in cm3 using the different calculation methods and the relative errors for each method compared with manual segmentation method (data rated using second observer) Volume in cm3 Relative Error% Cases T-RGMRGMManual T-RG MRGM Case#15.7636.2235.987 3.7414 3.941 Case#29.0889.63710.345 12.150 6.843 Case#310.83612.96311.897 8.9182 8.960 Case#413.96212.59712.235 14.115 2.958 Case#513.50914.10814.678 7.9643 3.883 Case#614.7316.12216.544 10.964 2.550 Case#714.83116.36316.786 11.646 2.519 (a) (b) 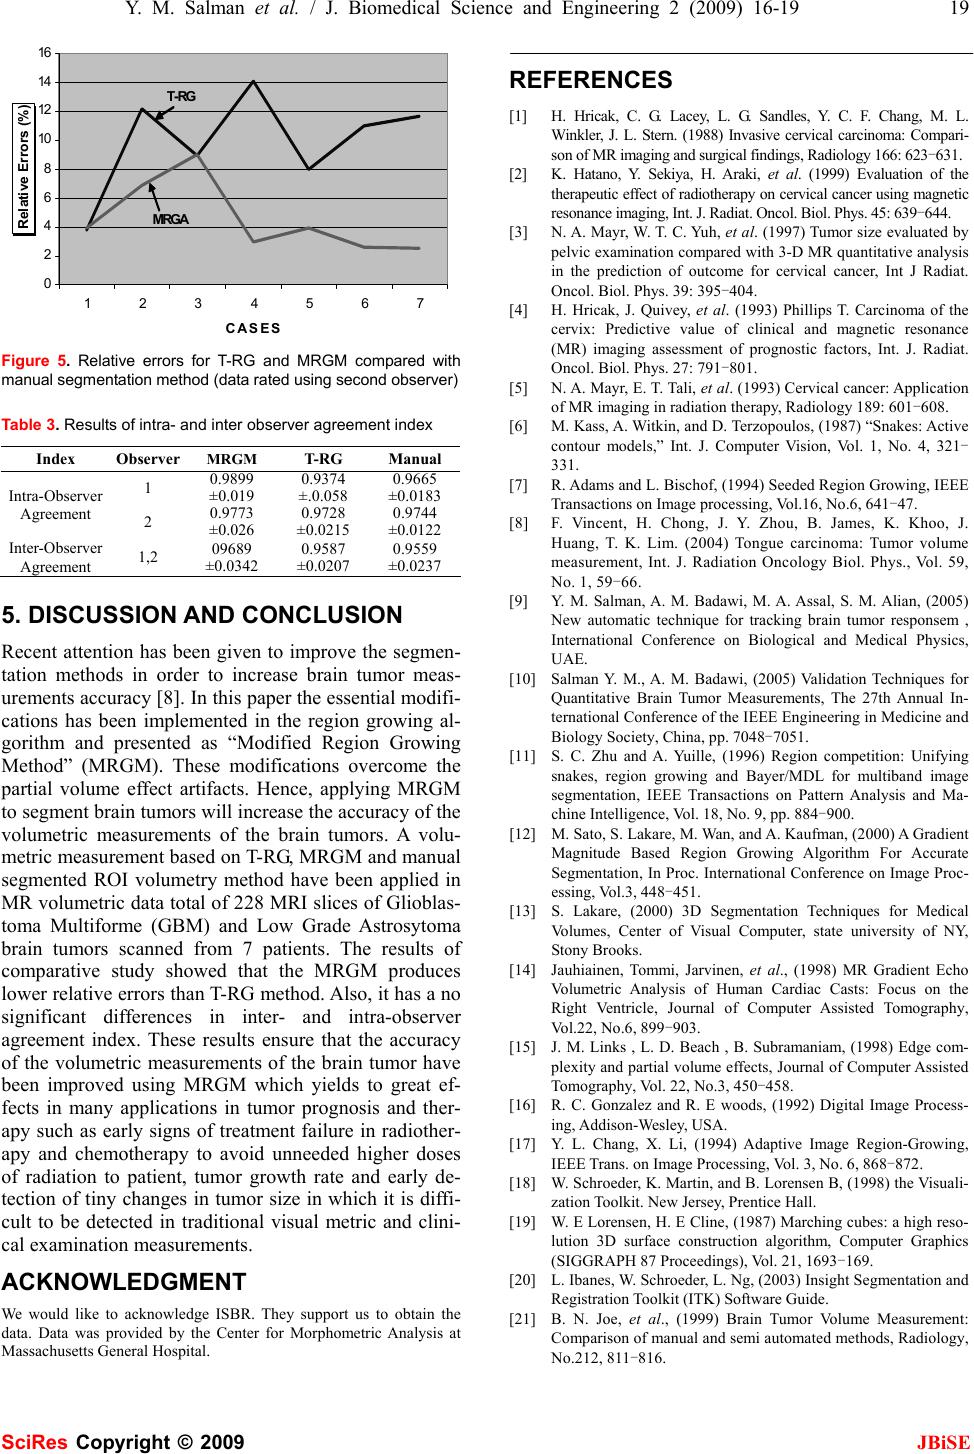 Y. M. Salman et al. / J. Biomedical Science and Engineering 2 (2009) 16-19 19 SciRes Copyright © 2009 JBiSE 0 2 4 6 8 10 12 14 16 1234567 C A S E S Relative Errors (%) T-RG MRGA Figure 5. Relative errors for T-RG and MRGM compared with manual segmentation method (data rated using second observer) Table 3. Results of intra- and inter observer agreement index Index Observer MRGM T-RG Manual 1 0.9899 ±0.019 0.9374 ±.0.058 0.9665 ±0.0183 Intra-Observer Agreement 2 0.9773 ±0.026 0.9728 ±0.0215 0.9744 ±0.0122 Inter-Observer Agreement 1,2 09689 ±0.0342 0.9587 ±0.0207 0.9559 ±0.0237 5. DISCUSSION AND CONCLUSION Recent attention has been given to improve the segmen- tation methods in order to increase brain tumor meas- urements accuracy [8]. In this paper the essential modifi- cations has been implemented in the region growing al- gorithm and presented as “Modified Region Growing Method” (MRGM). These modifications overcome the partial volume effect artifacts. Hence, applying MRGM to segment brain tumors will increase the accuracy of the volumetric measurements of the brain tumors. A volu- metric measurement based on T-RG, MRGM and manual segmented ROI volumetry method have been applied in MR volumetric data total of 228 MRI slices of Glioblas- toma Multiforme (GBM) and Low Grade Astrosytoma brain tumors scanned from 7 patients. The results of comparative study showed that the MRGM produces lower relative errors than T-RG method. Also, it has a no significant differences in inter- and intra-observer agreement index. These results ensure that the accuracy of the volumetric measurements of the brain tumor have been improved using MRGM which yields to great ef- fects in many applications in tumor prognosis and ther- apy such as early signs of treatment failure in radiother- apy and chemotherapy to avoid unneeded higher doses of radiation to patient, tumor growth rate and early de- tection of tiny changes in tumor size in which it is diffi- cult to be detected in traditional visual metric and clini- cal examination measurements. ACKNOWLEDGMENT We would like to acknowledge ISBR. They support us to obtain the data. Data was provided by the Center for Morphometric Analysis at Massachusetts General Hospital. REFERENCES [1] H. Hricak, C. G. Lacey, L. G. Sandles, Y. C. F. Chang, M. L. Winkler, J. L. Stern. (1988) Invasive cervical carcinoma: Compari- son of MR imaging and surgical findings, Radiology 166: 623-631. [2] K. Hatano, Y. Sekiya, H. Araki, et al. (1999) Evaluation of the therapeutic effect of radiotherapy on cervical cancer using magnetic resonance imaging, Int. J. Radiat. Oncol. Biol. Phys. 45: 639-644. [3] N. A. Mayr, W. T. C. Yuh, et al. (1997) Tumor size evaluated by pelvic examination compared with 3-D MR quantitative analysis in the prediction of outcome for cervical cancer, Int J Radiat. Oncol. Biol. Phys. 39: 395-404. [4] H. Hricak, J. Quivey, et al. (1993) Phillips T. Carcinoma of the cervix: Predictive value of clinical and magnetic resonance (MR) imaging assessment of prognostic factors, Int. J. Radiat. Oncol. Biol. Phys. 27: 791-801. [5] N. A. Mayr, E. T. Tali, et al. (1993) Cervical cancer: Application of MR imaging in radiation therapy, Radiology 189: 601-608. [6] M. Kass, A. Witkin, and D. Terzopoulos, (1987) “Snakes: Active contour models,” Int. J. Computer Vision, Vol. 1, No. 4, 321- 331. [7] R. Adams and L. Bischof, (1994) Seeded Region Growing, IEEE Transactions on Image processing, Vol.16, No.6, 641-47. [8] F. Vincent, H. Chong, J. Y. Zhou, B. James, K. Khoo, J. Huang, T. K. Lim. (2004) Tongue carcinoma: Tumor volume measurement, Int. J. Radiation Oncology Biol. Phys., Vol. 59, No. 1, 59-66. [9] Y. M. Salman, A. M. Badawi, M. A. Assal, S. M. Alian, (2005) New automatic technique for tracking brain tumor responsem , International Conference on Biological and Medical Physics, UAE. [10] Salman Y. M., A. M. Badawi, (2005) Validation Techniques for Quantitative Brain Tumor Measurements, The 27th Annual In- ternational Conference of the IEEE Engineering in Medicine and Biology Society, China, pp. 7048-7051. [11] S. C. Zhu and A. Yuille, (1996) Region competition: Unifying snakes, region growing and Bayer/MDL for multiband image segmentation, IEEE Transactions on Pattern Analysis and Ma- chine Intelligence, Vol. 18, No. 9, pp. 884-900. [12] M. Sato, S. Lakare, M. Wan, and A. Kaufman, (2000) A Gradient Magnitude Based Region Growing Algorithm For Accurate Segmentation, In Proc. International Conference on Image Proc- essing, Vol.3, 448-451. [13] S. Lakare, (2000) 3D Segmentation Techniques for Medical Volumes, Center of Visual Computer, state university of NY, Stony Brooks. [14] Jauhiainen, Tommi, Jarvinen, et al., (1998) MR Gradient Echo Volumetric Analysis of Human Cardiac Casts: Focus on the Right Ventricle, Journal of Computer Assisted Tomography, Vol.22, No.6, 899-903. [15] J. M. Links , L. D. Beach , B. Subramaniam, (1998) Edge com- plexity and partial volume effects, Journal of Computer Assisted Tomography, Vol. 22, No.3, 450-458. [16] R. C. Gonzalez and R. E woods, (1992) Digital Image Process- ing, Addison-Wesley, USA. [17] Y. L. Chang, X. Li, (1994) Adaptive Image Region-Growing, IEEE Trans. on Image Processing, Vol. 3, No. 6, 868-872. [18] W. Schroeder, K. Martin, and B. Lorensen B, (1998) the Visuali- zation Toolkit. New Jersey, Prentice Hall. [19] W. E Lorensen, H. E Cline, (1987) Marching cubes: a high reso- lution 3D surface construction algorithm, Computer Graphics (SIGGRAPH 87 Proceedings), Vol. 21, 1693-169. [20] L. Ibanes, W. Schroeder, L. Ng, (2003) Insight Segmentation and Registration Toolkit (ITK) Software Guide. [21] B. N. Joe, et al., (1999) Brain Tumor Volume Measurement: Comparison of manual and semi automated methods, Radiology, No.212, 811-816. |