 Engineering, 2010, 2, 290-298 doi:10.4236/eng.2010.24038 Published Online April 2010 (http://www. SciRP.org/journal/eng) Copyright © 2010 SciRes. ENG A More Precise Computation of Along Wind Dynamic Response Analysis for Tall Buildings Built in Urban Areas Shu-Xun Chen Guangxi University, Nanning, Guangxi, China E-mail: chenshx@gxu.edu.cn Received November 12, 2009; revised January 25, 2010; accepted February 4, 2010 Abstract Modern tall buildings are generally built in urban areas, where value of the terrain roughness length is much greater than that of the general terrain areas, therefore wind-induced vibrations become more pronounced. The present formulas of numerical analysis of wind-induced response become less accurate. A more accurate expression of along-wind load spectrum matrix is proposed. On the basis of the expression, structural analy- sis formula of along-wind displacement and acceleration response are developed and programmed. The ra- tionality of these formulas are illustrated in examples. Keywords: Tall Building, Wind Load Spectrum, Wind-Induced Vibration, Response Analysis, Structural Analysis 1. Introduction In modern cities, buildings get taller and more slender. The effects of wind-induced motions become more pro- nounced. Accurate prediction of structural response to wind-induced random vibrations displacement and vibra- tion acceleration at the design stage is a basis for struc- tural safety design and serviceability design of modern tall buildings. The wind-induced response consists of along-wind response, across-wind response and torsion response [1,2]. The paper focuses on along-wind re- sponse analysis firstly. Several quasi-static methods in wind codes in various countries and approximate methods based on wind tunnel studies are used to predict the wind-induced response. As a building gets taller, the wind-induced random vibra- tions becomes more violent, these methods become less reliable. So the wind-induced response of modern tall buildings should be assessed accurately by using the the- ory of random vibration. Using the numerical analysis methods of random vibration response of tall buildings, people calculate structural response according to wind load spectra. According to present literatures [2-5] whose representative is literature [3], considering that the values of terrain roughness lengths are generally very small, and the turbulence densities are also very small, square items of the turbulence component are neglected in expression The project supported by Dr Chun-Man Chan of HKUST. formula of the wind load in along-wind direction. But, for the modern tall buildings built in urban areas, the values of terrain roughness lengths are much more than ones for general buildings in general open areas. So that these items should not be neglected for tall buildings, as they are the same order values with some items that are not neglected. Otherwise, calculation results of the tur- bulence response of the tall buildings will have a large relative error. To overcome the above-mentioned error, a more ac- curate expression of wind load spectrum matrixes is proposed in this paper. This expression is especially ap- plicable to tall and other important buildings. Even an approximate form of the accurate expression is more precise than the present expression [3]. On the basis of this expression of wind load spectrum, structural analysis formulas of wind-induced displacement response and acceleration response in along-wind direction are devel- oped and programmed. The expression forms of wind load spectrum and the analysis formulas proposed in this paper are especially suitable for using the models of the structural finite element analysis of tall buildings and their results of vibration modal analysis. These analysis results of wind-induced response can be directly used in member stress analysis, structural deformation analysis and structural serviceability analysis of tall buildings. Rationality of the expression forms of wind load spec- trum and the analysis formulas proposed is shown in comparison examples.  S. X. CHEN 291 2. Expression of Wind Load Spectrum Matrix 2.1. Wind-Induced Load Vector Wind around tall building flows in a complex and ran- dom way, so the wind is a random process. Wind loads acting on windward walls are mainly caused by the steady flow and the turbulence flow. The wind speed at node i of the windward walls can be expressed as: Vi (t) = V0 i + Vr i (t) (1) where V0 i is the mean wind speed at node i , V0 i can be obtained with the following formulas: V0 i = V0 (hi /h0) (2) here V0 is standard wind speed at a reference height h0 , e.g. 10 m , = 0.12 ~ 0.30 , hi is height of node i. Vr i (t) in Equation (1) is the fluctuate wind speed at height hi, its power spectrum density S r i ( ) can be determined by fomulas of the present representative literature [3]. Because along-wind drag force is directly proportional to the square of relative wind speed, wind load acting vertically on node i of windward walls of a tall building can be expressed as: Pu i = c i a i ( /2) [ Vi (t) - U i' ] 2 = c i a i ( /2) [Vi (t) 2 - 2 Vi (t) U i' + U i' 2 ] (3) in which ci ----- ci is the drag coefficient describing the ratio of the wind load per unit area at i node and the velocity pres- sure ( /2) [ Vi (t) -U i' ] 2. a i ----- area distributed at i node; ----- air density U i' ----- along-wind displacement speed of node i . In Equation (3), since wind speed Vi (t) is much greater than the structural displacement speed U i', the high order small value U i' 2 can be undoubtedly ne- glected, then we can get Pu i ( t ) = c i a i ( /2) [Vi (t) 2 - 2 Vi (t) U i' ] (4) Let C a i = ci a i ( /2) 2 V i (t) c i a i V 0 i (5) Adding C a i to the structural damping coefficient Cs i , a total damping coefficient C i is obtained : C i = C s i + C a i (6) It is taken as the i-th diagonal element of damping matrix C of the structural dynamic equation of the tall building shown in Equation (7): K U + C U’ + M U” = P (t) (7) Then the along-wind load vector of the tall building can be expressed as: Pu (t) = {c i a i ( /2) Vi (t) 2} ( i = 1, 2, …, N ) (8) where N is the total number of structural freedom de- grees. In Equation (8), if i does not correspond to the along-wind load of the nodes of the windward walls, then ci is taken as zero. Place Equation (1) into Equation (8) : Pu (t) = { c i a i ( /2) [ V0 i + Vr i (t)] 2 } = { c i a i ( /2) [ V0 i 2 + 2 V0 i Vr i (t) + Vr i 2 (t)] } (i = 1, 2,…, N) (9) In the present literature, e.g. in page 76 of the present representative literature [3], Vr i 2 (t) is neglected, then () u t P = { c i a i ( /2) [ V0 i 2 + 2 V0 i Vr i (t)] } ( i = 1, 2, …, N ) (10) The author consider that V r I 2 (t) should not be ne- glected for tall buildings in urban areas. The author’s reason is as follows: In Equation (1), Vr i (t) is the turbulent flow speed at i node. It is a random process with a zero mean value. Its variance is determined by the following equations: r i 2 (h i) = E [ V r i 2 (t) ] = Vo i 2 I r i 2 (11) where I r i is the turbulence density at i node, it can be obtained from the following equation [3]: I r i = r i (h i) / Vo i = 1 / ln (h i/r0 ) (12) where hi is the height of i node, r0 is the roughness length of building terrain, r0 = 10 - 5 ~ 10 meter is deter- mined by the terrain type. Because most of the modern tall buildings are usually built in urban areas, roughness length r0 of urban area is about 1-10 meter [3], which is a very great value. Vr i 2 (t) is not much less than V0 i 2 , for instance, when r0 = 3 m and h i = 22 m, then I r i = r i (h i) / Vo i = 0.5. In Equation (11), r i 2 (h i)= E [ V r i 2 (t) ] = Vo i 2 I r i 2 = 0.25 Vo i 2 . When h i = 22 m, the relationship curve of I r i 2 and r0 is showm in Figure 1: It is shown in the The relationship curve in Figure 1 that I r i 2 of tall buildings in urban area of is much more Figure 1. The relationship curve of I r i 2 and r0. Copyright © 2010 SciRes. ENG  S. X. CHEN 292 than one of general buildings in open area. Considering Equation (11), Vr i 2 (t) of Equation (9) can not be ne- glected, and Equation (10) with Vr i 2 (t) neglected can only be applied to buildings built in general open terrain. For modern tall buildings in urban areas, Equation (10) will cause a large relative error. 2.2. Wind Load Correlation Matrix Correlation matrix of the wind load vector shown as Equation (9) is R P u ( ) = E [ Pu (t) Pu T (t + ) ] (13) Its element of row i, column j is: R Pu i j () = c i c j a i a j ( /2) 2 E { [ V0 i + Vr i (t)] 2 [ V0 j + Vr j (t + )] 2 } = c i c j a i a j ( /2) 2 E [ Vo i 2 Vo j 2 + 2 Vo i 2 Vo j Vr j (t + ) + 2 Vo i Vo j 2 Vr i (t) + Vo i 2 Vr j 2 (t + ) + Vo j 2 Vr i 2 (t) + 4 Vo i Vo j Vr i (t) Vr j (t + ) + 2Vo i Vr i (t) Vr j 2 (t + ) + 2Vo j Vr i 2 (t) Vr j (t + ) + Vr i 2(t) Vr j 2 (t + )] (14) Because V r i (t) and Vr j (t + ) are stationary ergodic normal distributive random processes [2,5,6], then E [ V r i (t)] = E [ V r j (t + )] = 0 (15) E [ Vr i 2(t)] = r i 2 (16) E [ Vr j 2 (t + )] = r j 2 (17) E [ Vr i (t) V r j (t + )] = R r i j ( ) (18) E [ Vr i 2 (t) Vr j (t + )] = E [ Vr i (t) Vr j 2 (t + )] = 0 (19) E [ Vr i 2 (t) Vr j 2 (t + ) ] = r i 2 r j 2 + 2 R r i j 2 ( ) (20) Then Equation (14) can be: R Pu i j ( ) = c i c j a i a j ( /2) 2 [ Vo i 2 Vo j 2 + Vo i 2 r j 2 + Vo j 2 r i 2 + r i 2 r j 2 + 4 Vo i Vo j R r i j ( ) + 2 R r i j 2( ) ] (21) Considering Equation (12), the element of row i, col- umn j of the correlation matrix of the wind load can be obtained: R Pu i j ( ) = c i c j a i a j ( /2) 2 [ Vo i 2 Vo j 2 (1 + I r i 2 + I r j 2 + I r i 2 I r j 2) + 4 Vo i Vo j R r i j ( ) + 2R r i j 2( ) ] (22) In the present literature [3], Vr i 2 (t) of wind load is ne- glected as Equation (10), then the correlation matrix shown in Equation (13) is ( )[() ( ) ] T u u u = E t t + P RPP (23) The element of of row i, column j of the correlation matrix of the wind load is ( ) P u i j R = c i c j a i a j ( /2) 2 [ Vo i 2 Vo j 2 + 4 Vo i Vo j R r i j ( )] (24) Comparing Equation (24) and Equation (22), their relative error is a quite large for modern tall buildings built in urban areas. 2.3. Wind Load Spectrum Matrix From Equation (22), a spectrum matrix of the wind load vector can be obtained: S P u ( ) = [1 / (2 )] R P u ( ) ej d (25) Its element of row i, column j is: S P u i j ( ) = [1 / (2 )] R Pu i j ( ) ej d (26) Placing Equation (22) into Equation (26), the result is: S P u i j ( ) = c i c j a i a j ( /2) 2 [ Vo i 2 Vo j 2 ( 1 + I r i 2 + I r j 2 + I r i 2 I r j 2 ) ( ) + 4 Vo i Vo j S r i j ( ) + 2 S r i j ( ) S r i j ( )] (27) in which the symbol expresses Duhamel integral, ( ) is the - function: ( ) = [1/(2 )] ej d (28) and S r i j ( ) = [1/(2 )] R r i j ( ) ej d (29) S r i j ( ) is a cross-spectrum of turbulent wind velocity, which can be obtained from literature [2,12]. A good approximate expression of Equation (27) is S P u i j ( ) = c i c j a i a j ( /2) 2 [ Vo i 2 Vo j 2 ( 1 + I r i 2 + I r j 2 ) ( ) + 4 Vo i Vo j S r i j ( )] (30) In the comparison example in this paper, relative error of Equation (30) and Equation (27) will be discussed. If Vr i 2 (t) of Equation (9) is neglected as Equation (10), then the element of row i, column j of the wind load spectrum matrix is: () P u i j S = c i c j a i a j ( /2) 2 [ Vo i 2 Vo j 2 ( ) + 4 Vo i Vo j S r i j ( )] (31) Comparing with Equation (31), the approximate ex- pression Equation (30) has more items (I r I 2 +I r j 2), which is the same order value as the item corresponding Copyright © 2010 SciRes. ENG  S. X. CHEN 293 E [ Uu 2 ( t ) ] = R u (0) =S u ( ) d (36) Its N diagonal elements are mean square values of the displac d They are marked as a vector u. It includes the follow- in i-thmegree. It is obtained from the following eq in which S P u m n ( wEqua (2 In Equatin (37 static translation response. Its i-th element is the square egree. It ( /2) 2 V o m 2 Vo n 2 / u 4 (39) In 7), u 2 iector of the dynamndomb Its i-th elem vi {[ V2 Vo n 2 ( I r m 2 +I r n 2 +I 2 I r n 2 )] / u 4 + ( ) 2 V S ) 2 S ( ] d (40) in which S r m n ( ) is shown as Equation (29). For cce oion, tion (27 as i dom vi { [ Vo m 2 Vo n 2 ( I r m 2 + I r n 2 )] / 4 + H ( ) 2 4 V V( ) d } (41) to 4 Vo iVo j S r i j ( ), and should not be neglected. Their necessity is shown in the following formulas of wind-induced response analysis. 3. Wind-Induced Response Analysis Wind-induced structural responses in along-wind direc- tion include a static part, i.e. an along-wind translation, and a dynamic part, i.e. an along-wind random vibration. The along-wind translation is mainly caused by the steady flow. The along-wind vibration is caused by the turbulent flow. The along-wind random vibration in- cludes a quasi-steady background turbulence response to low frequency component and a narrow-band resonant response. 3.1. Displacement Response Analysis According to the analysis method of random vibration response, the calculation formula of spectrum matrix of the displacement response vector can be expressed as: S u ( ) = Hu ( ) S P u ( ) Hu * ( ) (32) in which the spectrum matrix of wind-induced load SPu( ) is shown as Equation (25), Hu*( ) is the conju- gate matrixes of frequency response matrix Hu ( ), and Hu ( ) = u H u ( ) u T (33) In which u and Hu ( ) are the natural vibration shape and the frequency response function of the lower along-wind vibration model respectively. The relationship between the vibration shape and mass matrix is u T M u = M u* = 1. Hu ( ) can be obtained from the following formula: Hu ( ) = 1 / [( u 2 - 2) + j 2 u u ] (34) in which u and u are the natural frequency and damp- ing of the lowest along-wind vibration model. The element of row i, column j of the displacement spectrum matrix shown in Equation (32) is: S u i j ( )= i u j u m u n u Hu ( ) 2 SP u m n ( ) (35) m N 1n N 1 In which i u is the i-th element of vibration shape u of the along-wind vibration mode. SP u m n ( ) is shown as Equation (27). Hu ( ) is the absolute value of the frequency response functions of the along-wind vibration mode shown in Equation (34). According to the response analysis theory of random vibration, the across mean square value matrix of the displacement response is: ement response of the N noe freedom degrees. 2 g two parts: u 2 = u 2 + u 2 (37) its i-th element is the mean square value of displacement response of the freedo d uation: u i 2 = Su i i ( ) d = i u 2 N N m u n u m1 ) d n1 Hu ( ) 2 SP u m n ( (38) ) is shon as tion 7). o ), u 2 is the square value vector of the value of the static translation of the i-th freedom d is u i 2 = i u 2 N N m u n u c m cn am an m1n1 Equation (3s the mean square value v ic ra viration displacement response. ent is the mean square value of the random bration displacement of the i-th freedom degree. It is u i 2 = i u 2 m N 1n N 1 m u n u c m cn am an ( /2) 2 o mr m Hu [4 o m Vo nr m n ( + r m n( ) S r m n ) } onvenienf computat SP u m n ( ) of Equa- ) can be takents approximate form shown in Equation (30). So the mean square value of the ran bration displacement of the i-th freedom degree of the tall building u i 2 becomes: u i 2 = i u 2 m N 1n N 1 m u n u c m cn am an ( /2) 2 u u o mo n S r m n Copyright © 2010 SciRes. ENG  S. X. CHEN 294 Considering: Hu ( ) 2 S r m n ( ) d Hu (0) 2 S ) 2S rm n / u+S ( )[ /(2 3)] (42) w1 / ( u rmn is cross correlation. By convention of the present repre- sen r of the i-th freedom degree. It is shl Vo m 2 Vo n 2 ( Ir m 2 +Ir n 2 ) / u 4 + i u c cn am an ( /2) 2 Vo n H2 2 Vo m Vo n( Ir m+ Ir n 2 + 4 rm n Ir m Ir n ) / u 4 (44) In Equation 3), 2s corresponding t the dynamhe i-th freedom degree. It is shown as: o n u m o m Vo n S r m n ( u )[ / (2 u u 3 )] If the quasi-static turbulent ground displacement re- sponse ted according to the unreasonable approximate Equation (31) as the pr re r m n ( ) d + Hu ( r m n ( ) d u u 4 r mr nr m n u u u here Hu ( u) 2 = 2 u u 2 ) 2, = u tative literature [3], u i 2 of Equation (41) can be di- vided to the following two pats: u i 2 u b i 2 + u r i 2 (43) in which u b i 2 is corresponding to the quasi-static tur- bulent ground displacement response own as folows: u b i 2 = i u 2 m N 1n N 1 m u n u cm cn am an ( /2) 2 2 N m1n1 m u n u m N 4 Vo mu (0) S r m n ( ) d = i u 2 m u n u cm cn am an ( /2) m N 1 22 n N 1 2 (4 u r i io ic turbulent resonant displacement response of t u r i 2 = i u 2 m N 1n N 1 m u n u cm cn am an 2 Vo mV Hu ( ) 2 S r m n ( ) d u u = i u 2 m u n ccn am an 2 V m N 1n N 1 (45) of Equation (44) is calcula esent presentative literature [3], then it is u b i 2 = i u 2 m N 1n N 1 m u n u cm cn am an ( /2) 2 4 Vo m Hu (0) 2 S r m n ( ) d Vo n n u 2 Vo mVo n( 4 rm n Ir m Ir n ) /( u 4 ) 6) In Eqo 44mparing the relative values of the two iteit is obvious that the items corresponding to ( Ir i 2 +Ir j 2 ) of Equa (3 ed acceleration response of a tall building alues. Similar to ue of accelera- H ( ) 2 S P u m n ( ) d m u cn am an ( /2) 2 = i u 2 N m u cm cn am an ( /2) m 1 2 2 n N 1 (4 uatin (), Co ms (4 rm n I r m I r n and I r m 2 + I r n 2), tion 0) can not be neglected as Equation (31), since the neglecting will cause a 50% or much higher relative error for the quasi-static turbulent ground displacement re- sponse. 3.2. Acceleration Response Analysis ind-inducW are random values with zero mean v quation (37)-(40), the mean square valE tion response of the i-th freedom degree can be calcu- lated as: u” i 2 = i u 2 N N m u n u 4 m1n1 u = i u m1n1 n u c m 2 N N 4 H u ( ) 2 { m 2 n 2 2 + I r n 2 + I r m 2 I r n 2] ( ) + 4 Vo m Vo n S r m n ( ) S r m Consi 2 2 4 H u ( + 2 S r m n ( ) S r m n ( )] d (48) Its approximate expression is shown as follows: Vo Vo [ 1 + I r m + 2n ( ) S r m n ( ) } d (47) 4H 2 = 0, can get dering u ( ) = 0 when u” i = i u m n 1 m u n u c m cn am an ( /2) 2 N 1 N ) 2 [ 4 Vo m Vo n S r m n ( ) Copyright © 2010 SciRes. ENG  S. X. CHEN 295 u” i 2 i u (49) nce to Equa ocalculated as: u” is now widely accepted that wind-induced accelera- tion response has become the standard for the service- abity an of motiopelildings. So is of an important a 4. = m u n u c m cn am an 2 2 m N 1n N 1 Vo m Vo n 4 H u ( ) 2 S r m n ( ) d With referetin (42), it can be i 2 i u 2 m u n u c m cn am an 2 m N 1n N 1 Vo m Vo n S r m n ( 1 ) [ u /( 2 u ) ] (50) It lievalution rception in tal bu Acceleration response analysis of tall buildings nd practical significance Example Structure of a certain tall building is described as a 50-storey of 7-bay by 10-bay framework with 2550 nodes and 5100 members shown in Figure 2. Figure 2. 3D model of the example building A bay width is 4.57 m and a storey height is 3.66 m. Details of the framework are shown in its plan view in Figure 3 and elevation views in Figure 4 and 5. The framework consists of exterior moment frames and a braced core, which are rectangles with the same centre. All beams and columns are rigidly connected while the diagonal braces are simply connected. Two-storey K- bracing modules are used on both the south and north faces of the core, as shown in Figure 4. Single-storey knee- bracing is used in the west and east faces of the core as shown in Figure 4. Figure 3. Plan view of the example Figure 4. A-A view and drag coefficients c i Copyright © 2010 SciRes. ENG  S. X. CHEN Copyright © 2010 SciRes. ENG 296 Figure. 5 B-B view Figure 6. a-a view Figure 7. b-b view The floors between the exterior frames and raced core are rigidkg /m3, which isework are calculated. American AISC standard sections are used to size the members: Beams are W24 103 shapes, di- agonals are W14 90 shapes, and columns are also W14 233 shapes except that the cruciform columns in the core (See Figure 3) use pairs of two W14 233 shapes ori- ented perpendicular to each other. e reference height h = 10 m, the designed wind speed at and third frequencies of natural vibration are given out. They are correspond- ing the bending vibration on X-direction, the bending vibration on Y-direction and the twist vibration of the tall building respectively. Firstly, through the modal analysis, the lowest fre- quency and its vibration shape are obtained. They are corresponding to the bending vibration in along-wind direction, i.e. X-direction. Its circular frequency is u = 0.86572 rad/s, its natural frequency is 0.13778 hertz. In Table 2, the translation values of the bending vibra- tion shapes on X-direction (along-wind direction) are listed. The relationship between the vibration shape and mass matrix are u T M u = Mu* = 1. Because the floors be- tween the exterior frames and braced core are rigid, the translation values at all nodes of the same storey are the same. Table 1. Natural frequencies mode number circular frequency frequency (hertz ) period (sec) The parameters about wind load are given as follows: th 0 the reference height V h0 = 30.0 m /s 2, the roughness length of building terrain r0 = 2 m, for Equation (11) and Equation (12), I r i = r i (h i) /Vo i > 17.4% at nodes over 22 meters. Non-dimensional decay constants Cy = C z = 10.0 which is employed when cross-spectrums of turbulent wind are calculated, The drag coefficients c i of surface nodes in along-wind direction are shown out as Figure 4. In Table 1, the first, the second b . Mass density of the tall building is 150 employed when node masses of this fram 1 8.6572E-01 8.6572E-01 7.2577E+00 2 9.6824E-01 1.5410E-01 6.4893E+00 3 1.2926E+00 2.0573E-01 4.8608E+00 Table 2. The bending vibration shapes in along-wind direction Storey X-translation Storey X-translation Storey X-translation Storey X-translation StoreyX-translation 1 .14613E-05 11 .44215E-04 21 .11164E-03 31 .18569E-03 41 .25427E-03 2 .40615E-05 12 .50177E-04 22 .11898E-03 32 .19293E-03 42 .26052E-03 3 .70606E-05 13 .56396E-04 23 .12639E-03 33 .20013E-03 43 .26670E-03 4 .10390E-04 14 .62780E-04 24 .13381E-03 34 .20722E-03 44 .27271E-03 5 .14206E-04 15 .69378E-04 25 .14127E-03 35 .21426E-03 45 .27865E-03 6 .18365E-04 16 .76104E-04 26 .14871E-03 36 .22117E-03 46 .28442E-03 7 .22932E-04 17 .83006E-04 27 .15618E-03 37 .22803E-03 47 .29012E-03 8 .27790E-04 18 .90002E-04 28 .16360E-03 38 .23473E-03 48 .29567E-03 9 .33000E-04 19 .97138E-04 29 .17102E-03 39 .24137E-03 49 .30121E-03 10 .38456E-04 20 .10434E-03 30 .17836E-03 40 .24786E-03 50 .30640E-03  S. X. CHEN 297 espoTable 3. The wind-induced r Storey u i 2 (m 2) u b i2 (m 2) nse in along-wind direction u b i2 (m 2) u r i 2 (m 2) u i2 (m 2) u” i 2 (m 2/Sec4) 5 245014E-02 .533741E-03 .231407E-03 .571563E-02 .869952E-02 .321051E-02 10 .179546E-01 .391125E-02 .1695 15 .584374E-01 .127301E-01 .5519 20 .132175E+00 .287931E-01 .1248 25 75E 21E 35E .242297E+00 .527821E-01 .228841E.565224E+00 .860303E+00 .317490E+00 78E-01 .90098.506087E+00 00E-01 8E.197.70 44E-01 .173994E 331E-01 .219907E 49E+00 .265888E.40469 -02 .418841E-01 .637499E-01 .235266E-01 -02 .136322E+00 .207489E+00 .765727E-01 -01 .308335E+00 .469303E+00 .173194E+00 -01 30 .386227E+00 .841360E-01 .3647 35 .557352E+00 .121414E+00 .5264 40 .745866E+00 .162480E+00 .7044 1E+00 .137134E+01 .13001+01 895E+01 3319E+00 +01 .264828E+01 .977335E+00 45 .942683E+00 .205355E+00 .890 50 .113979E+01 .248293E+00 .1076 +01 .334711E+01 .123523E+01 +01 6E+01 .149351E+01 According to Equation (39), Equation (44), Equa- tion (46), Equation (45), Equ (50), we respectively calculate c risln mean ahe qut ground displacem u b i thee vuf threaproturt gr diespon ation (38) and Equation d the mean square value of the statitanslation dpaceme t response u i 2, the squ re value of t ent response asi-static turbu 2 , len mean squarale o e unsonable apximate quasi-static bulen oundsplacement rse u b i 2 accordi ng e unreasonable approximate Equation (31), the mean sq valdynmunan placement eu r i 2meluee total displacemenn u i 2 an sqre vaion eons u” i nsieg one ree loncye meana Ta l paring the s of 2 and to th uareue of the aic trbulent resot dis- rsponse , the an square va of th t respo he accelerat se r sp and the me e 2. Co ua d rinlue of t ly thsponse to thwest resonant freque, thes squ Com re values are listed in value be 3. u b i u b i 2of Table 2, th rlati ei reve error is ( u b i 2 – u b i 2) / u b i 2 = 130.6%. E u b ven ( i – u b i) / u b i = 51.8 st supports the above-mentioned corresponding to (I r i 2 + I r j 2) of Equation (30) can not be ne as Equ for tags, since the negting will c or mrelat error for u b i 2. 5. Conclusions For mon tall buin urbth a ger rouess lengts ofed r dom viions becompronoe squa item of turbulence Vr i 2 tion can notneglected In thper, a ong- wind lotrum. Onthis pressiorm, analla ofed d placement and acceleration responsend rection arevelopeammed As the present usual expression of along-wind load turbulence component, even accurate expression proposed ccan texp n- ly sup. en e Factors,” Journal o ctur asio1-34. . Dart, “n Spectrum of Horizontal inesr th High Winds,” 1963, pp. 211 yrbd S “WiLoac- . 06. . Thorton, Ll., Omizll Structures for Wind Loading ,” Journal of W ing erod36, 1990, p nlan, “Wind Effcts on Structrures: A Introduction to Wind Engineering,” John Wiley & Sons ork, 198 P. SForceng,” Pss, Oxford, 1978, pp. 12-88. A. Pupleace, “Probability Proucating, 18. L. ervic Statnd Load, eel Con B. Jal., Damnd Stiffness in Th ture of Wring ial Aerodynamics [10] Ad Hoc Committee on Serviceability Research, “Struc- turaty: Araisach Nee f Strueringo. 12, 6-266 %. This factrongly conclusion that the items [5] E. Simiu and R. H. Sca glectedation (31)ll buildin lecause a 50%uch higher ive [6] derldings built ian areas wilar-[8] ghnth, the effec wind-inducan- brate more component unced. Th (t) of Equa re (9) [9] be . is pa ad spec more accurate expression of al is proposed the basis of ex- n foysis formu wind-inducis- in along-wi . di- e dd and progr neglects the square item of an approximate form of the is more aurate th he present ressio. The exam ple strong ports this conclusion 5. Referces [1] A.G. Davnport, “Gust Loadingf the Strual Divn, 1977, pp. 1 [2] A.G Gust venpo s Nea The Predictio e Ground in 194-. [3] C. D tures,” John Wiley ye an. O. Hansen, & Sons Inc., New York, 1 nd ds on Stru 996, pp 49-1 [4] C. H. Joseph, et a“ptiation of Ta ind Engi- neerand Aynamics, Vol. p. 235-244. Inc., New Y6. achs, “Wind in Engineeriergamon Pre [7] , Random Variable and Random cess”, High Edion Press, Beij983, pp. 18-4 G. Griffis, “S ” Engineering Journal of Am eability Limit erican Institute of S es Under Wi t struction, 1993, pp. 23-28. . Vickery, et e Reduction of “The Role of Wind Effects ping, Mass a on Struc- s,” Journal ind Engineeand Industr , Vol. 11, 1983, pp. 265-294. l Serviceabili Critical Appl and Resear d”, Journal o 1986, pp. 264 ctural Engine 4. , Vol. 112, N Copyright © 2010 SciRes. ENG  S. X. CHEN 298 1] D. Surry and E. M. F. Stopar, “Wind Loading of Large Studies at the Laboratory of Building Physics,” KU Leu- ven, 2002, pp. 36-66. Data: Comparing [1 Low Building,” Journal of Civil Engineering, Vol. 16, 1989, pp. 526-542. [12] F. K. Chang, “Human Response to Motions in Tall Build- ing,” Journal of Structural Division, Vol. 99, 1973, pp. 1259-1272. [13] B. Blocken, et al., “Wind, Rain and the Building Envelope: [14] L. M. Fitzwater and S. R. Winterstein, “Predicting Design Wind Turbine Loads From Limited Random Process and Random Peak Models,” Journal of Solar Energy Engineering, Vol. 123, No. 4, 2001, pp. 364-371. Copyright © 2010 SciRes. ENG
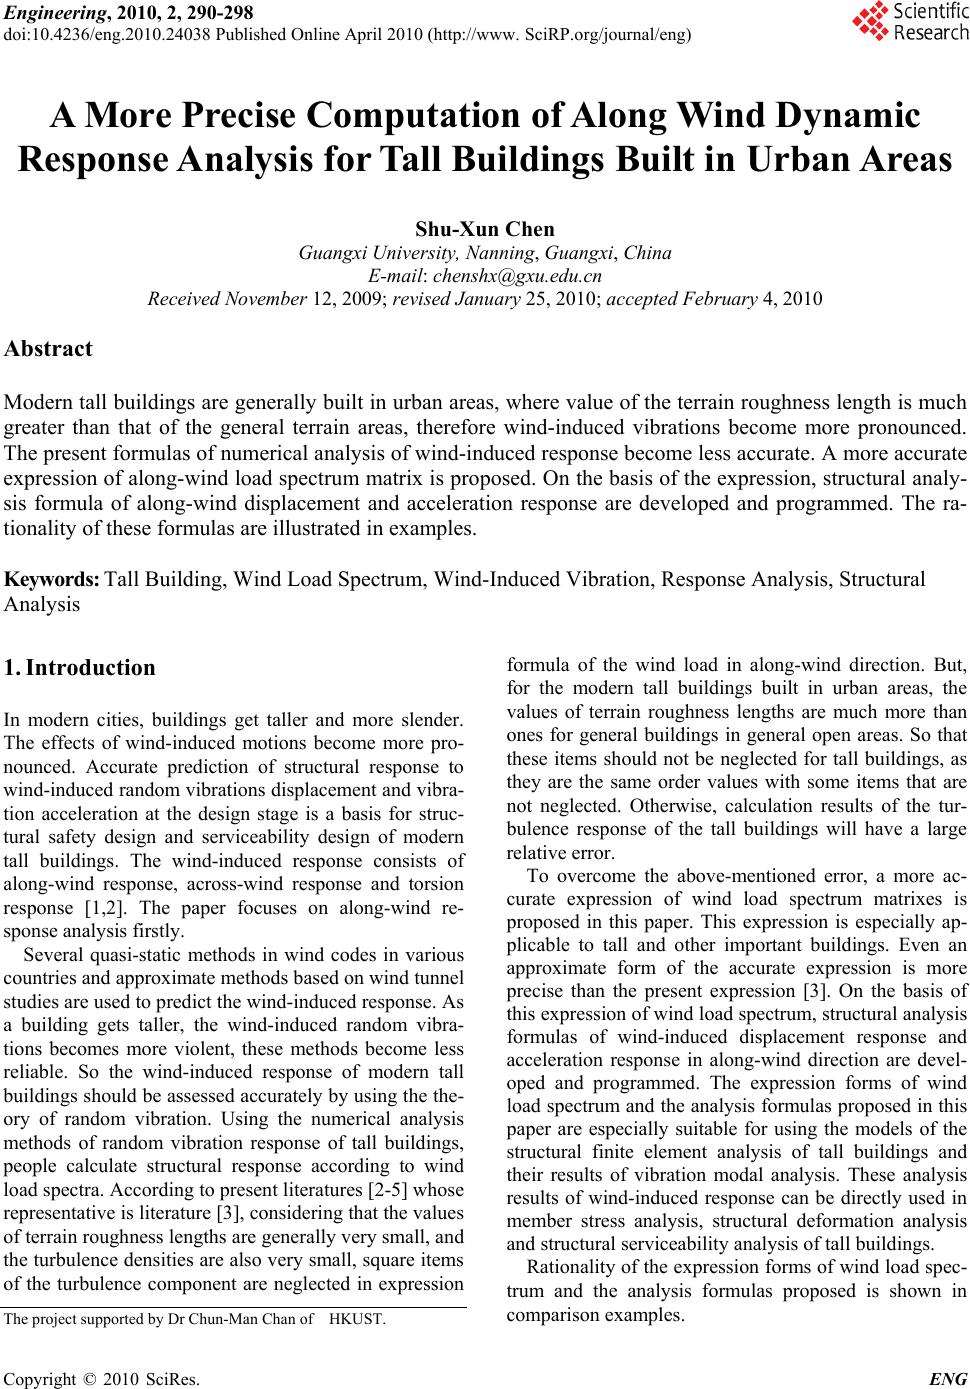
|