Paper Menu >>
Journal Menu >>
 Vol.2, No.4, 381-389 (2010) Health doi:10.4236/health.2010.24057 Copyright © 2010 SciRes. Openly accessible at http://www.scirp.org/journal/HEALTH/ Influence of production processes in quality of fermented milk “Laban” in Lebanon Zeineddine Mayssoun1, Nassif Nadine2 1National Beverage Company, Quality Department, Choueifat, Lebanon; misso_zd@hotmail.com 2Lebanese University, Faculty of Agricultural Sciences, Environmental Department, Dekwaneh, Lebanon; nadinenassif3@hotmail.com Received 6 December 2009; revised 20 January 2010; accepted 25 January 2010. ABSTRACT Yoghurt (Laban) is one of the most consumed food products in Lebanon. Thus its quality has given a concern. In this study, the sensory, chemical and rheological properties of com- mercial and traditional samples were investi- gated in order to characterize this fermented milk. Hence, Laban samples were collected from 14 areas in Lebanon; especially from moun- tainous regions and from the capital Beirut. Forty-two samples were prov ided by processing industry whether at small, medium, or large scale. A statistical analysis was carried out, and thus sensory and physicochemical properties were subjected to two approaches of variance analysis. Pearson correlation coefficients be- tween attributes were also calculated. Both, the analyses of variance and correlations were conducted using SPSS 3. The physicochemical analysis and the microbiological analysis ex- hibit a significant effect of the date, and the manufacturing process. Also, the instrumental data showed no significant correlation between physicochemical and microbiological parame- ters, which indicates that they are completely independent. Moreover, the general apprecia- tion of descriptive sensory analysis of products display that this appreciation is not dependant on the production process. It is also noticed that some sensory characteristics can be dread by instrumental measures. This research en- dorses the essential role of quality control for the manufacturing of yoghurt in Lebanon. Keywords: Laban; Rheology; Manufacturing Process; Sensory Analysis; Lebanon 1. INTRODUCTION Yoghurt (Laban) is one of the most consumed prod- ucts in Lebanon. It is obtained through lactic acid fer- mentation of heat-treated milk by Streptococcus ther- mophillus and Lactobacillus bulgaricus at 40-45℃ [1]. The annual consumption of Laban is approximately 20 Kg per capita in Lebanon [2]. Laban may be prepared from full fat milk or low fat milk, but it must conform to the different standards set by the government re- garding its fat and total solids content [3]. The possibility of using some artisanal strains as starter for the development of fermented milks with characteristics similar to traditional products, at an in- dustrial scale, is very promising. However their potential use depends on further assessment of their aptitude to be reproduced by fermentation and preserved by freezing and/or by freeze drying. Moreover, these strains should first be tested in mixed cultures, in order to obtain fer- mented milks with rheological and flavor characteristics similar to those of artisanal products. In Lebanon, Laban is manufactured by both industrial and small traditional producers. Lately in Lebanon, a number of yoghurt factories have been developed. There is an obvious competition between these factories con- sidering mainly, in addition to production rate, the qual- ity control. Quality and reproducibility of fermented milks and processes are ensured by using industrial starters. Nevertheless, consumers prefer traditional fer- mented milks since artisanal starters give these products more typical flavors [4], where small producers inocu- late the milk with an artisanal starter obtained from the previous day’s preparation. The production of yoghurt is a very classical proce- dure that does not necessitate variations. However, post fermentation handling is a very critical to induce desir- able properties to the product. Indeed, the Laban, being a highly consumed product in Lebanon, its need to have produced under hygienic conditions to be more widely available to the consumer, prior to becoming too acidic and to avoid any texture modification. Milk testing and quality control is an essential com- ponent of any milk processing industry whether small, medium or large scale. Milk being made up of 87% wa- ter is prone to adulteration by unscrupulous middlemen  Z. Mayssoun et al. / Health 2 (2010) 381-389 Copyright © 2010 SciRes. Openly accessible at http://www.scirp.org/journal/HEALTH/ 382 and unfaithful farm workers. Moreover, its high nutritive value makes it an ideal medium for the rapid multiplica- tion of bacteria, particularly under unhygienic produc- tion and storage at ambient temperatures. We know that, in order for any processor to make good dairy products, good quality raw materials are essential “Quality, it starts at the farm”. Different technological and microbi- ological parameters have been reported to influence yo- ghurt quality: composition, heat treatment of milk, con- ditions of incubation (temperature and pH) and storage (temperature and duration) [5-7]. Yoghourt is a very prominent media for yeast. Even though pasteurization eliminates them from raw milk, they appear again when they are subjected to handling and manufacture. Heat treatment of yoghurt was effi- cient in improving its shelf life and its microbial count. In September 1971, the milk committee had agreed that the future standard on yoghurt should not be considered as “yoghurt” even with a qualifying term. The excuse for this that the appellation “yoghurt” must denote a product with specific bacteria in viable form and in abundance this did not conform to the heated yoghurt [8]. In this way the Lebanese standard precise that these bacteria should be stay alive in finished product. The addition of stabilizers was shown to be necessary. Regarding preservation alone, different yeasts had differ- ent reactions to sodium benzoate and potassium sorbate. For instance Trichosporon cutaneum was most sensitive to potassium sorbate. Indeed 100 mg/Kg was enough to en- sure less than 105 cfu g-1 for a 14 days storage period, whereas 200 mg/Kg limited the count to less than 105 cfu g-1 for a 21 days storage period [9]. Potassium sorbate was shown to be more effective than sodium benzoate. Thus, as we see, preservation of yoghurt requires more than 100 mg/Kg of preservatives. The latter could have an identical effect than heat treatment at 65℃. Indeed, the yeast and mold count was limited to less than 10 cfu g-1 after 12 months of storage at 20℃. This showed the efficiency of the preservatives and their very delicate usage. Indeed if extra amounts were used some off-flavors, health prob- lems and extra costs might occur [9]. According to Leba- nese standard [10], the maximal content in sorbic acid and its salts must be never exceed 50 mg/Kg and the use of benzoic acid are forbidden. The efficient production of milk under good hygienic conditions is the key to successful dairying. The princi- pal constraints in Lebanese smallholder systems are in- adequate feeding, low genetic potential in animals and the major farms don’t have a milking room. If milking doesn’t take place manually, mostly, it takes places with movable milking machine for larger herds with the pos- sibility of transmission of many germs leading the prod- uct to spoilage before reaching the market. The trans- portation of milk from the producer to the processor and finally to the consumer take place by the producer itself or through a conveyor. Generally, milk was collected in plastic or aluminum containers and transported to the processor via refrigerating car or no according to the distance covered [11]. Therefore, The objective of the current study is to compare the quality of Laban sample collected from 2 representative regions (Mount Lebanon and Beirut) in Lebanon with the International Standards in order to as- sess the suitability of this nutritious material for health. 2. MATERIALS AND METHOD 2.1. Laban samples Laban samples were collected from 14 areas distributed throughout the Lebanese territory especially from Mount Lebanon and Beirut regions (see Table 1). Forty-two samples were provided by processing industry whether small, medium or large scale. Samples were collected during 3 periods for 1 month. A replication of the de- scriptive sensory evaluation, coupled with instrumental measurements, was done for each sample. 2.2. Physicochemical An alysis Titratable acidity was determined by titrating Laban samples with 0,1N NaOH using phenolphthalein as an indicator as outlined by AFNOR [12]. Results were ex- pressed in g of lactic acid per Kg of sample. The fat con- tent was determined by Gerber method [13]. The dry solids content by drying method as outlined by the As- sociation of Official Analytical Chemists (AOAC) [14]. All analyses were performed in duplicate. Apparent vis- cosity (η), expressed in Pa.s, was determined by using a Brookfield viscosimeter mod DV-II (Brookfield Eng. Lab., Middleborro, MA, U.S.A.), operating at 20℃. A LV4 spindle was used at different shear rates: 2, 5, 10, 20, 50 and 100 rpm.e. 2.3. Microbiological Analyses The Total and Faecal coliform bacteria were isolated by plating the diluted samples (dilution of 1 g of sample in sterile distilled water with 0,8% NaCl) on Maconkey Agar incubated for 24 h at 37℃ for Total coliform [15], and at 44℃ for Faecal coliform [16]. Salmonella spp. was isolated after enrichment in selenit broth at 37℃ for 24 h, than plating on SS Agar incubated at 37℃ for 24-48 h [17]. Staphylococcus aureus were isolated by plating the diluted samples on Chapman Agar at 37℃ for 24 h [18]. Yeasts and molds are also isolated using “Chloramphenical yeast Agar” at 30℃ for 5 days [19]. Bacteria counts were expressed as colony-forming units (cfu) per 1 g of sample. All tests were duplicated for each isolate.  Z. Mayssoun et al. / Health 2 (2010) 381-389 Copyright © 2010 SciRes. Openly accessible at http://www.scirp.org/journal/HEALTH/ 383 383 Table 1. Distribution of Laban samples throughout the Lebanese territory. N° Code Date of fondation origin Scale 1 LMO 1961 ELGHOBEIRI (Mount Lebanon) ٍSmall 2 ER 2000 ELJAHLIEH (Mount Lebanon) Small 3 LKA 2005 ELCHOUWEIFAT (Mount Lebanon ) Small 4 LW 2002 KABER CHMOUN (Mount Lebanon ) Small 5 LR 1992 ALLAY (Mount Lebanon ) Small 6 LD 1992 BORJ EL BARAJNI (Beirut) Medium 7 GD 1994 ELAMROUSAYEH (Mount Lebanon ) Medium 8 LG 1960 HARET HREIK (Mount Lebanon ) Medium 9 LK 1990 JISER EL BACHA (Beirut) Medium 10 ES 1976 DMIT (Mount Lebanon ) Medium 11 LM 2005 DEKWANEH (Mount Lebanon ) Medium 12 PR 1991 SIN EL FIL (Beirut) Medium 13 DD 1857 KFARCHIMA (Mount Lebanon ) Large 14 Dk 1978 AIN EL SINDIYANA (Mount Lebanon ) Large 2.4. Descriptive Sensory Analysis Sensory analysis was carried out in Lebanon with the collaboration of a panel of 16 volunteer members. Two hours were conducted to train the panelists in the good use of the intensity scale and to compare their perception. The 4 characteristics tested are given in Figure 1. Sam- ples were classified for each descriptor according to a 5-category intensity scale (scale 1 denoting an absence of the considered perception and scale 5 denoting a very intense perception). Each product was coded randomly by 1 letter and 2 digits. Samples, stored at 4℃ for 4 days, were presented in a simultaneous way. Extrinsic factors such as tem- perature, quantity presented, and container were homo- geneous for all the products. Spring water was provided for mouth rinsing between samples. In order to control the sort out of samples, the distribution of samples to panelists is realized according to “latin square plane of williams”. 3. STATISTICAL ANALYSIS Sensory and physicochemical properties were subjected to two-way analysis of variance. It allowed studying the variability between samples, by taking into account the variability between subjects. Pearson correlation coeffi- cients between attributes were also calculated. Analyses of variance and correlations were conducted using Soft- ware Statgraphics Plus version 3,0 (Stastical Graphics Corp., Rockville, MD, U.S.A.). Figure 1. Attributes used in the sensory evaluation of Laban. 4. RESULTS AND DISCUSSIONS 4.1. Physicochemical Analyses Results of physicochemical analyses are shown in Fig- ure 2. Significant differences (α < 0,05) in titratable acidity (see Table 2), total solid content, and fat content were found between samples collected from different origins. In plus, a significant effect of date was observed. A typical yoghurt sample was described by the Lebanese Institut of Normalisation (LIBNOR) [10], should contain 3% milk fat and, not less than 8,5% milk solids non-fat with a titrable acidity of no high than 1,5%. The total solid content of Laban samples varied between 6,78 and 13,25%. Therefore, almost 31% of samples were conformed to Lebanese Standard. However Toufeili and others [20], showed that the composition varied according of feeding, milk production period, and the race. Concerning fat content, the mean value obtained deviate widely with minimum of 2,3% and maximum of 8,4%. Results showed that 86% are conformed to Lebanese standard. Two industries are under standard (GD “medium scale”  Z. Mayssoun et al. / Health 2 (2010) 381-389 Copyright © 2010 SciRes. Openly accessible at http://www.scirp.org/journal/HEALTH/ 384 and DD “large scale”). These lower values can result from 2 causes: milk in its original composition, is poor in fat content or due to fraud practice on behalf of indus- trialist be possible during the moment of reception of milk or during obtaining finished product. 0 2 4 6 8 10 12 14 16 % o f total s olid content LMOLKALR GD LKLM DD selected laban samples (a) Date1 Date 2 Date 3 0 1 2 3 4 5 6 7 8 9 % of fat c onten t LMOLKALR GD LK LMDD Selected laban samples (b) Date 1 Date 2 Date 3 0 0.2 0.4 0.6 0.8 1 1.2 1.4 1.6 Titra ble acid it y g / l LMOLKALR GD LK LM DD Selected laban samples (c) Date 1 Date 2 Date 3 Figure 2. Physicochemical characteristics of selected Laban samples. (a) percentage of total solid content during 3 dates in the 2 regions, (b) percentage of fat content during 3 dates in the 2 regions, and titratable acidity (g/l) (c). Table 2. Two way analysis of variance for titratable acidity. Test of Between-Subjects Effects Dependent Variable: RDT Source Type III Sum of Squares df Mean Square F Sig. Corrected Model 1.758a 15 .117 11.915 .000 Intercept 43.513 1 43.513 4423.361.000 DATE .166 2 8.295E-02 8.432 .002 USINE 1.592 13 .122 12.451 .000 Error .256 26 9.837E-03 Total 45.527 42 Corrected Total 2.014 41 aR Squared= .873 (Adjusted R Squared = 800) Finally, lactic acid content varied between 0,63% for PR industry (medium scale) and 1,37% for DD industry (large scale). Consequently, the values of lactic acid con- tent obtained for the Laban samples were in agreement with those described by Lebanese Standard. In previous researches, fresh yoghurts had lower titratable acidity. The apparent viscosities of traditional samples (see Figure 3) were lower than that of the commercial product 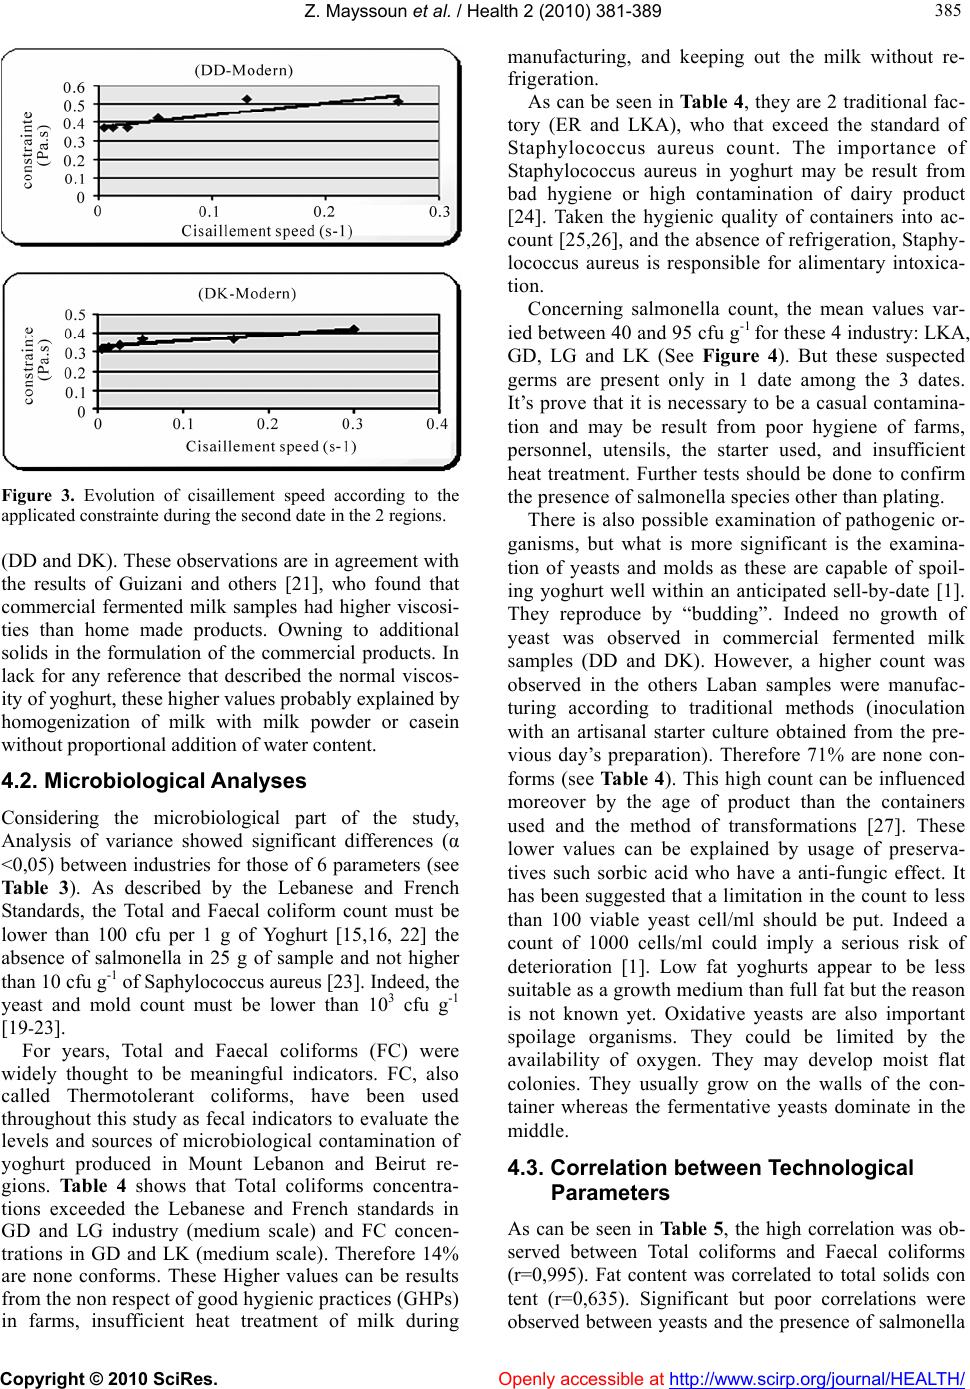 Z. Mayssoun et al. / Health 2 (2010) 381-389 Copyright © 2010 SciRes. Openly accessible at http://www.scirp.org/journal/HEALTH/ 385 385 Figure 3. Evolution of cisaillement speed according to the applicated constrainte during the second date in the 2 regions. (DD and DK). These observations are in agreement with the results of Guizani and others [21], who found that commercial fermented milk samples had higher viscosi- ties than home made products. Owning to additional solids in the formulation of the commercial products. In lack for any reference that described the normal viscos- ity of yoghurt, these higher values probably explained by homogenization of milk with milk powder or casein without proportional addition of water content. 4.2. Microbiological Analyses Considering the microbiological part of the study, Analysis of variance showed significant differences (α <0,05) between industries for those of 6 parameters (see Table 3). As described by the Lebanese and French Standards, the Total and Faecal coliform count must be lower than 100 cfu per 1 g of Yoghurt [15,16, 22] the absence of salmonella in 25 g of sample and not higher than 10 cfu g-1 of Saphylococcus aureus [23]. Indeed, the yeast and mold count must be lower than 103 cfu g-1 [19-23]. For years, Total and Faecal coliforms (FC) were widely thought to be meaningful indicators. FC, also called Thermotolerant coliforms, have been used throughout this study as fecal indicators to evaluate the levels and sources of microbiological contamination of yoghurt produced in Mount Lebanon and Beirut re- gions. Table 4 shows that Total coliforms concentra- tions exceeded the Lebanese and French standards in GD and LG industry (medium scale) and FC concen- trations in GD and LK (medium scale). Therefore 14% are none conforms. These Higher values can be results from the non respect of good hygienic practices (GHPs) in farms, insufficient heat treatment of milk during manufacturing, and keeping out the milk without re- frigeration. As can be seen in Table 4, they are 2 traditional fac- tory (ER and LKA), who that exceed the standard of Staphylococcus aureus count. The importance of Staphylococcus aureus in yoghurt may be result from bad hygiene or high contamination of dairy product [24]. Taken the hygienic quality of containers into ac- count [25,26], and the absence of refrigeration, Staphy- lococcus aureus is responsible for alimentary intoxica- tion. Concerning salmonella count, the mean values var- ied between 40 and 95 cfu g-1 for these 4 industry: LKA, GD, LG and LK (See Figure 4). But these suspected germs are present only in 1 date among the 3 dates. It’s prove that it is necessary to be a casual contamina- tion and may be result from poor hygiene of farms, personnel, utensils, the starter used, and insufficient heat treatment. Further tests should be done to confirm the presence of salmonella species other than plating. There is also possible examination of pathogenic or- ganisms, but what is more significant is the examina- tion of yeasts and molds as these are capable of spoil- ing yoghurt well within an anticipated sell-by-date [1]. They reproduce by “budding”. Indeed no growth of yeast was observed in commercial fermented milk samples (DD and DK). However, a higher count was observed in the others Laban samples were manufac- turing according to traditional methods (inoculation with an artisanal starter culture obtained from the pre- vious day’s preparation). Therefore 71% are none con- forms (see Table 4). This high count can be influenced moreover by the age of product than the containers used and the method of transformations [27]. These lower values can be explained by usage of preserva- tives such sorbic acid who have a anti-fungic effect. It has been suggested that a limitation in the count to less than 100 viable yeast cell/ml should be put. Indeed a count of 1000 cells/ml could imply a serious risk of deterioration [1]. Low fat yoghurts appear to be less suitable as a growth medium than full fat but the reason is not known yet. Oxidative yeasts are also important spoilage organisms. They could be limited by the availability of oxygen. They may develop moist flat colonies. They usually grow on the walls of the con- tainer whereas the fermentative yeasts dominate in the middle. 4.3. Correlation between Technological Parameters As can be seen in Table 5, the high correlation was ob- served between Total coliforms and Faecal coliforms (r=0,995). Fat content was correlated to total solids con tent (r=0,635). Significant but poor correlations were observed between yeasts and the presence of salmonella 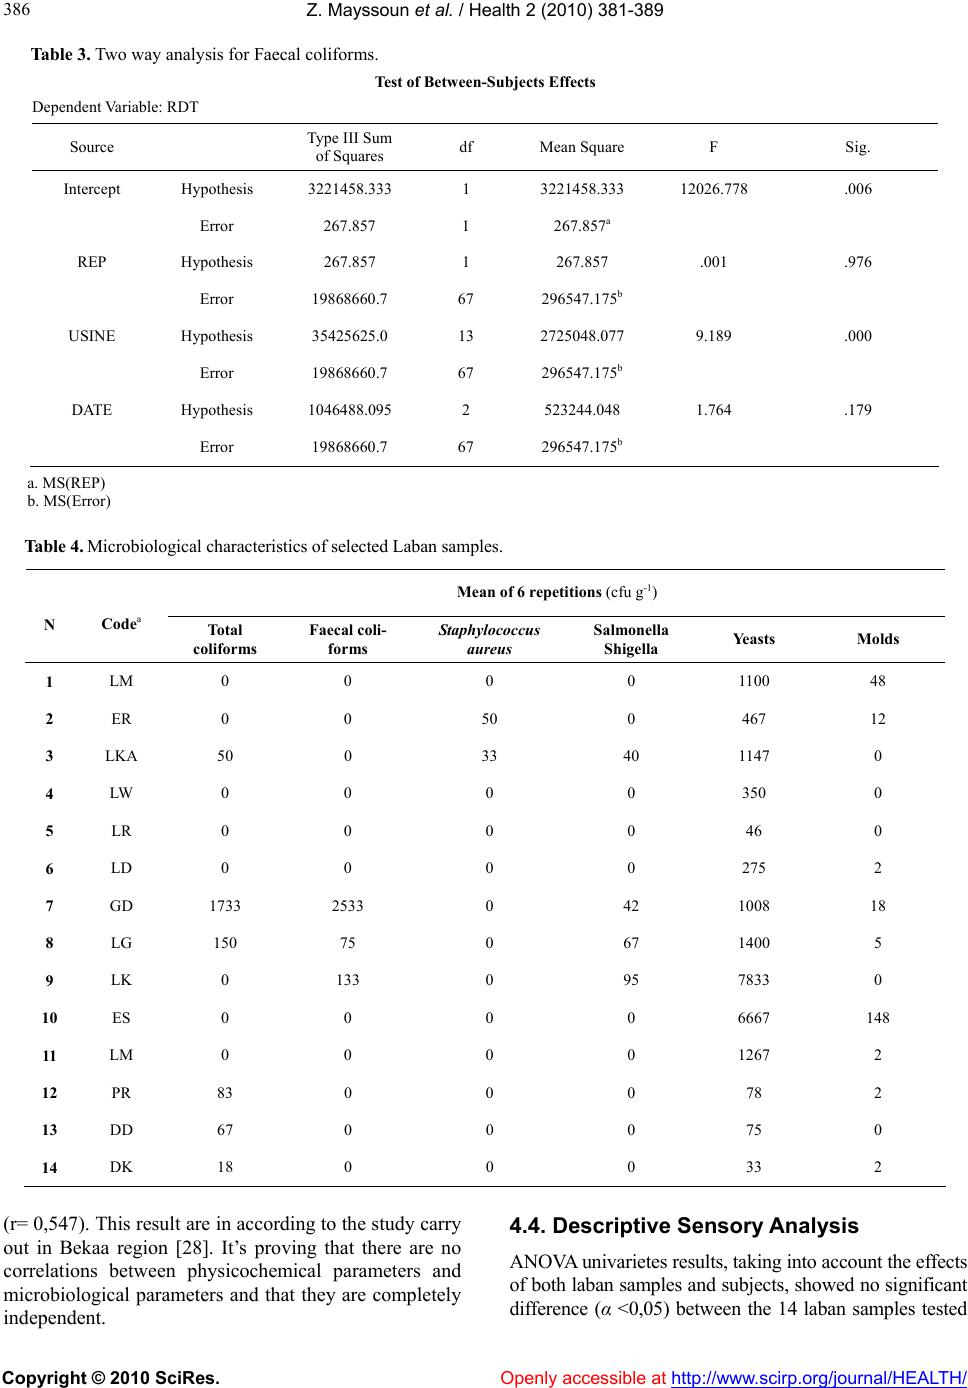 Z. Mayssoun et al. / Health 2 (2010) 381-389 Copyright © 2010 SciRes. Openly accessible at http://www.scirp.org/journal/HEALTH/ 386 Table 3. Two way analysis for Faecal coliforms. Test of Between-Subjects Effects Dependent Variable: RDT Source Type III Sum of Squares df Mean Square F Sig. Intercept Hypothesis 3221458.333 1 3221458.333 12026.778 .006 Error 267.857 1 267.857a REP Hypothesis 267.857 1 267.857 .001 .976 Error 19868660.7 67 296547.175b USINE Hypothesis 35425625.0 13 2725048.077 9.189 .000 Error 19868660.7 67 296547.175b DATE Hypothesis 1046488.095 2 523244.048 1.764 .179 Error 19868660.7 67 296547.175b a. MS(REP) b. MS(Error) Table 4. Microbiological characteristics of selected Laban samples. Mean of 6 repetitions (cfu g-1) N Codea Total coliforms Faecal coli- forms Staphylococcus aureus Salmonella Shigella Yeasts Molds 1 LM 0 0 0 0 1100 48 2 ER 0 0 50 0 467 12 3 LKA 50 0 33 40 1147 0 4 LW 0 0 0 0 350 0 5 LR 0 0 0 0 46 0 6 LD 0 0 0 0 275 2 7 GD 1733 2533 0 42 1008 18 8 LG 150 75 0 67 1400 5 9 LK 0 133 0 95 7833 0 10 ES 0 0 0 0 6667 148 11 LM 0 0 0 0 1267 2 12 PR 83 0 0 0 78 2 13 DD 67 0 0 0 75 0 14 DK 18 0 0 0 33 2 (r= 0,547). This result are in according to the study carry out in Bekaa region [28]. It’s proving that there are no correlations between physicochemical parameters and microbiological parameters and that they are completely independent. 4.4. Descriptive Sensory Analysis ANOVA univarietes results, taking into account the effects of both laban samples and subjects, showed no significant difference (α <0,05) between the 14 laban samples tested 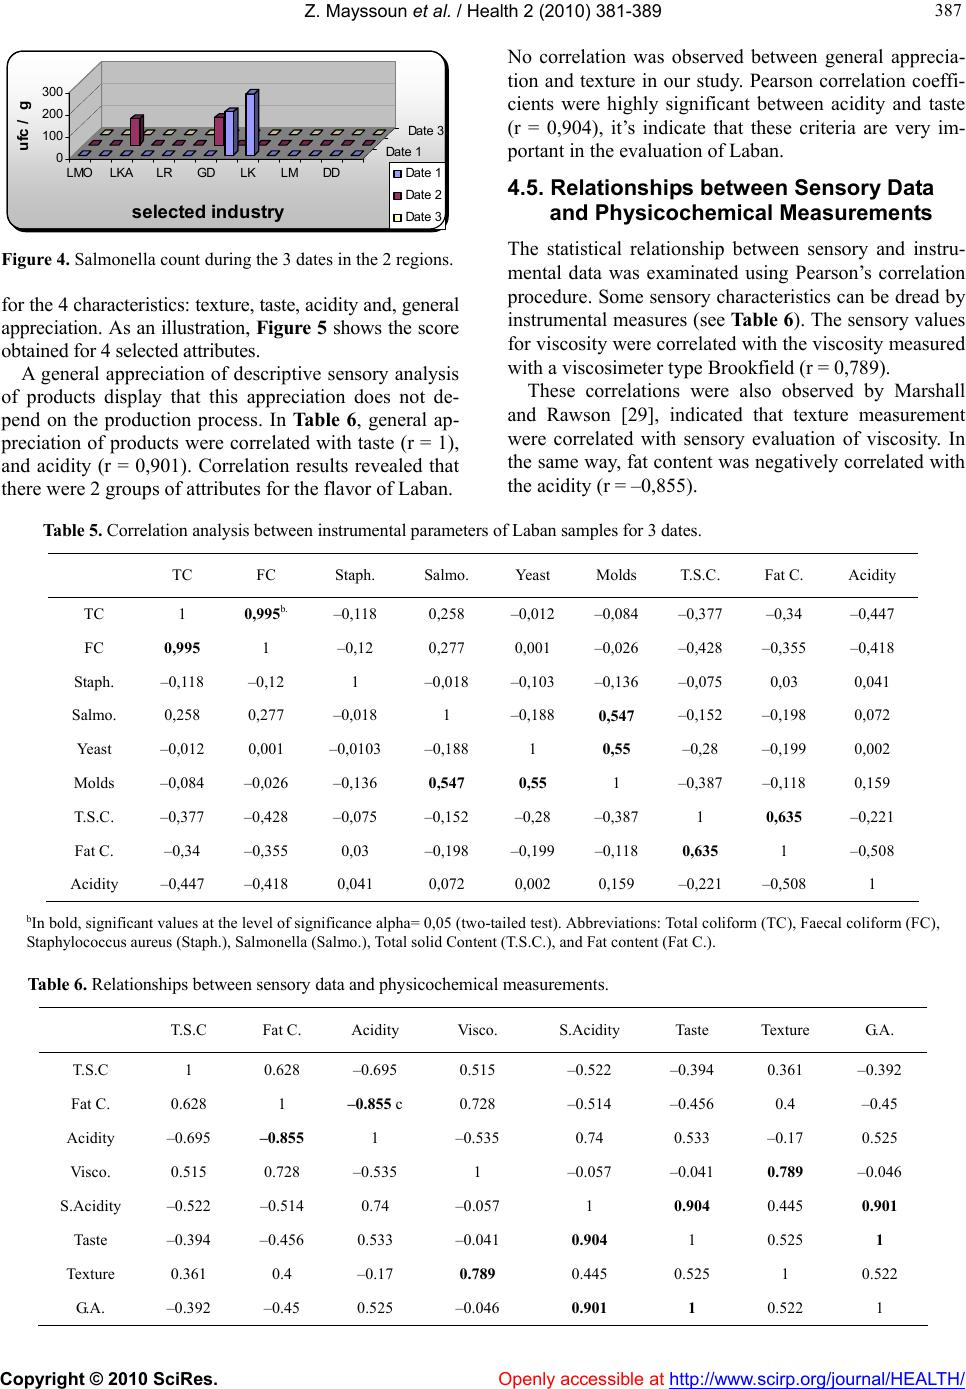 Z. Mayssoun et al. / Health 2 (2010) 381-389 Copyright © 2010 SciRes. Openly accessible at http://www.scirp.org/journal/HEALTH/ 387 387 0 100 200 300 ufc / g LMO LKALRGDLKLMDD Date 1 Date 3 selected industr y Date 1 Date 2 Date 3 Figure 4. Salmonella count during the 3 dates in the 2 regions. for the 4 characteristics: texture, taste, acidity and, general appreciation. As an illustration, Figure 5 shows the score obtained for 4 selected attributes. A general appreciation of descriptive sensory analysis of products display that this appreciation does not de- pend on the production process. In Table 6, general ap- preciation of products were correlated with taste (r = 1), and acidity (r = 0,901). Correlation results revealed that there were 2 groups of attributes for the flavor of Laban. No correlation was observed between general apprecia- tion and texture in our study. Pearson correlation coeffi- cients were highly significant between acidity and taste (r = 0,904), it’s indicate that these criteria are very im- portant in the evaluation of Laban. 4.5. Relationships between Sensory Data and Physicochemical Measurements The statistical relationship between sensory and instru- mental data was examinated using Pearson’s correlation procedure. Some sensory characteristics can be dread by instrumental measures (see Table 6). The sensory values for viscosity were correlated with the viscosity measured with a viscosimeter type Brookfield (r = 0,789). These correlations were also observed by Marshall and Rawson [29], indicated that texture measurement were correlated with sensory evaluation of viscosity. In the same way, fat content was negatively correlated with the acidity (r = –0,855). Table 5. Correlation analysis between instrumental parameters of Laban samples for 3 dates. TC FC Staph. Salmo. Yeast Molds T.S.C. Fat C. Acidity TC 1 0,995b. –0,118 0,258 –0,012 –0,084 –0,377 –0,34 –0,447 FC 0,995 1 –0,12 0,277 0,001 –0,026 –0,428 –0,355 –0,418 Staph. –0,118 –0,12 1 –0,018 –0,103 –0,136 –0,075 0,03 0,041 Salmo. 0,258 0,277 –0,018 1 –0,188 0,547 –0,152 –0,198 0,072 Yeast –0,012 0,001 –0,0103 –0,188 1 0,55 –0,28 –0,199 0,002 Molds –0,084 –0,026 –0,136 0,547 0,55 1 –0,387 –0,118 0,159 T.S.C. –0,377 –0,428 –0,075 –0,152 –0,28 –0,387 1 0,635 –0,221 Fat C. –0,34 –0,355 0,03 –0,198 –0,199 –0,118 0,635 1 –0,508 Acidity –0,447 –0,418 0,041 0,072 0,002 0,159 –0,221 –0,508 1 bIn bold, significant values at the level of significance alpha= 0,05 (two-tailed test). Abbreviations: Total coliform (TC), Faecal coliform (FC), Staphylococcus aureus (Staph.), Salmonella (Salmo.), Total solid Content (T.S.C.), and Fat content (Fat C.). Table 6. Relationships between sensory data and physicochemical measurements. T.S.C Fat C. Acidity Visco. S.Acidity Taste Texture G.A. T.S.C 1 0.628 –0.695 0.515 –0.522 –0.394 0.361 –0.392 Fat C. 0.628 1 –0.855 c 0.728 –0.514 –0.456 0.4 –0.45 Acidity –0.695 –0.855 1 –0.535 0.74 0.533 –0.17 0.525 Visco. 0.515 0.728 –0.535 1 –0.057 –0.041 0.789 –0.046 S.Acidity –0.522 –0.514 0.74 –0.057 1 0.904 0.445 0.901 Taste –0.394 –0.456 0.533 –0.041 0.904 1 0.525 1 Texture 0.361 0.4 –0.17 0.789 0.445 0.525 1 0.522 G.A. –0.392 –0.45 0.525 –0.046 0.901 1 0.522 1 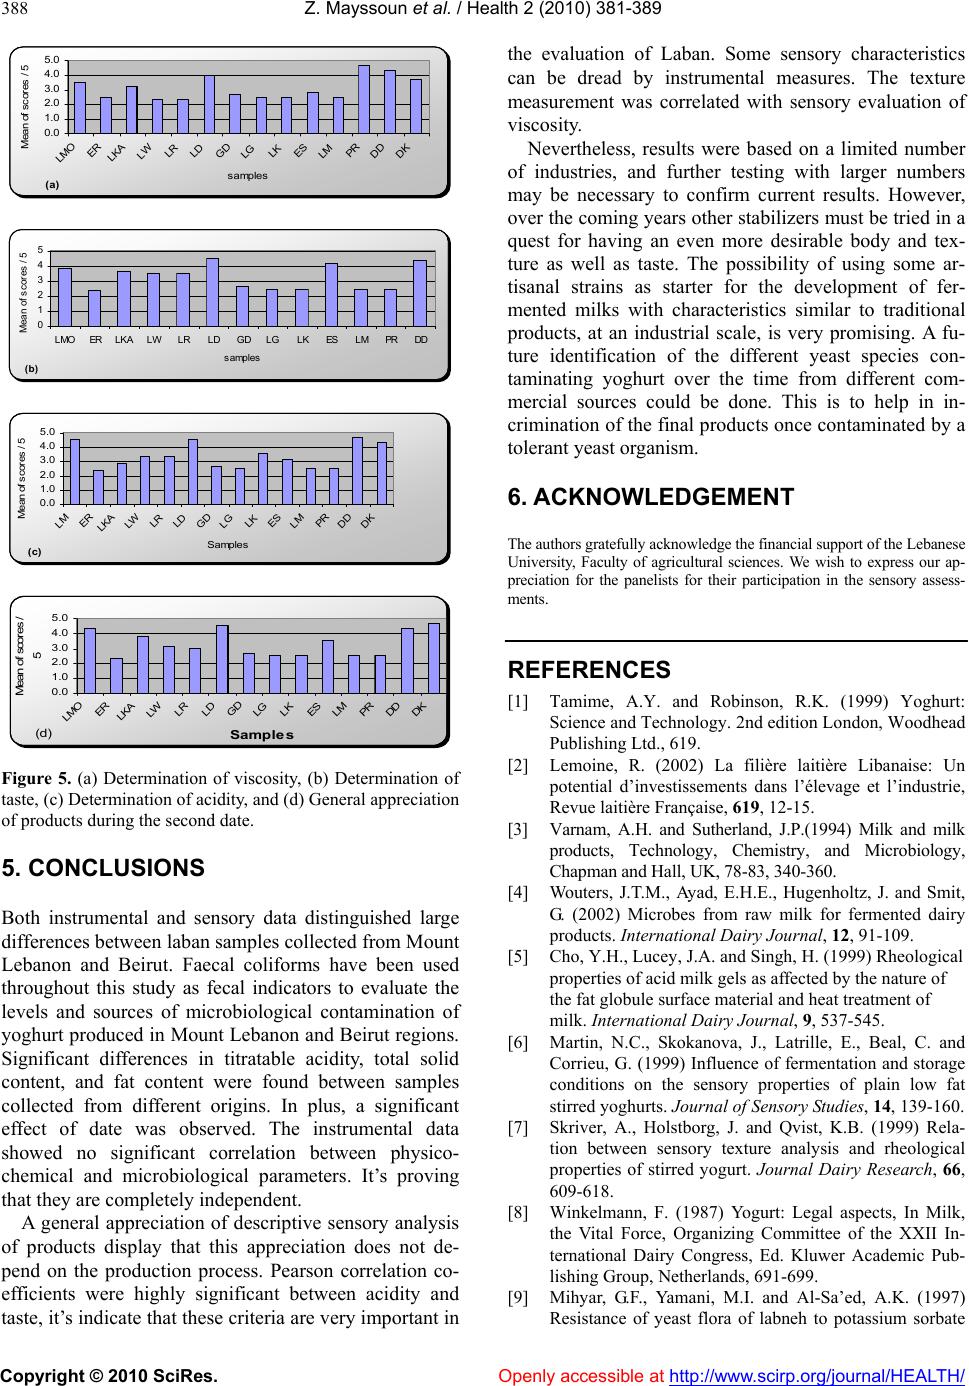 Z. Mayssoun et al. / Health 2 (2010) 381-389 Copyright © 2010 SciRes. Openly accessible at http://www.scirp.org/journal/HEALTH/ 388 (a) 0.0 1.0 2.0 3.0 4.0 5.0 LMO ER LKA LW LR LD GD LG LK ES LM PR DD DK samples M e a n o f scores / 5 (b) 0 1 2 3 4 5 LMOER LKA LWLRLDGDLGLKESLMPRDD samples Mean of scores / 5 (c) 0.0 1.0 2.0 3.0 4.0 5.0 LM ER LKA LW LR LD GD LG LK ES LM PR DD DK Samples Mean of scores / 5 (d) 0.0 1.0 2.0 3.0 4.0 5.0 LMO ER LKA LW LR LD GD LG LK ES LM PR DD DK Samples M ean of scores / 5 Figure 5. (a) Determination of viscosity, (b) Determination of taste, (c) Determination of acidity, and (d) General appreciation of products during the second date. 5. CONCLUSIONS Both instrumental and sensory data distinguished large differences between laban samples collected from Mount Lebanon and Beirut. Faecal coliforms have been used throughout this study as fecal indicators to evaluate the levels and sources of microbiological contamination of yoghurt produced in Mount Lebanon and Beirut regions. Significant differences in titratable acidity, total solid content, and fat content were found between samples collected from different origins. In plus, a significant effect of date was observed. The instrumental data showed no significant correlation between physico- chemical and microbiological parameters. It’s proving that they are completely independent. A general appreciation of descriptive sensory analysis of products display that this appreciation does not de- pend on the production process. Pearson correlation co- efficients were highly significant between acidity and taste, it’s indicate that these criteria are very important in the evaluation of Laban. Some sensory characteristics can be dread by instrumental measures. The texture measurement was correlated with sensory evaluation of viscosity. Nevertheless, results were based on a limited number of industries, and further testing with larger numbers may be necessary to confirm current results. However, over the coming years other stabilizers must be tried in a quest for having an even more desirable body and tex- ture as well as taste. The possibility of using some ar- tisanal strains as starter for the development of fer- mented milks with characteristics similar to traditional products, at an industrial scale, is very promising. A fu- ture identification of the different yeast species con- taminating yoghurt over the time from different com- mercial sources could be done. This is to help in in- crimination of the final products once contaminated by a tolerant yeast organism. 6. ACKNOWLEDGEMENT The authors gratefully acknowledge the financial support of the Lebanese University, Faculty of agricultural sciences. We wish to express our ap- preciation for the panelists for their participation in the sensory assess- ments. REFERENCES [1] Tamime, A.Y. and Robinson, R.K. (1999) Yoghurt: Science and Technology. 2nd edition London, Woodhead Publishing Ltd., 619. [2] Lemoine, R. (2002) La filière laitière Libanaise: Un potential d’investissements dans l’élevage et l’industrie, Revue laitière Française, 619, 12-15. [3] Varnam, A.H. and Sutherland, J.P.(1994) Milk and milk products, Technology, Chemistry, and Microbiology, Chapman and Hall, UK, 78-83, 340-360. [4] Wouters, J.T.M., Ayad, E.H.E., Hugenholtz, J. and Smit, G. (2002) Microbes from raw milk for fermented dairy products. International Dairy Journal, 12, 91-109. [5] Cho, Y.H., Lucey, J.A. and Singh, H. (1999) Rheological properties of acid milk gels as affected by the nature of the fat globule surface material and heat treatment of milk. International Dairy Journal, 9, 537-545. [6] Martin, N.C., Skokanova, J., Latrille, E., Beal, C. and Corrieu, G. (1999) Influence of fermentation and storage conditions on the sensory properties of plain low fat stirred yoghurts. Journal of Sensory Studies, 14, 139-160. [7] Skriver, A., Holstborg, J. and Qvist, K.B. (1999) Rela- tion between sensory texture analysis and rheological properties of stirred yogurt. Journal Dairy Research, 66, 609-618. [8] Winkelmann, F. (1987) Yogurt: Legal aspects, In Milk, the Vital Force, Organizing Committee of the XXII In- ternational Dairy Congress, Ed. Kluwer Academic Pub- lishing Group, Netherlands, 691-699. [9] Mihyar, G.F., Yamani, M.I. and Al-Sa’ed, A.K. (1997) Resistance of yeast flora of labneh to potassium sorbate  Z. Mayssoun et al. / Health 2 (2010) 381-389 Copyright © 2010 SciRes. Openly accessible at http://www.scirp.org/journal/HEALTH/ 389 389 and sodium benzoate. Journal Dairy Sciences, 80, 2304-2309. [10] Libnor (1999) Norme Libanaise pour le lait cru. Beyrouth, Ministère de l’Economie, Standard No. 33. [11] Serhan, H. (1999) Vers une politique de qualité des entreprises laitières libanaises: Intérêts ET orientations stratégiques, M.S. thèses, IHEAM/IAMM, Montpellier, France, 463. [12] Afnor (1995) Norme française, microbiologie alimentaire, recherche des salmonella shigella, méthode de routine, Standard no.V 08-052. [13] Marshall, R.T. (1992) Standard methods for the examination of dairy products. American Public Health Association, Washington D.C. [14] AOAC (1990) Association of official analytical chemists. Official Methods of Analysis of AOAC International, 15th Edition. [15] Afnor (1985) Norme française, microbiologie alimentaire, dénombrement des coliformes totaux à 37°C, Méthode de routine, Standard no. V 08-015. [16] Afnor (1988) Norme française, microbiologie alimentaire, dénombrement des escherichia coli β-glucoronidase positive par comptage des colonies à 44°C, Méthode de routine, Standard no. V 08-053. [17] Afnor (1993) Norme française, contrôle de la qualité des produits alimentaires, lait et produits alimentaires: analyses physico-chimiques, 4eme édition, Paris, recueil des Normes Françaises, 195-215. [18] Afnor (1994) Norme française, microbiologie alimentaire, dénombrement des staphylococcus aureus à 37°C, Méthode de routine, Standard no.V 08-057. [19] Afnor (1999) Norme française, microbiologie alimentaire, recherche des moisissures et levures, Méthode de routine, Standard no.V 08-022. [20] Toufeili, I., Al-Kadamany, E., Khattar, M., Abou Jawdeh, Y., Harakeh, S. and Haddad, T. (2002) Determination of shelf life of concentrated yoghurt (Labneh) produced by in bag straining of set yoghurt using Hazard Analysis. Journal Dairy Sciences, 85, 1023-1030. [21] Guizani, N., Kasapis, S. and Al-Ruzeiki, M. (2001) Mi- crobial, chemical and rheological properties of (cultured milk). International Journal Food Sciences Technology, 36, 199-205. [22] Libnor (2004) Norme Libanaise pour les produits laitiers, Beyrouth, Ministère de l’Economie, 3ème édition, Standard No. 47. [23] Libnor (2006) Norme Libanaise pour les produits laitiers, Beyrouth, Ministère de l’Economie, Standard No. 510. [24] Seydi, M. and Ndiaye, M. (1993) Acidity and microbial flora contaminating Senegalese reconstituted curdled milk produced on small scale. Bulletin No. 38, Société Médicale d'Afrique Noire de Langue Française, 61-67. [25] Ashenafi, M. (1996) Effect of Container Smoking and Incubation Temperature on the Microbiological and some Biochemical Qualities of Fermenting Ergo, Traditional Ethiopian Sour Milk, International Dairy Journal, 6, 95-104. [26] Godefay, B. and Molla, B. (2000) Bacteriological quality of raw cow's milk from four dairy farms and a milk col- lection centre in and around Addis Ababa, Berliner Und Munchener Tierarztliche Wochenschrift, 113L, 276-278. [27] Beukes, E.M., Bester, B.H. and Mostert, J.F. (2001) The microbiology of South African traditional fermented milks. International Journal of Food Microbiology, 63, 189-197. [28] Feghaly, G.(2005) Influence des procédés de fabrication sur la qualité de yaourt, DEA thèses, Agence Universitaire de la Francophonie, Bureau du Moyen-Orient, Beyrouth. [29] Marshall, V.M. and Rawson, H.L. (1999) Effects of exopolysaccharide-producing strains of thermophilic lactic acid bacteria on the texture of stirred yoghurt. In- ternational Journal of Food Sciences Technology, 34, 137-143. |