Secondary Structure Changes and Thermal Stability of Plasma Membrane Proteins of Wheat Roots in Heat Stress
822
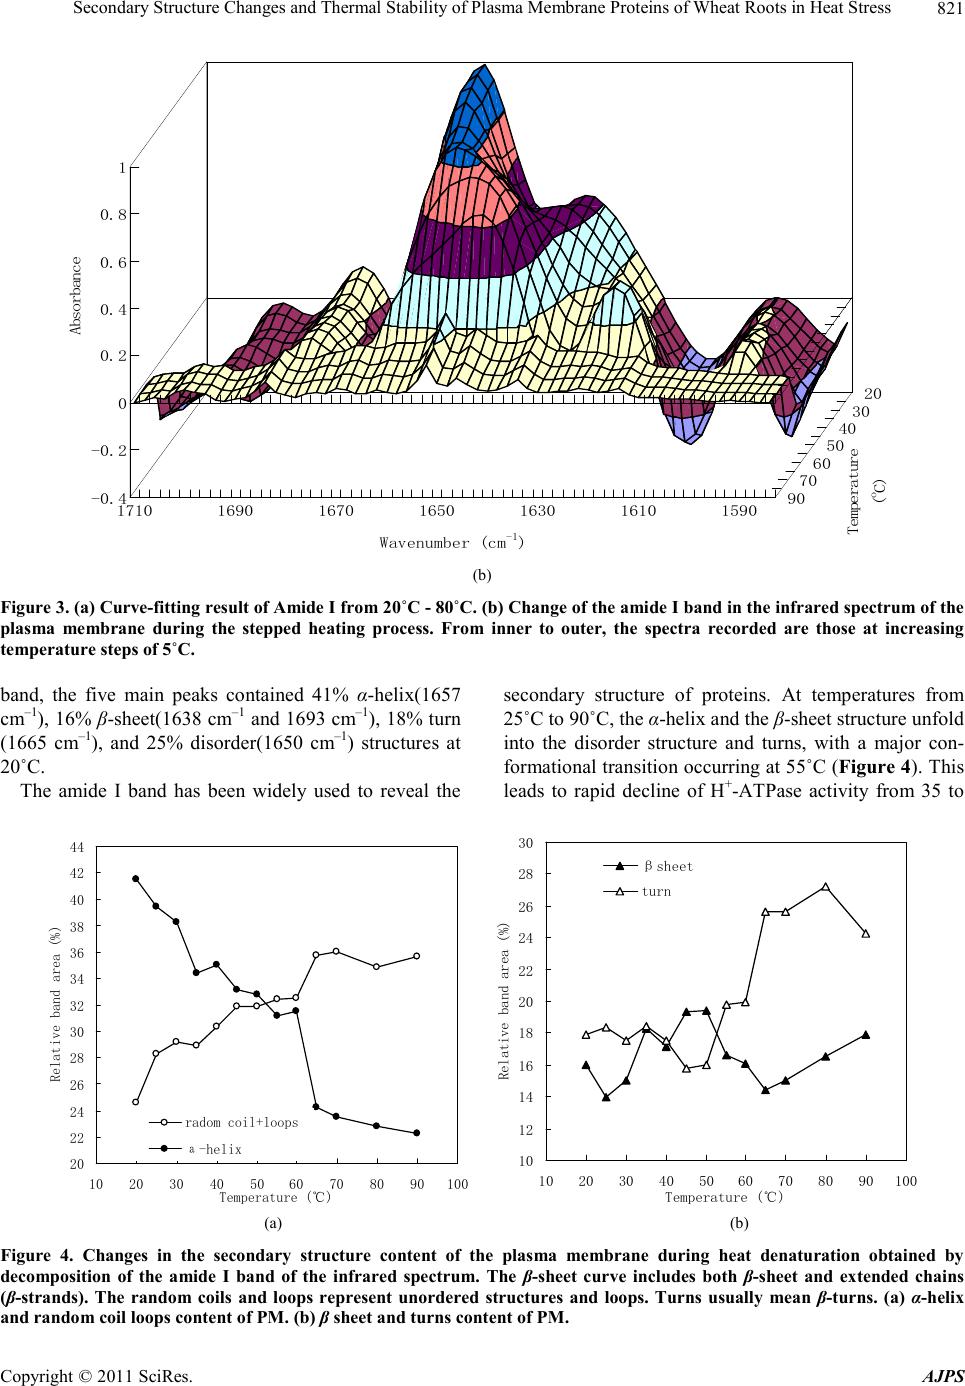
90˚C.
H+-ATPase activity was positively correlated (R2 =
0.6475) with the corresponding relative band area per-
centage of α-helix in the amide I region. Therefore the
protein conformational transition was one of reasons of
loses H+-ATPase activity of PM.
4. Acknowledgements
This work is financially supported by NSFC (30770343,
30870383 and 31070360) research foundation.
REFERENCES
[1] A. S. Malik, O. Boyko, N. Atkar and W. F. Young, “A
Comparative Study of MR Imaging Profile of Titanium
Pedicl e Screws,” Acta Radiologica, Vol. 42, No. 3, 2001,
pp. 291-293. doi:10.1080/028418501127346846
[2] Y. L. Yang, F. Zhang, W. L. He, X. M. Wang and L. X.
Zhang, “Iron-Mediated Inhibition of H+-ATPase in Pla-
sma Membrane Vesicles Isolated from Wheat Roots,” Ce-
llular and Molecular Life Science, Vol. 60, No. 6, 2003, pp.
1249-1257.
[3] J. L. R. Arrondo and F. M. Goñi, “Structure and Dynamics
of Membrane Proteins as Studied by Infrared Spectrosco-
py,” Progress in Biophysics & Molecular Biology, Vol. 72,
1999, pp. 367-405.
[4] H. Shi, L. Xiong, K. Y. Yang, C. Q. Tang, T. Y. Kuang
and N. M. Zhao, “Protein Secondary Structure and Con-
formational Changes of Photosystem II during Heat De-
naturation Studied by Fourier Transforminfrared Spectro-
scopy,” Journal of Molecular Structure, Vol. 446, No.
1-2, 1998, pp. 137-147.
[5] E. Goormaghtigh, V. Raussens and J. M. Ruysschaert,
“Attenuated Total Refection Infrared Spectroscopy of
Proteins and Lipids in Biological Membranes,” Biochi-
mica et Biophysica Acta, Vol. 142 2, 1999, pp. 105- 18 5.
[6] A. M. Phelan and D. G. Lange, “Ischemia/Reperfusion
-induced Changes in Membrane Fluidity Characteristics
of Brain Capillary Endothelial Cells and Its Prevention by
Liposomal-Incorporated Superoxide Dismutase,” Biochimi-
ca et Biophysica Acta, Vol. 1067, 1991, pp. 97-103.
[7] R. H. Sills, D. J. Moore and R. Mendelsohn, “Erythro-
cyte Peroxidation: Quantitation by Fourier Transform In-
frared Spectroscopy,” Analytical Biochemistry, Vol. 218,
No. 1, 1994, pp. 118- 12 3.
[8] H. Susi, S. N. Timasheff and L. Stevens, “Infrared Spe-
ctra and Protein Conformation in Aqueous Solutions: The
Amide I Band in H2O and D2O Solutions,” Jounral Bio-
logy Chemistry, Vol. 242, 1967, pp. 5460-5466.
[9] Q. S. Qiu and X. F. Su, “The Influence of Extra Cellular
Side Ca2+ on the Activity of the Plasma Membrane H+-
ATPase from Wheat Roots,” Australian Journal of Plant
Physiology, Vol. 25, 199 8, pp. 92 3- 9 28.
[10] T. Ohinish, R. S. Gall and M. L. Mayer, “An Improved
Assay of Inorganic Phosphate in the Presence of Extrala-
bile Phosphate Compounds: Application to the ATPase
assay in the P resence of P hosphocreat ine,” Analytical Bio-
chemistry, Vol. 69, 1975, pp. 261-267.
[11] M. M. Bradford, “A Rapid and Sensitive Method for the
Quantization of Microgram Quantities of Protein Utili-
zing the Principle of Protein-Dye Binding,” Analytical Bio-
chemistry. Vol. 72, 1976, pp. 248-254.
doi:10.1016/0003-2697(76)90527-3
[12] W. K. Surewicz and H. H. Mantsch, “New Insight into
Protein Secondary Structure from Resolution-Enhanced In-
frared Spectra, ” Biochimica et Biophysica Acta., Vol. 952,
No. 2, 1988, pp. 115-130.
do i:10.1016/0167-4838(88)90107-0
[13] K. Rahmelow and W. Hubner, “Infrared Spectroscopy in
Aqueous Solution: Difficulties and Accuracy of Water
Subtraction,” Applied Spectroscopy, Vol. 51, No. 2, 1997,
pp. 160- 170. doi:10.1366/0003702971940080
[14] P. I. Haris, M. Coke and D. Chapman, “Fourier Transform
Infrared Spectroscopic Investigation of Rhodopsin Struc-
ture and Its Comparison with Bacteriorhodopsin,” Biochi-
mica et Biophysica Act, Vol. 995, No. 2, 1989, pp. 160-167.
do i:10.1016/0167-4838(89)90075-7
[15] A. Dong, P. Huang and W. S. Caughey, “Protein Second-
dary Structures in Water from the Second Derivative Am-
ide I Infrared Spectra,” Biochemistry, Vol. 29, 1990, pp.
3303-330 8. doi:10.1021/bi00465a022
[16] T. Heimburg, J. Schunemann, K. Weber and N. Geisler,
“FTIR-Spectroscopy of Multistranded Coiled Coil Pro-
teins,” Biochemistry, Vol. 38, No. 39, 1999, pp. 12727-
12734. doi:10.1021/bi983079h
[17] A. Blume, W. Hubner and G. Messner, “Fourier Trans-
form Infrared Spectroscopy of 13C =O Laber Phospholi-
pids Hydrogen Bonding to Carbonyl Groups,” Bioche-
mistry, Vol. 27, No. 21, 198 8, pp . 8239-82 49.
doi:10.1021/bi00421a038
[18] A. Menikh and M. Fragata, “Fourier Transform Infrared
Spectroscopic Study of Ion Binding and Intramolecular
Interactions in the Polar Head of Digalac-tosyldiacylgly-
cerol,” European Biophysics Journa, Vol. 22, No. 4, 1993,
pp. 249-25 8. doi:10.1007/BF00180259
[19] W. Z. He, W. R. Newell, P. I. Haris, D. Chapman and J.
Barber, “P rotein Secon dary Structu re of the Isol ated Pho-
tosystem II Reaction Center and Conformational Changes
Studied by Fourier Transform Infrared Spectroscopy,”
Biochemistry, Vol. 30, No. 18, 1991, pp. 4552-4559.
doi:10.1021/bi00232a027
[20] W. K. Surewicz and H. H. Mantsch, “Infrared Absorption
Methods for Examining Protein Structure,” In: H. A. Havel,
Ed., Spectroscopic Methods for Determining Protein Struc-
ture in Solution, VCH, N e w York, 1996, pp. 135-162.
[21] G. M. MacDonald and B. A. Barry, “Difference FT-IR
Study of a Novel Biochemical Preparation of Photosys-
tem,” Biochemistry, Vol. 31, No. 40, 199 2, p p. 98 48-9853.
doi:10.1021/bi00155a043
Copyright © 2011 SciRes. AJPS