Wireless Sensor Network, 2011, 3, 371-377
doi:10.4236/wsn.2011.312043 Published Online December 2011 (http://www.SciRP.org/journal/wsn)
Copyright © 2011 SciRes. WSN
Probability Control for Verification of an Event
Report Using Fuzzy System
Hyun Woo Lee, Soo Young Moon, Tae Ho Cho
School of Information and Communication Engineering, Sungkyunkwan University, Suwon, Republic of Korea
E-mail: {hwoolee, moonmous, taecho}@ece.skku.ac.kr
Received September 5, 2011; revised Octobe r 11, 2011; acc ept ed N ove mber18 2011
Abstract
Sensor networks include numerous sensor nodes that are vulnerable to physical attacks from the outside be-
cause they operate in open environments. The sensor nodes are compromised by an attacker. The compro-
mised nodes generate false reports and inject the reports into sensor networks. The false report injection at-
tacks deplete energy of the sensor nodes. Ye et al. proposed Statistical En-Route Filtering (SEF) to defend
sensor nodes against the false report injection attacks. In SEF, sensor nodes verify the event reports based on
a fixed probability. Thus, the verification energy of a node is the same whether the report is false or valid.
But when there are few false reports, energy for verifying legitimate reports may be wasted. In this paper, we
propose a method in which each node controls a probability of attempts at verification of an event report to
reduce the wasted energy. The probability is determined through consideration of the number of neighboring
nodes, the number of hops from the node to the sink node, and the rate of false reports among the 10 most
recent event reports forwarded to a node. We simulated our proposed method to prove its energy efficiency.
After the simulation, we confirmed that the proposed method is more efficient than SEF for saving sensor
node’s energy.
Keywords: Sensor Network, Statistical En-Route Filtering, False Report Injection Attack
1. Introduction
Recent Developments in micro-electro-mechanical sys-
tems (MEMS) technology and advances in wireless
communications have enabled the growth of sensor net-
works [1]. Figure 1 shows a sensor network.
The sensor network is composed of many tiny sensor
Figure 1. Sensor network.
nodes each of which has limited computational, commu
nicational, and sensing capabilities [1]. The sensor nodes
coordinate to perform a common task [1]. Sensor net-
works are employed for a wide variety of applications,
including industrial, military, biomedical, and environ-
mental areas. Sensor network nodes are deployed in open
environments in many applications [1,2]. Hence, the
sensor nodes are vulnerable to physical attacks which
compromise their cryptographic keys [1]. One such at-
tack is false report injection attack. If an attacker com-
promises any node to obtain the security information, the
attacker makes a compromised node generate false re-
ports and insert them into the sensor network. A false
report injection attack can result in not only a reduction
of the already limited energy of sensor nodes in a battery
powered network but also false alarms [3-6]. To mini-
mize such damages, false reports have to be dropped
en-route as soon as possible, while few eluded false re-
ports have to be rejected at the sink node [4]. Fan Ye et
al. proposed a solution that drops the false reports
en-route called statistical en-route filtering (SEF). In SEF,
each intermediate node includes authentication keys that
H. W. LEE ET AL.
372
verify reports from different partitions in a global pool
[5]. Whenever a report is forwarded, each node verifies
whether a report is legitimate. Legitimate report, the re-
ports are forwarded to the next intermediate node. Non-
legitimate reports are dropped. Thus, the false reports
that are generated by compromised nodes are filtered
early, meaning that sensor nodes do not need to waste
energy forwarding many false reports. However, when
there are few false reports, the sensor nodes have to
waste energy verifying both legitimate and false reports
with the same probability [5].
In this paper, to save the energy that is consumed
verifying event reports, we propose a method that con-
trols a probability of attempts at verification of an event
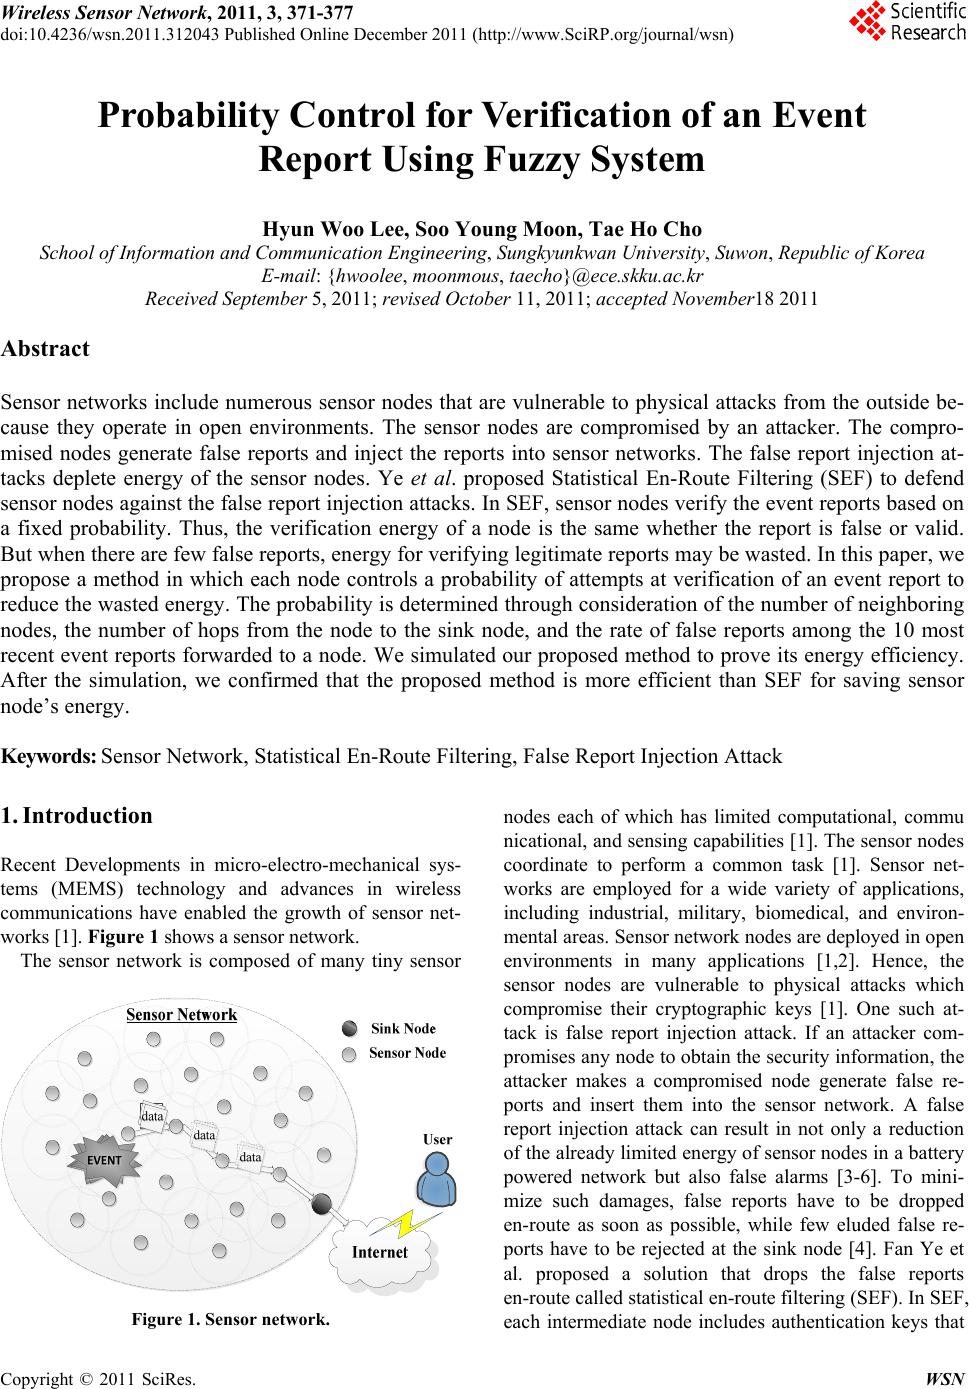
report through a fuzzy system in a sensor network. The
prob- ability is decided by three elements: the number of
nei- ghbor nodes, the number of hops from a node to a
sink node and the rate of false reports.
Our proposed method is described in detail as follows.
Section 2 explains SEF related work. Section 3 describes
the proposed method. Section 4 shows the simulation
results. Section 5 presents the study conclusion.
2. Statistical En-Route Filtering
SEF is composed of four steps: key assignment, report
generation, en-route filtering, and sink verification. In
this section, these four steps are explained
2.1. Key Assignment
Some of the keys in the global key pool are assigned to
each sensor node. The keys are selected at random before
the sensor nodes are deployed in the sensor field. The
global key pool is divided into several non-overlapping
partitions that have the same number of keys. Several
partitions are randomly selected from the global key pool
by a user, who then assigns some of the keys to a node.
The number of keys assigned to each node is decided by
the user. Each node generates Message authentication
codes (MAC) using its keys to verify reports.
2.2. Report Generation
After key assignment and node deployment, when an
event is occurred in the sensor field, multiple nodes that
detect the event elect a center of stimulus node (CoS),
which most strongly detects the event. Each node that
detects the event randomly chooses a key among its own
keys that is used to generate a MAC. The MAC and the
key index are sent to the CoS node, which then generates
an event report to which the MACs received from the
multiple nodes are attached. The report including the
MACs is forwarded to next intermediate node toward the
sink node.
2.3. En-Route Filtering
Because of the random key assignment, each intermedi-
ate node has a probability that an intermediate node has a
key that can verify a report. When a report is arrived at a
node, the node uses one of its own keys to generate a
MAC. Each node compares the number of key indices
and MACs between the report and the node. If the node
has a larger or smaller number of key indices and MACs
than were decided by the user, or if key indices are de-
rived from the same partitions, the report is dropped by
the node. If neither situation occurs, the node finds a key
that matches the one it chose. When there is a matching
key with the key of the node, the node generates the
MAC using the key. When a key matches that chosen by
the node, the node generates a MAC, which is compared
to the MAC of a report. If the MAC of the node matches
the MAC of a report, the report is forwarded to next node.
If the MACs do not match, the report is considered false
and is dropped
2.4. Sink Verification
After en-route filtering, a few false reports can still arrive
at the sink node because the intermediate nodes use the
same probability to verify reports. However, in SEF, the
sink node has of all keys that are in the global key pool.
Thus, the sink node can filter the false reports. As stated
above, in SEF, false reports can be dropped early and
energy consumption in the sensor network can be re-
duced through use of en-route filtering.
3. Proposed Method
3.1. Motivation
In SEF, each node uses the same probability to verify a
report regardless of its status (false vs. legitimate). Thus,
if there are few or no false reports in the sensor network,
the energy that is consumed verifying legitimate nodes is
wasted. To save verification energy for legitimate reports,
we propose a method that controls a probability of at-
tempts at verification of an event report. Section 3.2
shows the assumption of our proposed method.
3.2. Assumption
The proposed method includes the following assump-
tions:
Each node has a unique identification (ID).
Copyright © 2011 SciRes. WSN
373
H. W. LEE ET AL.
Each node has a table which is composed of two val-
ues: IDs of neighbor nodes and a probability of at-
tempts at verification of an event report of neighbor
nodes.
Each node stores the number of hops from the node to
the sink node.
Each node stores verification results of the ten most
recent reports of every node.
3.3. Operation
Key assignment and node deployment occur the same
way in the proposed method as in SEF. However, in the
proposed method, after these steps, a unique ID is as-
signed to each node and a table is generated that consists
of IDs of neighbor nodes and the probabilities that at-
tempt to verify a report. Figure 2 shows a table that is
composed of two elements: neighbor node IDs and at-
tempts to verify event report probabilities.
As shown in Figure 2, the probabilities of neighbor
nodes are equal to 1, because the information for control-
ling the probability is not yet generated. After ID distri-
bution for sensor nodes and table generation, the nodes
are deployed and keys are assigned to the nodes. Reports
are generated here the same way as in SEF. When an
event occurs, the intermediate nodes that detect the event
elect a CoS node to which MACs are forwarded. The
CoS node generates the event report to which MACs
collected from the intermediate nodes are attached. The
event report is then forwarded to the next node toward
the sink node. Every time the event report is forwarded
to an intermediate node, that node verifies the event re-
port. This en-route filtering step is the differenttiating
feature of the proposed method from the SEF. Figures 3,
4 and 5 show a sample event report verification of the
proposed method.
Tableof node A for its neigh b or no des
ID of Neighbor NodesProbability
B1
C1
D1
E1
.0
.0
.0
.0
Figure 2. Event report verification information.
Figure 3. Check for the probability of the neighbor node.
Node A
Key Index
index1
index2
index3
index4 MAC generation
……
Event Report
Key IndexMAC
index1 MAC5
index4 MAC4
index6 MAC8
index7 MAC9
……
Figure 4. Verification of an event report.
Figure 5. Results of verification for an event report.
Copyright © 2011 SciRes. WSN
H. W. LEE ET AL.
374
As shown Figure 3, when the each node receives the
event report, the node checks identification of the nei-
ghbor node which sends to the node and attempt to verify
a report probability. The node attempts to verify the
report by the probability in Figure 4. After verification
of the report, if the report is a legitimate report, the
probability of the neighbor node becomes low. The
report is forwarded to next node. But if the report is a
false report, the probability of the neighbor node be-
comes high. The report is dropped in Figure 5. When an
intermediate node receive an event report, if the
probability of the neighbor node which forwards the
event report to the intermediate node is high, lots of
energy for verifying the report are consumed. On the
contrary, if the probability is low, less energy is con-
sumed than the probability. The probability is calcu-
lated by three inputs. Figure 6 shows three inputs and
output that is probability of attempts at verification of a
report using a fuzzy system.
The following figures are shown the three inputs
which are used to calculate the probability
Figure 7 Shows a fuzzy membership function of the
number of neighbor nodes. Figure 8 shows a fuzzy
membership function of the number of from a node to a
sink node. Figure 9, the fuzzy values of three fuzzy
membership functions are in the range of 0-1. The values
belong to the fuzzy set, which is composed of three
levels: small, medium, and large. A fuzzy membership
function of a probability of attempts at verification of an
event report comes from the three membership functions.
Figure 10 shows an output fuzzy membership function
of the probability.
Fuzzy
System
INPUT
-The number of neighbor nodes
-The number of hops
-The rate of false reports
OUTPUT
Probability of attempts at
verification of a report
Figure 6. Input and output in fuzzy syste m .
Figure 7. Fuzzy membership function for the number of
neighbor nodes.
Figure 8. Fuzzy membership function for the number of
hops from a node to sink node.
Figure 9. Fuzzy membership function for the rate of false
reports.
Figure 10, a fuzzy value of the probability is in the
range of 0 - 1. The value belongs to the fuzzy set which
is composed of five levels: very small, small, medium,
large, and very large. The fuzzy membership functions
are defined by fuzzy rules that are designed by a user.
The part of fuzzy rules of proposed method is shown
in Table 1.
In our proposed method, each sensor node verifies a
report controlling the probability of attempts at verifica-
tion of an event report that is calculated by the fuzzy
system for its neighbor nodes. The proposed method
controls the probability and consumes less node’s energy
than SEF. A comparison of the energy efficiency be-
tween the proposed method and SEF is able to express
some equations. Equation (1) represents the probability
that a node includes a key that has not been compro-
mised by an attacker [4]. Table 2 explains elements de-
termining P1
1
c
kT N
PN
(1)
Copyright © 2011 SciRes. WSN
375
H. W. LEE ET AL.
Figure 10. Fuzzy membership function for the attempts to
verify an event report probability.
Table 1. Fuzzy rules.
Input Output
Rule
NN NH RF Probability
0 Small Small Small VS
6 Small Large Small S
10 Medium Small Medium M
17 Medium Large Large L
22 Large Medium Medium VL
*NN (neighbor nodes), NH (node’s hops), RF (rate of false reports).
Table 2. Elements determining P1 in Equation (1).
T The number of MACs in the event report
Nc The number of keys disclosed to an attacker
k The number of keys of a node
N The number of keys in the global key pool
The probability P1 is used to calculate a probability
that is used to filter false reports. In this paper, P1 is a
probability that is used to filter false reports. Table 3
shows the probabilities to compare the energy efficiency
between the proposed method and SEF.
Equation (2) represents the probability that is used to
filter false reports in SEF.
11
fsts ts
PPPP  (2)
Equation (3) represents the probability that is used to
filter false reports in the proposed method.
10
fptp tp
PPP P 1
(3)
Table 3. Probabilities for a comparison of energy efficiency.
Pfs The probability of filtering a false report in SEF
Pfp The probability of filtering a false report in proposed method
Pts an attempt to verify a report probability in SEF
Ptp an attempt to verify a report probability in proposed method
As shown above, Pts is always 1, but Ptp is in the range
of 0 - 1. If the verification energy consumption of a sen-
sor node in SEF is 1, the verification energy of the node
in the proposed method is always the same as or smaller
than the one in SEF. We simulate this proposed method
in section 4 to investigate the method.
4. Simulation
In this section, we explain the simulation results of the
proposed method. This simulation was performed to
show the energy efficiency of the proposed method
compared with that of SEF. The simulation included
several environments. First is the sensor field, which is
100 m wide and 100 m tall. Within this sensor field, 600
sensor nodes are deployed. A sink node in this sensor
field includes 100 keys in global key pool. The global
key pool is divided into 10 partitions, each of which in-
cludes 10 keys. The sensor node energies are 0.3 J. Also,
the energies that are consumed by receiving an event
report are 12.5 µJ, the energies that are consumed by
sending the event report are 16.25 µJ. Approximately 75
μJ are consumed by the event report verification. The
event report packet is 24 bytes. The probability that a
node has a key that is not compromised (P1) is 0.4. This
simulation was divided into two aspects. The first aspect
is energy efficiency. A simulation comparing energy
efficiency was made between SEF and the proposed
method. The simulation was tested in two environments:
when a rate of false reports which were generated by
sensor nodes in the sensor field was 10%, and when the
rate of false reports was 30%. Figure 11 compares SEF
and the proposed method in terms of energy consumption
of sensor nodes when the rate of false reports was 10%.
Figure 11 shows that less sensor node energy was
consumed in the proposed method than in the SEF when
the rate of false reports was 10%. We found that 3.5%
less energy was consumed in the proposed method than
that in SEF on average. Figure 12 compares SEF and the
proposed method in terms of energy consumption of the
sensor nodes when the rate of false reports was 30%.
Figure 12 also indicates that less sensor node energy
was consumed in the proposed method than in the SEF
when the rate of false reports was 30%. We found that 3%
Copyright © 2011 SciRes. WSN
H. W. LEE ET AL.
376
Figure 11. Comparison of energy consumption (The rate of
false reports is 10%).
Figure 12. Comparison of energy consumption (The rate of
false reports is 30%).
less energy was consumed in the proposed method than
that in SEF on average. Figures 13 and 14 indicate that
when the false report rate was low in a sensor network,
the energy efficiency of the proposed method was greater
than that of the SEF.
The second aspect is security. Because the proposed
method controls probability using intermediate nodes to
verify an event report in the sensor network, the security
of the proposed method has to be tested and compared
against that of the SEF. Thus, this simulation also was
tested in two environments. Figure 13 compares the
number of false reports in SEF with the number of false
reports that were not filtered by sensor nodes in en-route
filtering in the proposed method when the false report
rate was 10%.
Figure 13 shows that the number of false reports that
were not filtered by en-route filtering in the proposed
method is similar to the number of false reports in SEF.
Actually, an average of 0.03 more false reports was seen
in the proposed method than the average seen in SEF.
Figure 14 compares the number of false reports in SEF
with the number of false reports that were not filtered
Figure 13. Comparison of the number of false reports (The
rate of false reports is 10%).
Figure 14. Comparison of the number of false reports (The
rate of false reports is 30%).
by en-route filtering in the proposed method when the
false report rate was 30%.
Figure 14 shows that the number of false reports that
were not filtered by en-route filtering between SEF and
proposed method is again similar. An average of 2.61
more false reports was seen in the proposed method than
the average seen in SEF. As shown above, the security
level of the proposed method is similar to that of SEF.
Moreover, both SEF and the proposed method contain a
sink verification step in which all unfiltered false reports
are dropped. Thus, the energy efficiency of the proposed
method is the more important factor.
5. Conclusions
Sensor networks, which are used in open environments,
are vulnerable to physical attacks from the outside. A
false report injection attack is a physical attack in which
a node compromised by an attacker forwards many false
reports that are not based on real events. Sensor node
energy is thus wasted by the attack. However, there are
many solutions that defend against false report injection
Copyright © 2011 SciRes. WSN
H. W. LEE ET AL.
Copyright © 2011 SciRes. WSN
377
attacks. One such solution is SEF, in which any time a
node in the sensor network receives an event report, it
verifies the validity of that report using a fixed pro-
bability. If the event report is false, the node drops it.
Thus, SEF prevents energy waste by filtering false re-
ports early. However, if the false report rate in the sensor
network is low, sensor node energy is wasted because the
nodes in SEF verify both false and legitimate reports as
the same probability. Thus, in this paper, we suggested a
method by which each sensor node controls The pro-
bability is determined by a fuzzy system. The fuzzy sys-
tem of the proposed method has three inputs: the number
of neighbor nodes, the number of hops from the sensor
node to the sink node, and the rate of false reports among
the ten most recent event reports received from a
neighbor node. We performed four simulations to prove
the energy efficiency of the proposed method. The first
simulation compared energy consumption of SEF and the
proposed method for various false reports rates. We also
compared the number of false reports that were not fil-
tered. Thus, our proposed method can be respected for its
energy efficiency in sensor network.
6. Acknowledgements
This research was supported by Basic Science Research
Program through the National Research Foundation of
Korea (NRF) funded by the Ministry of Education, Sci-
ence and Technology (No. 2011-0004955).
7. References
[1] I. F. Akyildiz, W. L. Su, Y. Sankarasubramaniam and E.
Cayirci, “A Survey on Sensor Networks,” IEEE Commu-
nications Magazine, Vol. 40, No. 8, 2002, pp. 102-114.
doi:10.1109/MCOM.2002.1024422
[2] F. Li and J. Wu, “A Probabilistic Voting-Based Filtering
Scheme in Wireless Sensor Networks,” Proceedings of
the 2006 International Conference on Wireless Commu-
nications and Mobile Computing, Vancouver, 3-6 July
2006, pp. 27-32.
[3] B. Przydatek, D. Song and A. Perrig, “SIA: Secure In-
formation Aggregation in Sensor Networks,” Proceed-
ings of the 1st International Conference on Embedded
Networked Sensor Systems, Los Angeles, 5-7 November
2003.
[4] F. Ye, H. Y. Luo, S. W. Lu and L. X. Zhang, “Statistical
En-Route Filtering of Injected False Data in Sensor Net-
works,” 23rd Annual Joint Conference of the IEEE Com-
puter and Communications Societies, Vol. 4, No. 7-11,
2004, pp. 2446-2457.
[5] H. Yang and S. W. Lu, “Commutative Cipher Based
En-Route Filtering in Wireless Sensor Networks,” IEEE
60th Vehicular Technology Conference, Vol. 2, Los An-
geles, 26-29 September 2004, pp. 1223-1227
[6] C. Karlof and D. Wagner, “Secure Routing in Wireless
Sensor Networks: Attacks and Countermeasures,” Pro-
ceedings of the First IEEE: 2003 IEEE International
Workshop on Sensor Network Protocols and Applications,
Anchorage, 11 May 2003, pp. 113-127.