Paper Menu >>
Journal Menu >>
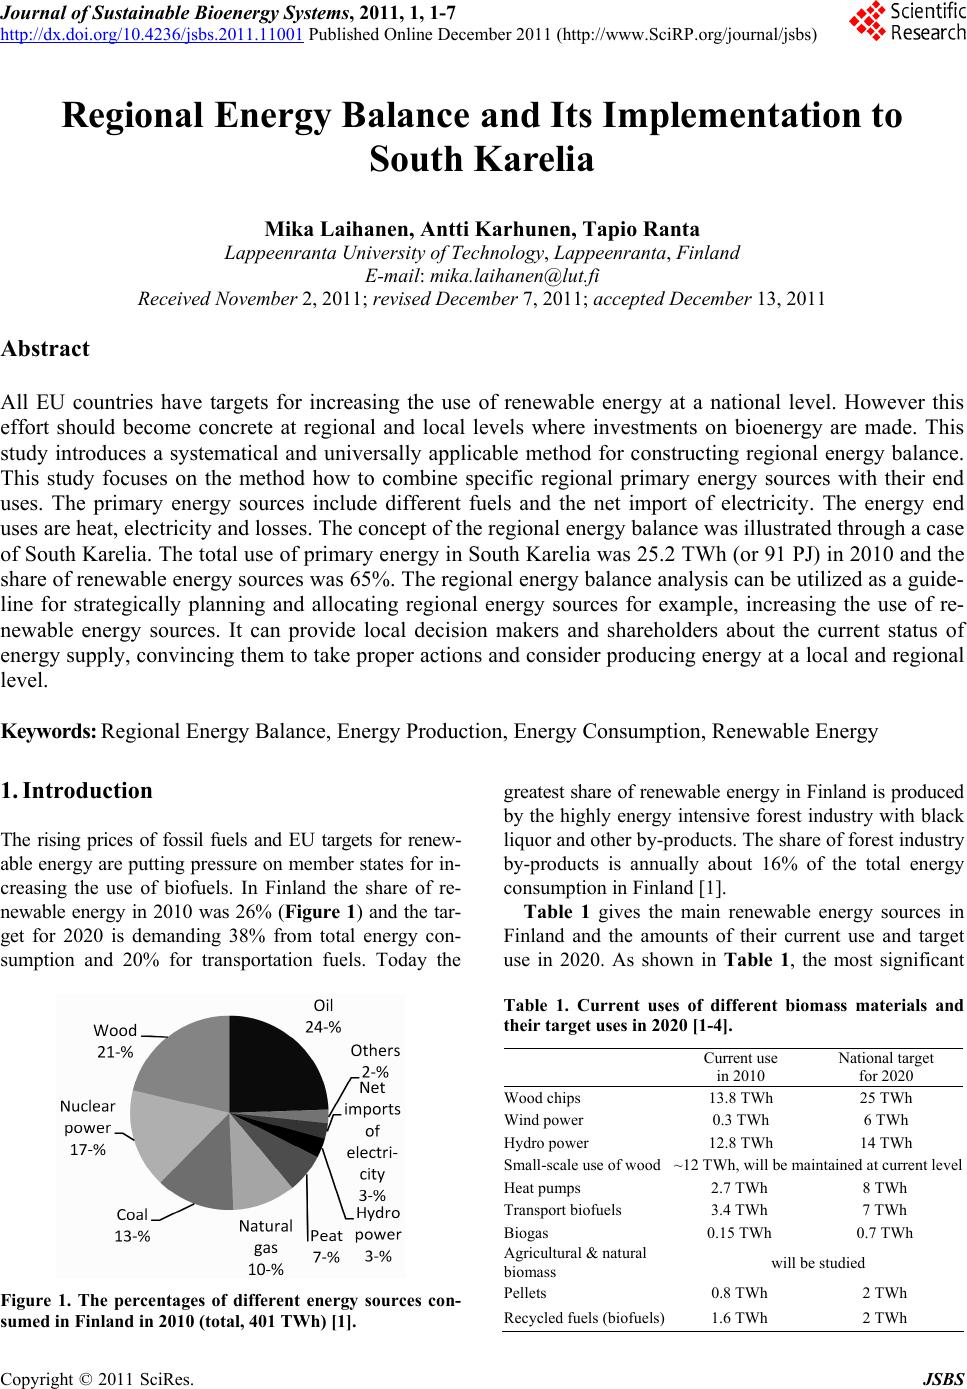 Journal of Sustainable Bioenergy Systems, 2011, 1, 1-7 http://dx.doi.org/10.4236/jsbs.2011.11001 Published Online December 2011 (http://www.SciRP.org/journal/jsbs) Copyright © 2011 SciRes. JSBS Regional Energy Balance and Its Implementation to South Karelia Mika Laihanen, Antti Karhunen, Tapio Ranta Lappeenranta University of Technology, Lappeenranta, Finland E-mail: mika.laihanen@lut.fi Received November 2, 2011; revised December 7, 2011; accepted December 13, 2011 Abstract All EU countries have targets for increasing the use of renewable energy at a national level. However this effort should become concrete at regional and local levels where investments on bioenergy are made. This study introduces a systematical and universally applicable method for constructing regional energy balance. This study focuses on the method how to combine specific regional primary energy sources with their end uses. The primary energy sources include different fuels and the net import of electricity. The energy end uses are heat, electricity and losses. The concept of the regional energy balance was illustrated through a case of South Karelia. The total use of primary energy in South Karelia was 25.2 TWh (or 91 PJ) in 2010 and the share of renewable energy sources was 65%. The regional energy balance analysis can be utilized as a guide- line for strategically planning and allocating regional energy sources for example, increasing the use of re- newable energy sources. It can provide local decision makers and shareholders about the current status of energy supply, convincing them to take proper actions and consider producing energy at a local and regional level. Keywords: Regional Energy Balance, Energy Production, Energy Consumption, Renewable Energy 1. Introduction The rising prices of fossil fuels and EU targets for renew- able energy are putting pressure on member states for in- creasing the use of biofuels. In Finland the share of re- newable energy in 2010 was 26% (Figure 1) and the tar- get for 2020 is demanding 38% from total energy con- sumption and 20% for transportation fuels. Today the Figure 1. The percentages of different energy sources con- sumed in Finland in 2010 (total, 401 TWh) [1]. greatest share of renewable energy in Finland is produced by the highly energy intensive forest industry with black liquor and other by-products. The share of forest industry by-products is annually about 16% of the total energy consumption in Finland [1]. Table 1 gives the main renewable energy sources in Finland and the amounts of their current use and target use in 2020. As shown in Table 1, the most significant Table 1. Current uses of different biomass materials and their target uses in 2020 [1-4]. Current use in 2010 National target for 2020 Wood chips 13.8 TWh 25 TWh Wind power 0.3 TWh 6 TWh Hydro power 12.8 TWh 14 TWh Small-scale use of wood~12 TWh, will be maintained at current level Heat pumps 2.7 TWh 8 TWh Transport biofuels 3.4 TWh 7 TWh Biogas 0.15 TWh 0.7 TWh Agricultural & natural biomass will be studied Pellets 0.8 TWh 2 TWh Recycled fuels (biofuels)1.6 TWh 2 TWh 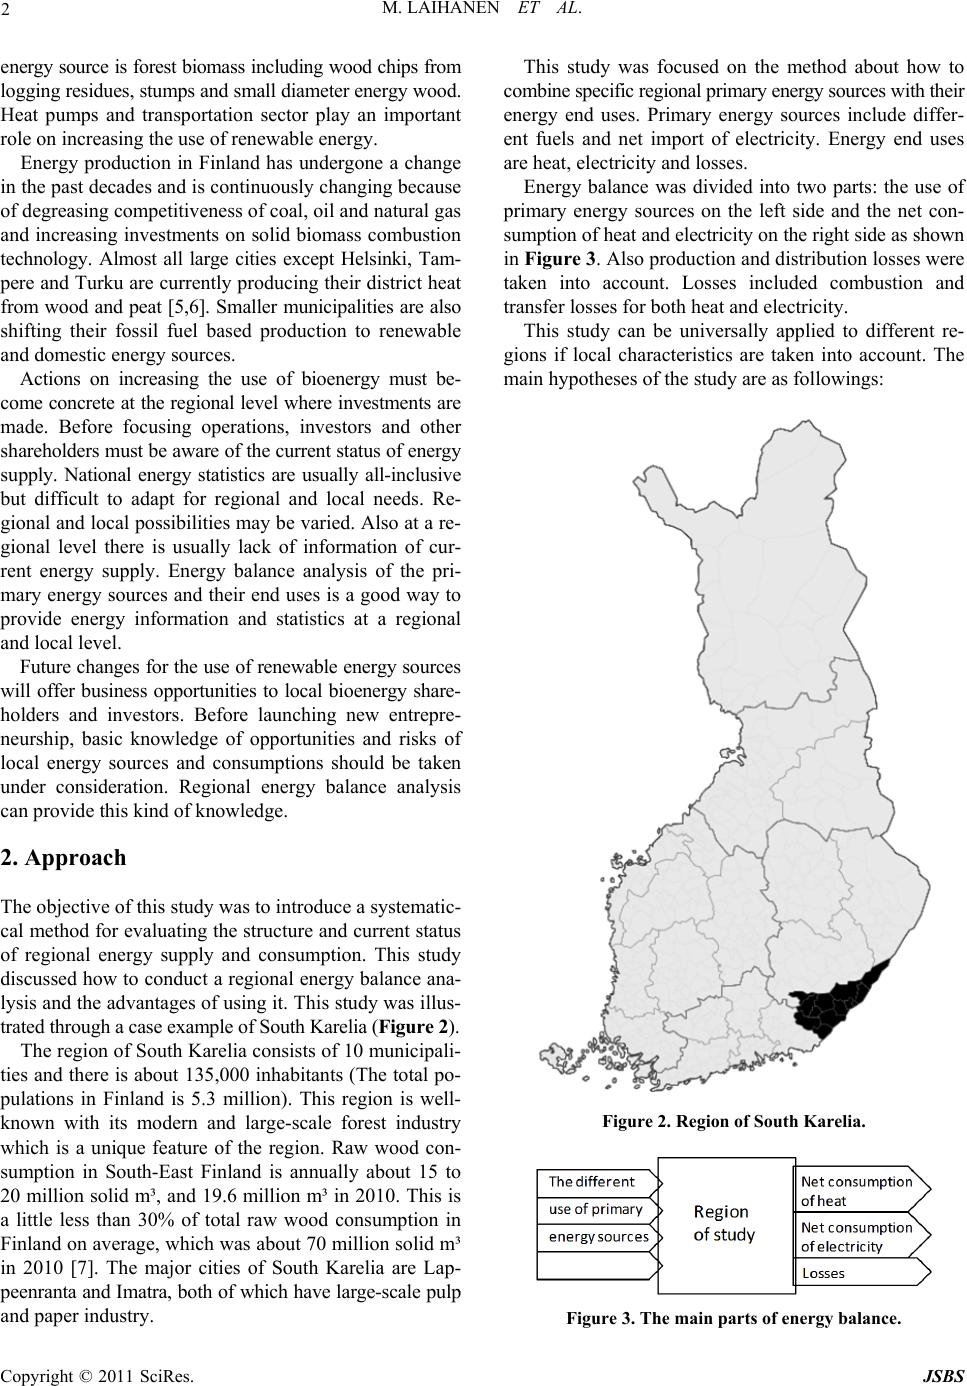 M. LAIHANEN ET AL. 2 energy source is forest biomass including wood chips from logging residues, stumps and small diameter energy wood. Heat pumps and transportation sector play an important role on increasing the use of renewable energy. Energy production in Finland has undergone a change in the past decades and is continuously changing because of degreasing competitiveness of coal, oil and natural gas and increasing investments on solid biomass combustion technology. Almost all large cities except Helsinki, Tam- pere and Turku are currently producing their district heat from wood and peat [5,6]. Smaller municipalities are also shifting their fossil fuel based production to renewable and domestic energy sources. Actions on increasing the use of bioenergy must be- come concrete at the regional level where investments are made. Before focusing operations, investors and other shareholders must be aware of the current status of energy supply. National energy statistics are usually all-inclusive but difficult to adapt for regional and local needs. Re- gional and local possibilities may be varied. Also at a re- gional level there is usually lack of information of cur- rent energy supply. Energy balance analysis of the pri- mary energy sources and their end uses is a good way to provide energy information and statistics at a regional and local level. Future changes for the use of renewable energy sources will offer business opportunities to local bioenergy share- holders and investors. Before launching new entrepre- neurship, basic knowledge of opportunities and risks of local energy sources and consumptions should be taken under consideration. Regional energy balance analysis can provide this kind of knowledge. 2. Approach The objective of this study was to introduce a systematic- cal method for evaluating the structure and current status of regional energy supply and consumption. This study discussed how to conduct a regional energy balance ana- lysis and the advantages of using it. This study was illus- trated through a case example of South Karelia (Figure 2). The region of South Karelia consists of 10 municipali- ties and there is about 135,000 inhabitants (The total po- pulations in Finland is 5.3 million). This region is well- known with its modern and large-scale forest industry which is a unique feature of the region. Raw wood con- sumption in South-East Finland is annually about 15 to 20 million solid m³, and 19.6 million m³ in 2010. This is a little less than 30% of total raw wood consumption in Finland on average, which was about 70 million solid m³ in 2010 [7]. The major cities of South Karelia are Lap- peenranta and Imatra, both of which have large-scale pulp and paper industry. This study was focused on the method about how to combine specific regional primary energy sources with their energy end uses. Primary energy sources include differ- ent fuels and net import of electricity. Energy end uses are heat, electricity and losses. Energy balance was divided into two parts: the use of primary energy sources on the left side and the net con- sumption of heat and electricity on the right side as shown in Figure 3. Also production and distribution losses were taken into account. Losses included combustion and transfer losses for both heat and electricity. This study can be universally applied to different re- gions if local characteristics are taken into account. The main hypotheses of the study are as followings: Figure 2. Region of South Karelia. Figure 3. The main parts of energy balance. Copyright © 2011 SciRes. JSBS 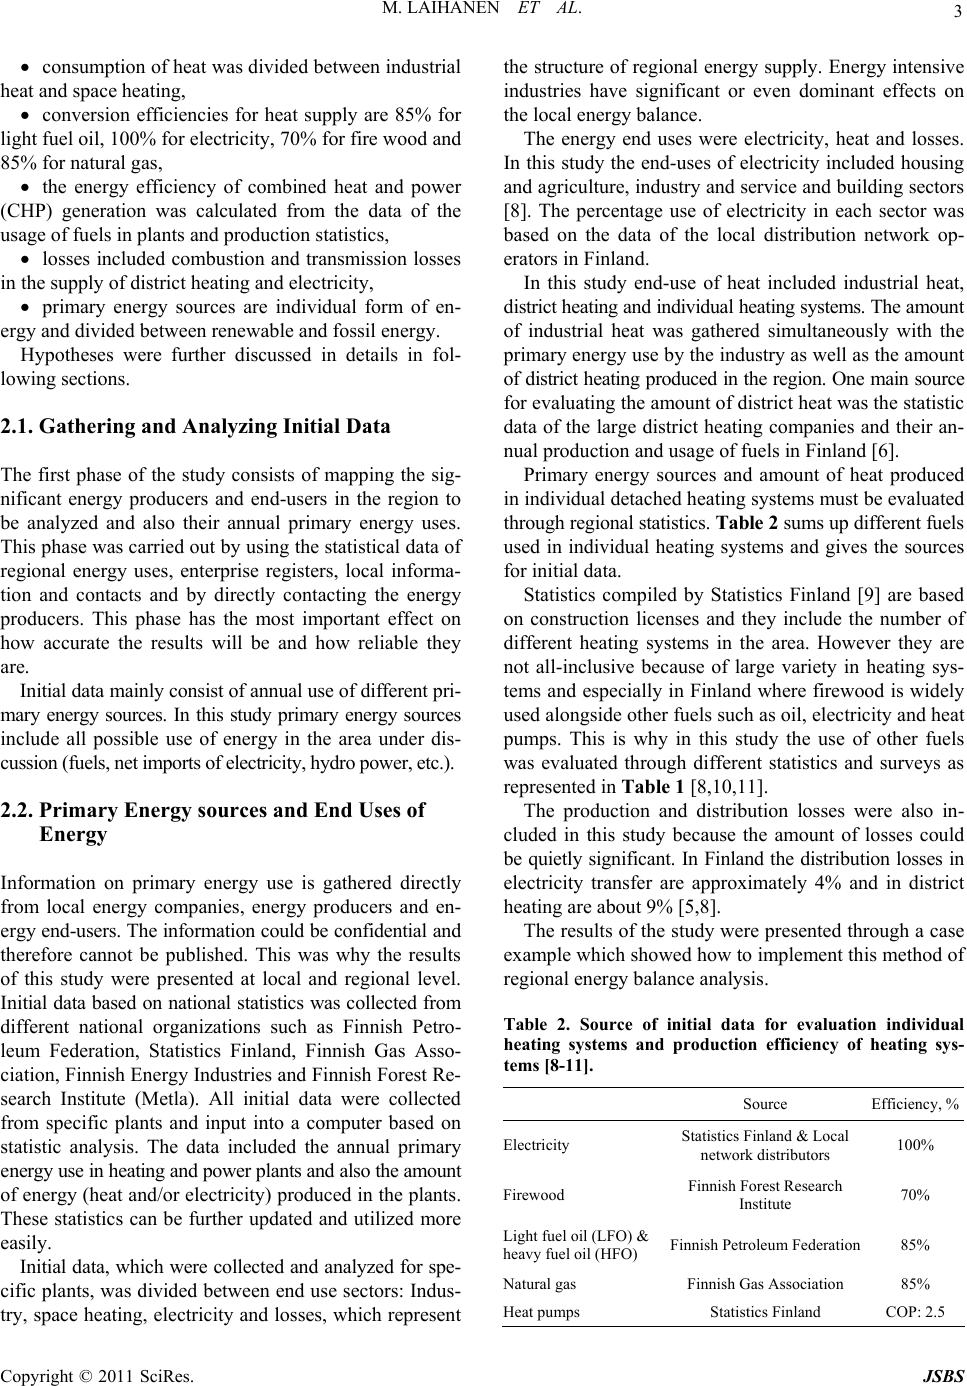 3 M. LAIHANEN ET AL. consumption of heat was divided between industrial heat and space heating, conversion efficiencies for heat supply are 85% for light fuel oil, 100% for electricity, 70% for fire wood and 85% for natural gas, the energy efficiency of combined heat and power (CHP) generation was calculated from the data of the usage of fuels in plants and production statistics, losses included combustion and transmission losses in the supply of district heating and electricity, primary energy sources are individual form of en- ergy and divided between renewable and fossil energy. Hypotheses were further discussed in details in fol- lowing sections. 2.1. Gathering and Analyzing Initial Data The first phase of the study consists of mapping the sig- nificant energy producers and end-users in the region to be analyzed and also their annual primary energy uses. This phase was carried out by using the statistical data of regional energy uses, enterprise registers, local informa- tion and contacts and by directly contacting the energy producers. This phase has the most important effect on how accurate the results will be and how reliable they are. Initial data mainly consist of annual use of different pri- mary energy sources. In this study primary energy sources include all possible use of energy in the area under dis- cussion (fuels, net imports of electricity, hydro power, etc.). 2.2. Primary Energy sources and End Uses of Energy Information on primary energy use is gathered directly from local energy companies, energy producers and en- ergy end-users. The information could be confidential and therefore cannot be published. This was why the results of this study were presented at local and regional level. Initial data based on national statistics was collected from different national organizations such as Finnish Petro- leum Federation, Statistics Finland, Finnish Gas Asso- ciation, Finnish Energy Industries and Finnish Forest Re- search Institute (Metla). All initial data were collected from specific plants and input into a computer based on statistic analysis. The data included the annual primary energy use in heating and power plants and also the amount of energy (heat and/or electricity) produced in the plants. These statistics can be further updated and utilized more easily. Initial data, which were collected and analyzed for spe- cific plants, was divided between end use sectors: Indus- try, space heating, electricity and losses, which represent the structure of regional energy supply. Energy intensive industries have significant or even dominant effects on the local energy balance. The energy end uses were electricity, heat and losses. In this study the end-uses of electricity included housing and agriculture, industry and service and building sectors [8]. The percentage use of electricity in each sector was based on the data of the local distribution network op- erators in Finland. In this study end-use of heat included industrial heat, district heating and individual heating systems. The amount of industrial heat was gathered simultaneously with the primary energy use by the industry as well as the amount of district heating produced in the region. One main source for evaluating the amount of district heat was the statistic data of the large district heating companies and their an- nual production and usage of fuels in Finland [6]. Primary energy sources and amount of heat produced in individual detached heating systems must be evaluated through regional statistics. Table 2 sums up different fuels used in individual heating systems and gives the sources for initial data. Statistics compiled by Statistics Finland [9] are based on construction licenses and they include the number of different heating systems in the area. However they are not all-inclusive because of large variety in heating sys- tems and especially in Finland where firewood is widely used alongside other fuels such as oil, electricity and heat pumps. This is why in this study the use of other fuels was evaluated through different statistics and surveys as represented in Table 1 [8,10,11]. The production and distribution losses were also in- cluded in this study because the amount of losses could be quietly significant. In Finland the distribution losses in electricity transfer are approximately 4% and in district heating are about 9% [5,8]. The results of the study were presented through a case example which showed how to implement this method of regional energy balance analysis. Table 2. Source of initial data for evaluation individual heating systems and production efficiency of heating sys- tems [8-11]. Source Efficiency, % Electricity Statistics Finland & Local network distributors 100% Firewood Finnish Forest Research Institute 70% Light fuel oil (LFO) & heavy fuel oil (HFO) Finnish Petroleum Federation 85% Natural gas Finnish Gas Association 85% Heat pumps Statistics Finland COP: 2.5 Copyright © 2011 SciRes. JSBS 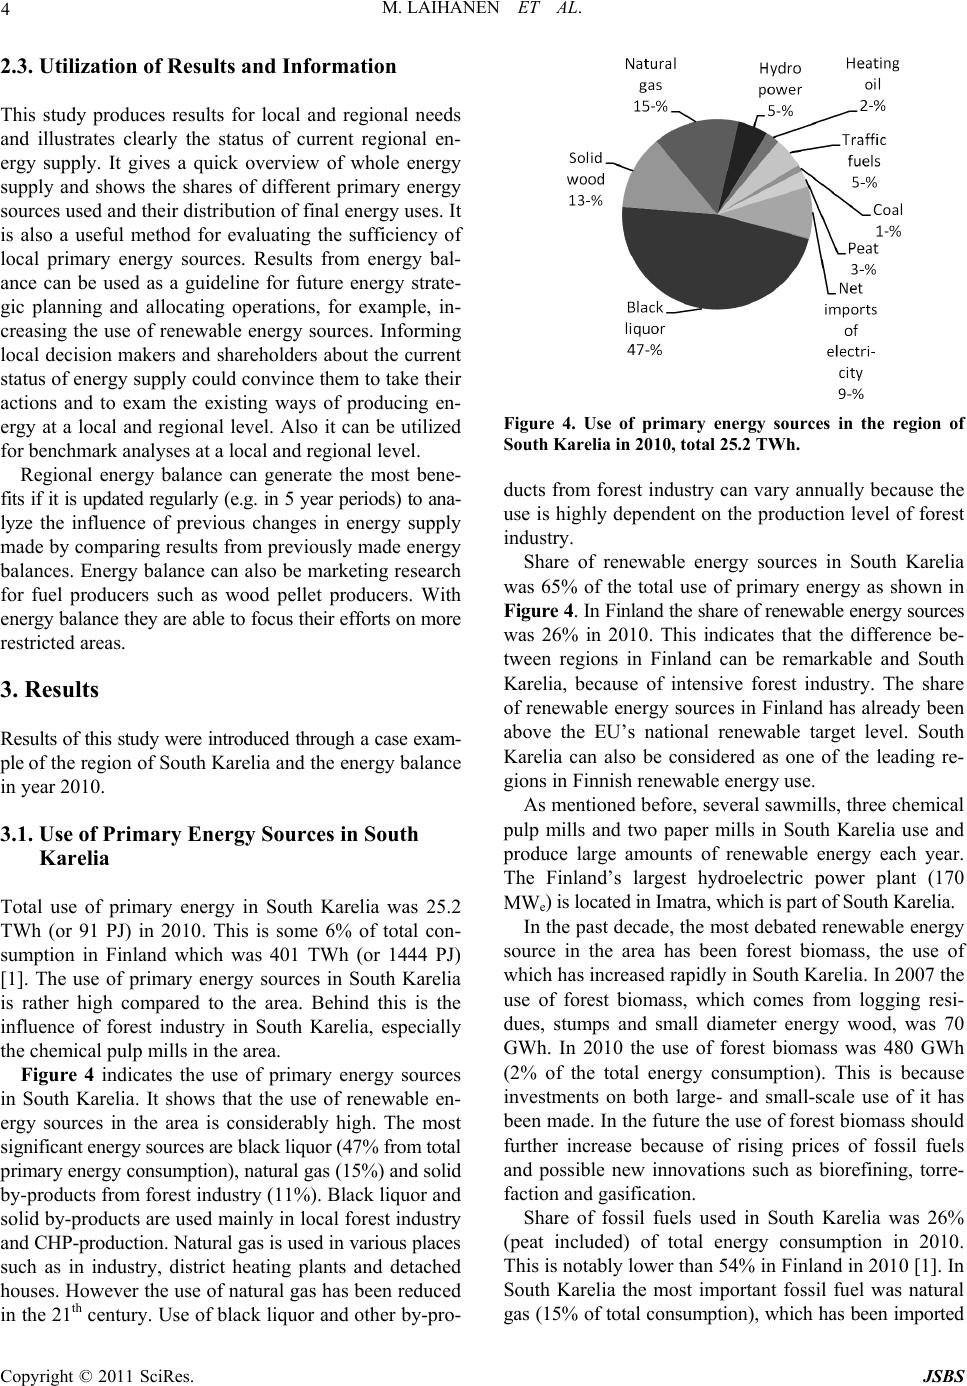 M. LAIHANEN ET AL. 4 2.3. Utilization of Results and Information This study produces results for local and regional needs and illustrates clearly the status of current regional en- ergy supply. It gives a quick overview of whole energy supply and shows the shares of different primary energy sources used and their distribution of final energy uses. It is also a useful method for evaluating the sufficiency of local primary energy sources. Results from energy bal- ance can be used as a guideline for future energy strate- gic planning and allocating operations, for example, in- creasing the use of renewable energy sources. Informing local decision makers and shareholders about the current status of energy supply could convince them to take their actions and to exam the existing ways of producing en- ergy at a local and regional level. Also it can be utilized for benchmark analyses at a local and regional level. Regional energy balance can generate the most bene- fits if it is updated regularly (e.g. in 5 year periods) to ana- lyze the influence of previous changes in energy supply made by comparing results from previously made energy balances. Energy balance can also be marketing research for fuel producers such as wood pellet producers. With energy balance they are able to focus their efforts on more restricted areas. 3. Results Results of this study were introduced through a case exam- ple of the region of South Karelia and the energy balance in year 2010. 3.1. Use of Primary Energy Sources in South Karelia Total use of primary energy in South Karelia was 25.2 TWh (or 91 PJ) in 2010. This is some 6% of total con- sumption in Finland which was 401 TWh (or 1444 PJ) [1]. The use of primary energy sources in South Karelia is rather high compared to the area. Behind this is the influence of forest industry in South Karelia, especially the chemical pulp mills in the area. Figure 4 indicates the use of primary energy sources in South Karelia. It shows that the use of renewable en- ergy sources in the area is considerably high. The most significant energy sources are black liquor (47% from total primary energy consumption), natural gas (15%) and solid by-products from forest industry (11%). Black liquor and solid by-products are used mainly in local forest industry and CHP-production. Natural gas is used in various places such as in industry, district heating plants and detached houses. However the use of natural gas has been reduced in the 21th century. Use of black liquor and other by-pro- Figure 4. Use of primary energy sources in the region of South Karelia in 2010, total 25.2 TWh. ducts from forest industry can vary annually because the use is highly dependent on the production level of forest industry. Share of renewable energy sources in South Karelia was 65% of the total use of primary energy as shown in Figure 4. In Finland the share of renewable energy sources was 26% in 2010. This indicates that the difference be- tween regions in Finland can be remarkable and South Karelia, because of intensive forest industry. The share of renewable energy sources in Finland has already been above the EU’s national renewable target level. South Karelia can also be considered as one of the leading re- gions in Finnish renewable energy use. As mentioned before, several sawmills, three chemical pulp mills and two paper mills in South Karelia use and produce large amounts of renewable energy each year. The Finland’s largest hydroelectric power plant (170 MWe) is located in Imatra, which is part of South Karelia. In the past decade, the most debated renewable energy source in the area has been forest biomass, the use of which has increased rapidly in South Karelia. In 2007 the use of forest biomass, which comes from logging resi- dues, stumps and small diameter energy wood, was 70 GWh. In 2010 the use of forest biomass was 480 GWh (2% of the total energy consumption). This is because investments on both large- and small-scale use of it has been made. In the future the use of forest biomass should further increase because of rising prices of fossil fuels and possible new innovations such as biorefining, torre- faction and gasification. Share of fossil fuels used in South Karelia was 26% (peat included) of total energy consumption in 2010. This is notably lower than 54% in Finland in 2010 [1]. In South Karelia the most important fossil fuel was natural gas (15% of total consumption), which has been imported Copyright © 2011 SciRes. JSBS  5 M. LAIHANEN ET AL. from Russia since 1970’s. The length of Finland’s natural gas grid is about 1000 km and it covers only the southern part of the country. [11] Other significant fossil fuels used in South Karelia are oil products (7% of total con- sumption), peat (3%) and coal (1%). Regional energy balance was analyzed based on the data from specific local plants which enable to show re- sults for different local municipalities and areas as shown in Table 3. The municipal review of the energy uses made the focus of local operations easier and also clearly pointed out positive/negative examples. In this study the differences among municipalities de- pended mainly on the structure of local industry, popula- tion and availability of energy sources such as natural gas. As shown in Table 3 there are two municipalities that dominate the regional energy balance in South Kare- lia, Lappeenranta and Imatra. The share of total energy consumption in these two municipalities was 93% to- gether. Reason for this is that both municipalities have na- tionally significant energy intensive forest industry. Regional energy balance can also be used as background information for regional and local emission balance ana- lysis. For example carbon dioxide (CO2) and other emis- sions from energy production can be easily calculated from regional energy balance. In this study only the carbon dioxide emissions were calculated, which is given in Figure 5. Total amount of 2-emissions from energy production was 2.1 million tons of 2 in South Karelia. This is some 4% of total 2-emission from energy production in Finland (Fin- land total: ~55 million t2 CO ). Most of the CO2-emis- sions in South Karelia came from the combustion of nat- ural gas (35%). Amounts of carbon dioxide emission vary yearly depending on emission trading, use of fuels and fuel prices. 2-emission from net imports of electri- city was determined from average emission from total electricity supply in Finland [1,12-14]. CO CO CO CO 3.2. Final Energy Consumption and Energy Balance of South Karelia The right side of the energy balance shows the final en- ergy consumption and losses as shown in Figure 3. In this study the final energy consumption included net consump- tion of heat, net consumption of electricity and losses. Traffic sector was also included, but it was managed in- dividually and separated from heat and electricity. If neces- sary the end-use of energy can also be divided as well among different sectors: industry (inc. heat and electric- ity), public sector and households. As discussed earlier, industry is the main user of en- ergy in South Karelia with annual share of 70% from total energy consumption. In Finland this share is about 50%. The share of industrial end-use of electricity was 81% and the end use of heat was 66% in South Karelia in 2010. South Karelia is also the largest user of energy and elec- tricity among all regions in Finland [8,15]. In Europe and as well in Finland, it has been debated about more energy efficient buildings, which has driven the heating systems to use more renewable energy sources. In Finland energy efficiency in energy production has been usually rather high because of the use of CHP pro- duction. In South Karelia, CHP production and district heating is the main heating system for space heating as shown in Figure 6. The share of district heating was 39% in South Karelia and a bit higher 50% in Finland on average [5]. The total amount of energy used for space heating in South Karelia is 2.0 TWh per year. Table 3. Use of primary energy sources in municipalities of South Karelia. South Karelia, tot. 25.2 TWh Share of total consumption,% Renewables, % Non-renewables, % Lappeenranta55% 58% 42% Imatra 38% 81% 19% Rautjärvi 3.5% 31% 69% Luumäki 1% 11% 89% Parikkala 0.6% 26% 74% Savitaipale 0.5% 39% 61% Ruokolahti 0.5% 25% 75% Taipalsaari 0.5% 26% 74% Lemi 0.3% 31% 69% Suomenniemi0.1% 32% 68% Total 100% 65% 38% Figure 5. Carbon dioxide emission from energy production in South Karelia 2010, total 2.1 million tons of CO2. Copyright © 2011 SciRes. JSBS  M. LAIHANEN ET AL. Copyright © 2011 SciRes. JSBS 6 fic sector was excluded from losses and dealt individually without losses. This is because traffic sector differs sig- nificantly from conventional heat and power production. The losses were calculated from the difference between sold energy and fuel input. Total share of losses was 16% from total energy consumption. Energy balance of South Karelia is shown in Figure 7. 4. Discussion and Conclusions Because of national energy statistics are difficult to be adapted for regional needs, a regional energy balance ana- lysis is a useful and informative method for examining the current use of primary energy sources combined with their final energy consumption. This study provided a me- thod for analyzing regional energy balance and discuss- ing the benefits of using it. Figure 6. Individual heating systems in South Karelia tot. 2.0 TWh. There is quite intensive use of small scale combustion of firewood in South Karelia and Finland (21% in South Karelia). Using firewood is quite common in Finnish de- tached houses, farms and summer cottages. In this study refined wood products such as wood pellets and briquettes were included in small scale combustion of wood and different type of heat pumps were included together with electricity. Heat pumps have a share of about 5% in Fin- nish space heating [5]. Energy balance can be utilized as a guideline for the strategic planning of regional energy sources and allo- cating operations of increasing the use of renewable en- ergy sources. It can provide information to local decision makers and shareholders about the current status of en- ergy supply, which will help them to take actions and to consider the existing ways of producing energy at local and regional level. In the future, for example every 5 years, the updated energy balances should be analyzed to indi- cate the influence of formerly executed operations by com- paring yearly energy balances. In this study losses in energy production and transfer consisted of production losses in combustion and transfer losses in electricity grid and district heating network. Traf- Figure 7. The energy balance of South Karelia.  7 M. LAIHANEN ET AL. In local energy policies the current trend is to reduce the use of fossil fuels and imported energy sources and to increase the use of renewable and local energy sources. With the energy balance analysis, it is possible to com- pare the amount of imported energy with own regional primary energy resources. These local energy resources and knowledge of present status of energy supply build up a solid base for the operations in favor of replacing fossil fuels with local renewable energy sources such as logging residues, stumps and small diameter energy wood, refined biofuels and agro biomass. When replacing im- ported fuels with local energy sources it creates employ- ment and prosperity in the area. However it is important to bear in mind that investments on renewable energy and new technology are long-term investments. The energy balance analysis also allows the fact based comparison between regions and communities. However when comparing different regions and communities the structural differences amount different areas such as po- pulation, local resources and the structure and volume of industry should be aware of. For example in Finland, the impact of the forest industry at a local level can be sig- nificant. This study was executed for the region of South Kare- lia which is known for large-scale forest industry. The results of the study support the significance of forest in- dustry in regional energy supply. The share of renewable energy sources was 65%, in South Karelia in 2010, which was a remarkable share compared to other regions in Fin- land. The most significant primary energy source in South Karelia is black liquor. The energy balance analysis is a good base for differ- ent upcoming energy analyses, planning and strategies. Knowing current status of energy supply is vital basic in- formation and guidance for future energy strategic plan- ning, decisions and energy savings projects. Also it en- riches the knowledge for policy makers and participants in the field of energy. The results of this study can be used by different re- search organizations for their further studies. The studies can include various subjects such as biomass supply lo- gistics, decentralized heat and electricity production, in- creasing of energy efficiency and optimizing the use of energy sources. More concrete further operations can be to analyze the projects that replace fossil fuels with local nergy sources in existing heat and power plants. For re- fining biofuels in the future, torrefaction, gasification and biorefineries are also possible options for increasing the use of bioenergy. However these operations are highly capital-intensive and the structural changes in regional and local energy supply may take time. e 5. References [1] Statistics Finland, “Energy Supply, Consumption and Prices,” 4th Quarter, Helsinki, 2010, pp. 1-11. [2] Ministry of Employment and the Economy, Energy De- partment, “Finland’s National Action Plan for Promoting Energy from Renewable Sources Pursuant to Directive 2009/28/EC”. [3] E. Ylitalo, “Puupelletit 2010,” In Finnish, Metla—Fin- nish Forest Research Institute, Statistical Publications Vantaa, 2011. [4] Finnish Petroleum Federation, “Annual Sale of Petroleum Products in Finland,” Helsinki. [5] T. Wilhelms, “Energy Year 2010—District Heating,” Finnish Energy Industries, Helsinki. [6] T. Wilhelms, (Eds.), “District Heating Statistics, 2010,” Finnish Energy Industries, Helsinki. [7] Metla—Finnish Forest Research Institute, “Harvesting and Transportation of Roundwood,” Statistical Yearbook of Forestry, Vantaa, 2011. [8] Finnish Energy Industries, “Electricity Consumption by Region, 2010,” [9] Statistics Finland, “Space Heating by Municipality in Finland, 2010,” Helsinki. [10] J. Torvelainen, “Pientalojen Polttopuun Käyttö 2007/ 2008,” In Finnish, Finnish Forest Research Institute— Metla, Statistical Publications 26/2009, Helsinki. [11] Finnish Gas Association, “Use of Natural Gas by Sectors in South Karelia,” Helsinki. [12] T. Wilhems, “Energy Year 2010—Electricity,” Finnish Energy Industries, Helsinki. [13] VTT, “LIISA 2007—Database,” In Finnish, LIPASTO Traffic Emission (Calculation System for Traffic Exhaust Emission). [14] U. Suomi, J. Hietanen and M. Hellgrén, ”Yksittäisen Kohteen CO2-Päästöjen Laskentaohjeistus ja Käytettävät CO2-Päästökertoimet,” In Finnish, Motiva Oy, 2004, pp. 8,13. [15] Statistics Finland, “Energy Use in Manufacturing 2010,” Official Statistics of Finland, Helsinki. Copyright © 2011 SciRes. JSBS |