Advances in Materials Physics and Chemistry, 2011, 1, 99-107
doi:10.4236/ampc.2011.13017 Published Online December 2011 (http://www.SciRP.org/journal/ampc)
Copyright © 2011 SciRes. AMPC
Transient and Steady State Currents of Bisphenol A
Corncobs Sample
Taha A. Hanafy
1Physics Department, Faculty of Science, Tabuk University, Tabuk, KSA
2Physics Department, Faculty of Science, Fayoum University, Fayoum, Egypt
E-mail: tahanafy2@yahoo.com
Received June 29, 2011; revised August 8, 2011; accepted August 25, 2011
Abstract
Transient current (I-t), current-voltage (I-V) characteristics, and dc conductivity ln(σ) for bisphenol A corn-
cobs (BPACC) sample were investigated. At higher temperatures, I-V characteristics reveal that the dc cur-
rent for the sample undergoes two regions one due to ohmic conduction and the other has been attributed to
Space charge limited current (SCLC). The activation energy (Ea), the electron mobility (μo), effective elec-
tron mobility (μe), the concentration of the charge’s concentrations in conduction band, trapping factor (θ)
and the trap concentration (Nt) were calculated. At lower temperatures, the dc current exhibits a peculiar be-
havior for I-t regime and I-V characteristics. Transient current of BPACC sample exhibits approximately
constant value at constant electric field and it has saturation value for I-V characteristics. The attained results
suggest strongly the applicability of this material in the electrical applications.
Keywords: Bisphenol A Corncobs, Transient Current, I-V Characteristics, Conduction Mechanism
1. Introduction
Phenol and phenolic derivatives are major industrial (pe-
troleum, chemical and plastic) and agricultural by prod-
uct that are found on surface of water as well as in food
and clinical samples. Among these, bisphenol A (BPA)
used to fabricate polycarbonate plastic and resins. BPA
has recently received considerable attention due to its
endocrine disrupting activity and possible toxic envi-
ronmental and health impacts [1-4]. The use of BPA as
the condensation agent with Egyptian corncobs was in-
vestigated [5]. The optimum preparation conditions and
characterization of bisphenol A Egyptian bagasse pith
polycondensation products and corncobs have been re-
ported [5]. The chemical analysis and IR spectroscopy
have shown that bisphenol A Egyptian corncobs (BPACC)
resin has a complicated structure. The resin structure
includes furan and lignin hydrolysate units. They are
present in a random alternation in the resin chains. IR
spectroscopy of soda lignin/bisphenol resin shows the
presence of aliphatic methyl, methylene, O-CH3, and
strong OH groups [6].
A growing interest has been noted in employing the
space charge limited current (SCLC). It is a powerful
tool for study of conduction phenomenon in insulators
[7,8]. It has been successfully used in obtaining general
information about the localized defect states in the for-
bidden gap. The charge injected into the insulator in re-
sponse to an applied voltage using a constant voltage
source is trapped at localized defect. The presence of the
trapping sites in the forbidden gap strongly affects the
current-voltage (I-V) and current-time (I-t) characteris-
tics of the material. The form of (I-V) characteristics
depends on the type of distribution of traps [8,9]. The
magnitude of the current flow is reduced due to trapping
effect [7,10,11]. The appearance of SCLC regime is in-
hibited until a sufficiently large field is applied. The
transition from ohmic behavior to an SLCC regime de-
pends markedly on the distribution of the trapping en-
ergy levels.
Bisphenol A corncobs resin has semicrystalline struc-
ture [6], its amorphous regions act as traps with energy
levels different from these of the crystalline regions. The
presence of impurities, dislocation, cracks, etc within the
BPACC sample may give rise to these energy levels.
These levels act as electron trapping and operative for all
pure and impure polymers [11]. Moreover, the impurities
as well as the polar groups of the BPACC structure will
affect the bulk current. Since the conduction mechanism
of the polymeric sample depends on the applied electric
T. A. HANAFY
100
field, it is important to study the Poole-Frenkel mecha-
nism of conduction in BPACC. The aim of this work is
to investigate the variation of dc current for BPACC
sample as a function of time and the applied voltage at
different temperatures. Therefore, transient current I-t,
I-V characteristics, and dc conductivity for the investi-
gated sample were carried out.
2. Experimental
BPACC was prepared by adding the powder of corncobs
to the bisphenol A in the weight ratio 1:1 (5 g of each)
together with 0.566 g mole HCl/50 ml and maintaining at
95˚C - 100˚C for 8 hr. The product was cooled and neu-
tralized with 0.1 of ammonium hydroxyl solution. The
sample was washed with a diluted acetic acid (30%) to
remove any bisphenol molecules. The polycondensate
was washed with hot water and allowed to dry. The dry
resin was ground to a powder. The chemical structure of
BPACC is shown in Figure 1. A tablet of the investi-
gated sample was obtained by presses 2.0 mg of BPACC
under the pressure of 1.96 × 10⁸ N/m2. The obtained
BPACC sample has a radius and a thickness of 0.45 cm
and 1.3 mm, respectively.
The dc electrical current was measured by a Keithly
485 auto ranging picoammeter (Cleveland, OH, USA).
The temperature of the sample was measured by a k-type
thermocouple connected to a degi-sense digital ther-
mometer (USA) with an accuracy ±1. For ohmic contacts,
the surface of the samples was coated with silver paste.
3. Results and Discussion
3.1. Transient Current
Figure 2 illustrates the time dependence of dc current for
BPACC sample at different applied electric fields (Ep) of 1,
3, 5 and 7 kV/cm, forward direction, and at 300 K. It is
clear that, dc current of the investigated sample decreases
with the increase of the applied electric field. Also, the dc
current, at Ep= 3 kV/cm, decreases with the increase of
the time up to 3 min and then increase again with the
time up to 10 min. After 10 min the current of BPACC
CH3
CH2
CH
OH
H3C
OH
OH
MeO
Figure 1. The chemical structure of BPACC.
1.3
1.34
1.38
1.42
1.46
1.5
0510 15 20 25 30 35 40 45 50
Time (min)
A
1 kV/cm
3 kV/cm
5 kV/cm
7 kV/cm
Figure 2. Transient current curves for BPACC sample at different applied electric fields and at 300 K.
Copyright © 2011 SciRes. AMPC
T. A. HANAFY
Copyright © 2011 SciRes. AMPC
101
sample exhibits a saturation value for the time interval
from 10 to about 48 min. Similar curves were obtained at
the applied electric field at 5 and 7 kV/cm. The increase
of the dc current for BPACC with time at constant ap-
plied voltage can be interpreted as follows: the applica-
tion of electric field for a long time on the investigated
sample has a chance to generate different types of free
carriers or to orient the dipolar groups such as phenyl,
methyl and methylene ones of BPACC structure [1,6].
Then a competitive growth in the conduction mecha-
nisms between these carriers can be obtained. This
causes the increase of the current value of the investi-
gated sample. After 15 min from the application of the
electric field on the BPACC sample, the current exhibits
approximately constant value. At this moment the ap-
plied electric is able to orient all the dipolar groups
within the polymeric material. Figure 3 shows the tran-
sient current curves for BPACC sample at 300 K and at
different applied electric fields of 1, 3, 5 and 7 kV/cm
with the reverse polarities. It can be seen that, the dc
current exhibits a saturation region, for the dc current
value, at each value of Ep. The saturation value of the dc
current of BPACC sample is established for a long time
interval about 60 min at Ep = 7 kV/cm, The saturation
value of the transient current for BPACC sample can be
interpreted as follows: before the application of the ap-
plied electric field with the reverse polarities on the
BPACC sample, the most dipolar groups of the sample
have the same direction of the forward electric field.
When we apply the electric field with the reverse polari-
ties, the two methyl and O-CH3 groups had a maximum
potential energy. So, these polar groups have an influ-
ence on the flexibility for the movements of the lateral
groups. These intermolecular movements increase the
chaotic thermal oscillations of the side groups [12]. This
means that, the polar groups such as phenyl ones have a
high relaxation time to attain the new direction of the
electric field. This is the reason for the emergence of the
stable value of the dc current for BPACC sample.
Figures 4 and 5 depict the transient current curves of
BPACC sample for forward and reverse polarities of the
electrodes, respectively at Ep = 3 kV/cm and at different
temperatures of 300, 330 and 360 K. It is observed that,
the values of dc current decrease with the increase of
temperature. Also, the breadth of the saturation region of
the transient current decreased with the increase of the
temperature from 300 to 330 K. At 360 K the saturation
region of the dc current completely disappeared. This is
due to the thermal agitation of the polar groups which
attached to the main chain of BPACC structure. This
energy enables the dipolar groups such as methyl phenyl
and O-CH3 groups to overcome the direction of the ap-
plied electric field. In addition, the thermal energy will
increase the lateral movements of methyl, O-CH3 and
phenyl groups. So, the increase of the chaotic motion and
the steric volume phenyl groups lead to decrease the
value of the dc current [6,11].
3.2. I-V Characteristics
Figure 6 shows plots of (I-V) characteristics for BPACC
at different temperatures of 300, 330, 360 and 380 K. It is
0.5
0.7
0 1020304050607
Time (min)
A
0
1 kV/cm
3 kV/cm
5 kV/cm
7 kV/cm
Figure 3. Transient current curves for BPACC sample at different applied electric fields with reverse polarity and at 300 K.
T. A. HANAFY
102
0
0.4
0.8
1.2
1.6
0510 15 20 25 30 35 40 45 50
Time (min)
A
300 K
330 K
360 K
Figure 4. Transient current curves for BPACC sample at different temperatures and at electric field of 3 kV/cm.
0.1
0.3
0.5
0.7
0.9
0 102030405060
Time (min)
A
70
300 K
330 K
360 K
Figure 5. Transient current curves for BPACC sample at different temperatures and at electric field of 3 kV/cm with reverse
polarity.
clear that, the dc current decreases with the increase of
the temperature. At 300 K and 330 K the dc current of
the investigated sample exhibits approximately constant
value with the increase of the applied electric filed. This
can be discussed as follows: the reduction of the dc cur-
rent with the increase of the ambient temperature was
assigned to the scattering of the free carriers when it mi-
grates within the sample. In addition, the steric effect of
the phenyl groups of BPACC plays an important role in
this process. At 300 K and 330 K, the increase of the
applied electric field on the investigated sample enhances
the lateral movements inside the sample. The lateral
movements do not occur without a correlated motion of
art of the main chain or without a charge of conforma- p
Copyright © 2011 SciRes. AMPC
T. A. HANAFY
Copyright © 2011 SciRes. AMPC
103
0.01
0.1
1
10
100
1000
10000
1234567
ln (V)
nA
300 K
330 K
360 K
380 K
Figure 6. I-V characteristics for BPACC sample at different temperatures.
tion of neighboring lateral groups. These intermolecular
movements hinder reorientation and lengthen the relaxa-
tion time of the polar groups of BPCC smple [6,13]. The
methyl and methylene groups have an influence on the
flexibility of the ionic groups in the free volume of
BPACC. Then, the scattering of the charge carriers is
expected because of the repulsive force among phenyl,
aliphatic methyl, and methylene groups of the sample.
This interprets the appearance of the saturation value of
the dc current.
However, at 360 and 380 K, I-V characteristics have
two regions, one at low voltages with slope approxi-
mately 1 (i.e. IV) and the other at higher voltages with
slope approximately 2 (i.e. IV2). At the first region, the
conduction is ohmic due to the intrinsic conductivity of
the material. This indicates that the thermally activated
free carriers controlled the current of BPACC sample. So,
the current density can be estimated according to the
thermo-ionic emission function [14]:

exp 1
s
JJ eVmkT
(1)
where m is a quantity factor, k is the Boltzmann’s con-
stant, e is the charge of the electron, V is the applied
voltage, T is the absolute temperature and Js is the satu-
ration current density.
I-V characteristics of insulators at different tempera-
tures show a fairly well defined transition voltage. The
slope of logarithmic plots increases with the increase of
the applied voltage. Such behavior suggests an ohmic
manner below the threshold voltage and a SCLC trend
for higher voltage levels. According to this theory the
current flow is given by [8]:

J
enxEx
(2)
where μ is the electric mobility of the free carrier, E(x) is
the electric field and n(x) is the concentration of the free
thermally activated carriers at position (x) in conduc-
tion band (CB). The current voltage dependence at the
second region can be interpreted by SCLC theory. Such
dependence leads to conclusion that the conduction
mechanism of BPACC is due to SCLC dominated by a
discrete trapping level.
The band model is used to justify the mechanism of
charge transport through the polymeric material. For this
model the localized energy states were assumed to be
uniformly distributed in energy state within a range of
the energy gap. Moreover, the localized states are due to
the lack of order were considered as trapping level.
These localized states arise from impurities, dislocation,
crack, etc. within the BPACC sample [15,16]. Then, the
current flow in the second region obeys the equation
[10,17]:
23
9
8o
JV

d
(3)
where ε is the electric permittivity, μo is the free carrier
mobility in CB, d is the thickness of the sample, V is the
transition voltage between the ohmic and the square re-
gion and θ is the trapping parameter. The latter can be
considered to be the ratio between the density of free
electrons (no) in CB to the total density of electrons (no +
nt) where nt is the density of the trapped electrons. Ex-
perimentally, θ is the ratio the current densities at begin-
ning (J1) and the end of the rise (J2) thus [9]:
T. A. HANAFY
104

12
o
ot
n
JJ nn

(4)
The free carrier mobility (μo) could be obtained from
Equation (3) the calculated values of θ and μo are listed
in Ta ble 1. The equilibrium concentration of charge car-
riers in CB is achieved by [9]:
2
o
ned

V (5)
It was found that when the trap level exists, the elec-
tron mobility is reducing by 1/θ, and the effective elec-
tron drift mobility (μe) in insulator with trap is:
eo

(6)
The trap concentration Nt can be obtained by [9,15]:

2
2
t
NedV
TFL
(7)
where VTFL is the voltage at trap field limit. The values of
no, μe and VTFL are calculated see Table 1.
From another point of view, at 360 and 380 K, the in-
terpretation of the conduction mechanism from the ex-
perimental data may be done by using the measure of the
slope of ln(I) versus V1/2 as in Figure 7. The plot shows a
linear behavior with appreciable deviation from linearity
at lower electric field and at higher temperatures of 360
and 380 K. This is attributed to accumulation of space
charge at the electrodes [18]. These data can be fitted to
the relation [19]:
1/2
exp
J
eV kT
(8)
where β is a constant characteristic of the conduction
mechanism.
The linear behavior of ln(I) versus V1/2 plot points to a
conduction mechanism in which the charge carriers are
released by thermal activation over a potential barrier
[18,20] that is decreased by the applied electric field. The
physical nature of such a potential barrier can be inter-
preted in two ways. It can be the transition of electrons
over the barrier between the cathode and the dielectric,
Richardson-Schottky emission. Alternatively, charge carrier
can be released from the traps into BPACC, Poole-
Frenkel effect. To know the actual conduction mecha-
nism, the experimental values of β were calculated from
the slope of ln(I) versus V1/2 plot.
The theoretical value of β was deduced from the rela-
tion [21]:
12
3
2π
PF RS
o
e
 




(9)
where
o,
RS and
PF are the electric permittivity of the
free space, and the field-lowering coefficients of the
Richardson-Schottky and the Poole-Frenkel, respec-
tively.
Table 1. Some electrical parameters for BPACC sample.
Sample parameter 360 K 380 K
θ 0.65 0.24
no (cm–3) 28 × 1027 1 × 1027
μo (cm2·V–1·S–1) 2.4 × 10⁻¹⁷ 2.3 × 10⁻¹⁷
 μe (cm2·V–1·S–1) 1.55 × 10⁻¹⁷ 5.1 × 10⁻¹⁸
Nt (cm–3) 1 × 1025 1.1 × 1025
-27
-23
-19
-15
-11
0510 15 20 25 30 35
V
1/2
ln(I)
300 K
330K
360K
380K
Figure 7. ln(I) versus V1/2 for BPACC at different temperatures.
Copyright © 2011 SciRes. AMPC
T. A. HANAFY
Copyright © 2011 SciRes. AMPC
105
The experimental and theoretical values of βRS and βPF
at 360 K and 380 K are listed in Table 2. We notice that,
at 360 and 380 K, the experimental values of β consistent
with the theoretical values of βPF. Therefore, one can
suggest that the dominant conduction mechanism for
BPACC is Poole-Frenkel type at higher temperature.
3.3. Dc Conductivity
The temperature dependence of dc conductivity ln(σ)
versus 1000/T for BPACC sample is shown in Figure 8.
It is observed that, ln(σ) of the investigated sample ex-
hibits two straight regions (I and II). These two regions
correspond to lower and higher temperature within 3.5 -
3.2 K–1 and 3 - 2.8 K–1, respectively. The behavior of dc
conductivity in regions (I and II) can be described ac-
cording to Arrhenius equation [17,22]:
exp a
o
E
kT



(10)
where σo is constant, Ea is the activation energy. The val-
ues of activation energy Ea, for region I and II, are 0.3
eV and 1.5 eV, respectively. The data of Ea in region I
and II indicate that the ionic conduction mechanism is
assumed to be effective in the second region II, while the
electronic conduction one is predominant for the region I.
This means that the conductivity of BPACC sample in
region I depends mainly on the type of free carriers pre-
sent in the sample. These carriers can be obtained by
breaking weakly bonded ions inside the skeleton of
BPACC sample or the electrons injected from the elec-
trodes [11,20,23]. This agrees with what we assumed
earlier, at 300 and 330 K, the conduction mechanism
depends on the free carriers within the BPACC sample.
Figures 2-6 reveal that, at 300 and 330 K, the dc cur-
rent for BPACC sample exhibits approximately constant
value for I-t for the time interval about 60 min at Ep =
7/kV/cm. Moreover, it has a saturation value with the
change of the applied voltage on the investigated sample
from 10 to 940 V. The outcome results of this work give
a good signal for its use in the field of the electrical ap-
plications.
Table 2. Theoretical and experimental values of β coeff i cient, in eV V–1/2·m1/2, for BPACC sample.
Temperature T (K) Theoretical values of βRS Theoretical values of βPF Experimental values of β
300 9.0 × 10⁻⁶ 1.8 × 10⁻⁵ 7.5 × 10⁻⁶
330 9.0 × 10⁻⁶ 1.8 × 10⁻⁵ 7.7 × 10⁻⁶
360 1.0 × 10⁻⁵ 2.0 × 10⁻⁵ 6.7 × 10⁻⁵
380 9.5 × 10⁻⁶ 1.9 × 10⁻⁵ 5.1 × 10⁻⁵
II I
-26
-24
-22
-20
-18
2.7 2.8 2.933.1 3.2 3.3 3.4 3.5
1000/T (K
-1
)
Ln (

cm
-1
)
Figure 8. Temperature de pe ndence of dc conductivity lnσ for BPACC sample.
T. A. HANAFY
106
4. Conclusions
Transient current, I-V characteristics, and dc conductiv-
ity for BPACC sample were analyzed. Electrical meas-
urements of the investigated sample show that, the dc
current has a peculiar behavior for I-t and I-V character-
istics. Transient current of BPACC sample exhibits ap-
proximately constant value at constant electric field.
Also, dc current of the investigated sample for I-V char-
acteristics has a saturation value at lower temperatures.
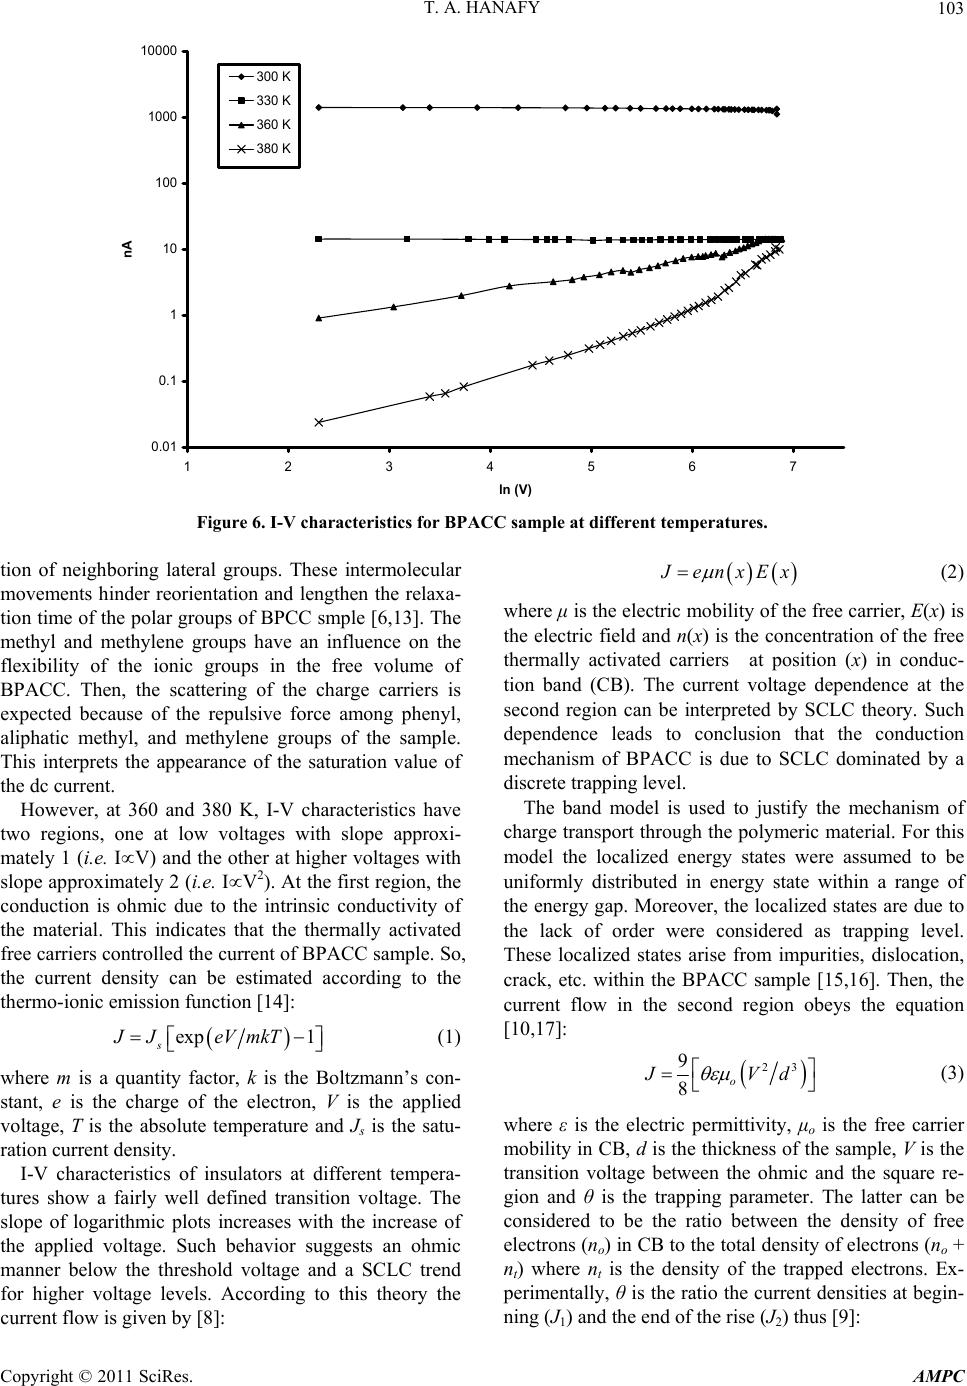
At higher temperatures, I-V regime reveals that the cur-
rent of the sample exhibits two regions one due to ohmic
conduction and the other is attributed to SCLC. The ionic
conduction mechanism was assumed to be the main
conduction mechanism at higher temperatures. The elec-
tronic conduction has been established at lower tem-
peratures. The value of the dc current for I-t and I-V
characteristics has a good stability with passage of time
and the change of the applied voltage, respectively.
5. References
[1] R. I. Cristina, M. T. R. Matthew, S. Ashley and A. Sil-
vana, “Multifunctional Biomagnetic Capsules for Easy
Removal of Phenol and Bisphenol A,” Water Research,
Vol. 44, No. 6, 2010, pp. 1961-1969.
[2] A. Ballesteros-Gَmez, S. Rubio and D. Pérez-Bendito,
“Analytical Methods for the Determination of Bisphenol
A in Food,” Journal of Chromatography A, Vol. 1216,
No. 3, 2009, pp. 449-469.
doi:10.1016/j.chroma.2008.06.037
[3] J.-H. Kang, F. Kondo and Y. Katayama, “Human Expo-
sure to Bisphenol A,” Toxicology, Vol. 226, No. 2-3,
2006, pp. 79-89. doi:10.1016/j.tox.2006.06.009
[4] H. H. Le, E. M. J. P. Chua and S. M. Belcher, “Bisphenol
A Is Released from Polycarbonate Drinking Bottles and
Mimics the Neurotoxic Actions of Estrogen in Develop-
ing Cerebellar Neurons,” Toxicology Letters, Vol. 176,
No. 2, 2008, pp. 149-156.
doi:10.1016/j.toxlet.2007.11.001
[5] I. A. Sabbah, F. A. Khalifa, N. E. Metwally and S. M.
Sayyah, “Prepration and Characterization of Moulded
shaps from Egyptain Corncobs-Bisphenol Polyconden-
sate Resins,” Egyptian Journal of Chemistry, Vol. 35,
1992, pp. 651-660.
[6] M. A. Ahmed and T. A. Hanafy, “Dielectric Relaxation
and Poole-Frenkel Conduction in Poly(Vinyl Chloride)
Blends with Bisphenol A/Egyptian Corncob Resin,”
Journal of Applied Polymer Science, Vol. 109, No. 1,
2008, pp. 182-189. doi:10.1002/app.28075
[7] M. A. Ahmed and T. A. Hanafy, “Optical Absorption and
Electrical Properties of Polyvinyl Alchol (PVA)-Gelatin
Blend,” Indian Journal of Physics, Vol. 79, No. 10, 2005,
pp. 1149-1155.
[8] R. K. Singh, Y. K. Sharma and A. K. Upadhaya, “ Cur-
rent in an Insulator with Specially Distributed Shallow
traps,” Indian Journal of Pure and Applied Physics, Vol.
23, 1985, pp. 529-530.
[9] S. M. El-Sayed, H. M. Abdel Hamid and R. M. Radwan,
“Effect of Electron Beam Irradiation on the Conduction
Phenomena of Unplasticized PVC/PVA Copolymer,”
Radiation Physics and Chemistry, Vol. 69, No. 4, 2004,
pp. 339-345. doi:10.1016/j.radphyschem.2003.07.001
[10] A. Sawaby, A. A. shabaka and M. G. Khafagi, “The Ef-
fect of Light on the Electrical Conduction pf Pure and
Doped Poly(Methyl Methacrylate),” Polymer Degrada-
tion and Stability, Vol. 30, No. 3, 1990, pp. 319-328.
doi:10.1016/0141-3910(90)90085-L
[11] S. Mahrous and T. A. Hanafy, “Poole-Frenkle Conduc-
tion Mechanism in Polyvinyl Chloride Stabilized with
Dibutylin Laurate-Maleate,” Current Applied Physics,
Vol. 4, No. 5, 2004, pp. 461-464.
doi:10.1016/j.cap.2004.02.003
[12] T. A. Hanafy, “Dielectric Properties of Bisphenol A Egyp-
tain Corncobs Irradiated by Nd: YAG Laser of Science,”
Proceedings of the 5th International Science Conference of
Al-Azher University, Cairo, 25-27 March 2003, pp. 323-345.
[13] S. Mahrous, “Transient Current and Dielectric Relaxation
in PVC Stabilized with DI-N-Octyltin-Mercaptopropion-
ate,” International Journal of Polymeric Materials, Vol.
54, 2005, pp. 1-9.
[14] T. G. Abdel-Malik, “Direct Current Conductivity and
Thermal Stimulated Current of Nickel Phathaocyanine
Films Using Gold and Aluminum Electrode,” Interna-
tional Journal of Electronics, Vol. 72, No. 3, 1992, pp.
409-418. doi:10.1080/00207219208925582
[15] Y. H. A. Fawzy and R. M. Radwan, “conduction Mecha-
nism in Electron Beam-Irradiated Unplasticized PVC/ PVA
Copolymer Films under High Electric Field,” Physica B:
Condensed Matter, Vol. 395, No. 1-2, 2007, pp. 79-83.
doi:10.1016/j.physb.2007.02.059
[16] A. J. Campbell, D. D. C. Bradley and D. G. Lidzey,
“Charge Trapping in Polymer Diodes,” Optical Materials,
Vol. 9, No. 1-4, 1998, pp. 114-119.
doi:10.1016/S0925-3467(97)00145-6
[17] F. H. Abd El-kader, W. H. Osaman, K. H. Mahmoud and
M. A. F. Basha, “Dielectric Investigation and ac Conduc-
tivity of Polyvinyl Alcohol Films Doped with Europium
and Terbium Chloride,” Physica B: Condensed Matter,
Vol. 403, No. 19-20, 2008, pp. 3473-3484.
doi:10.1016/j.physb.2008.05.009
[18] V. V. R. Narasimha, T. Mahender and B. Subba Rao,
“Electrical Conduction in Solution Grown Polyacrylic
Acid Polymer Films,” Journal of Non-Crystalline Solids,
Vol. 104, No. 2-3, 1988, pp. 224-228.
doi:10.1016/0022-3093(88)90392-4
[19] J. R. Yeargan and H. L. Taylor, “The Poole-Frenkel Ef-
fect with Compensation Present,” Journal of Applied
Physics, Vol. 39, No. 12, 1968, pp. 5600-5604.
doi:10.1063/1.1656022
[20] S. Mahrous, “Study of Cooperative Motions in Poly-
isoxazoline by Thermally Stimulated Currents,” Physica
Status Solidi, Vol. 199, No. 2, 2003, pp. 360-365.
Copyright © 2011 SciRes. AMPC
T. A. HANAFY107
[21] S. Sze, “Physics of Semiconductor Devices,” Wiley, New
York, 1983.
[22] T. A. Hanafy, “Drastic Effects of Fast Neutrons and
C-Irradiation on the DC Conductivity of Co-, Ni-, Mn-
and Ag-Gelatin Doped Films,” Current Applied Physics,
Vol. 8, No. 5, 2008, pp. 527-534.
doi:10.1016/j.cap.2007.09.002
[23] F. H. Abd El-kader, S. A. Gaafer, K. H. Mahmoud, S. I.
Mohamed and M. F. H. Abd El-Kader, “Transient and
Steady State Currents of γ-Irradiated 70/30 (wt/wt%)
Polyvinyl Alcohol/Glycogen Blend Samples Undoped
and Doped with Eosin,” Solid State Ionics, Vol. 179, No.
38, 2008, pp. 2124-2131. doi:10.1016/j.ssi.2008.07.012
Copyright © 2011 SciRes. AMPC