 Advances in Materials Physics and Chemistry, 2011, 1, 57-63 doi:10.4236/ampc.2011.13010 Published Online December 2011 (http://www.SciRP.org/journal/ampc) Copyright © 2011 SciRes. AMPC Intense Visible Photoluminescence from C46H22N8O4KM (M = Co, Fe, Pb) Derivatives Thin Films María Elena Sánchez1, Juan Carlos Alonso2, Jerry Nathan Reider1 1Faculty of Engineering, Anáhuac México Norte University, Huixquilucan, Estado de México, México 2Materials Research Institute, National Autonomous University of México (UNAM), Coyoacán, México E-mail: elena.sanchez@anahuac.mx Received August 3, 2011; revised September 27, 2011; accepted October 7, 2011 Abstract Strong visible photoluminescence (PL) at room temperature is obtained from thermal-evaporated thin solid films of Metallophthalocyanine (M = Co, Fe, Pb) and double potassium salt from 1,8-dihydroxyan- thraquinone. The PL of all the investigated samples is observed with the naked eye in a bright background. The deconvolution of the normalized PL spectra shows that each PL spectrum is composed of four emission bands which peak at approximately the same energies of 2.1, 2.2 and 2.4 eV and whose intensities and widths depend upon the structure of the complexes. FTIR and ellipsometry are employed to investigate the structural differences among the films. The optical absorption of the films is also investigated to evaluate the changes in the electronic structure of these metal organic compounds, with respect to other metalphtalocya- nines thin films. Our results suggest that the visible PL comes from radiative transitions between energy lev- els associated to the double potassium salt coordination to the metallic ion in the phthalocyanine. Keywords: Thin Films, Optical Properties, Photoluminescence 1. Introduction Since the report, more than two decades ago, of efficient electroluminescence (EL) from organic thin films [1], the use of small organic molecules and organic polymers in the fabrication of organic light emitting diodes (OLED’s) attracts considerable interest for solid state displays and lighting applications [2]. A typical OLED comprises a luminescent organic thin film sandwiched in-between an electron transport layer and a hole transport layer bound by two electrodes. One of the foremost class of planar organic molecular semiconductors, used as electron or hole transport layer, is that of the metallophthalocyanines (MPcs). Optical properties of these materials, among them the luminescence, are strongly related to the va- lence band electronic configuration, as well as the exci- tation and the de-excitation processes between highest occupied molecular orbitals (HOMO) and lowest unoc- cupied molecular orbitals (LUMO) [3]. The optical pro- perties of MPcs are very important for understanding their molecular structure and improving the performance of devices made with phthalocyanines. In thin films, MPcs usually present a given crystalline form or may be amorphous depending mainly upon the molecular self-stacking ability of the derivate, but also upon the thin film fabrication procedure [4]. Moreover, the control of film structure is of great importance in thin film technology since the opto-electronic properties such as the photogeneration of charge carriers, highly depends on the degree of molecular organization [4]. In thin films, molecules crystallize and their interaction is significant, so that dramatic changes occur in their optical properties, making them much more complicated [5]. Since these organic materials in the solid film form are applied in the production of the majority of modern optoelectronic de- vices, the knowledge of their excited electronic states and relaxation processes is particularly important [5]. Photoluminescence (PL) properties in the solid (or crys- talline) phases have been investigated for only a few MPcs materials such as H2Pc, ZnPc, AlClPc, VOPc, TiOPc, MgPc and AlBrPc [6]. PL is a powerful probe for assessing the excited states, because useful information can be obtained by measuring its properties such as quantum yields, spectra, time decay, and temperature dependence [6]. For the electroluminescence (EL) appli- cation, PL properties provide important reference data, because the EL spectra and the EL emission efficiencies of the materials can be estimated through the corre-  M. E. SÁNCHEZ ET AL. 58 sponding PL spectra and the quantum yields. Therefore, it is important to investigate PL phenomena of MPc compounds in the solid phases, whereas the lumines- cence of most of these organic compounds lies in the red and near-infrared regions and with low efficiency at room temperature [7-9]. Studies on the optical properties of phthalocyanine-derived thin films show that the opti- cal absorption and luminescence of these new organic compounds with complex structures can be tailored and/or modified to decrease or increase the near-IR lu- minescence efficiency [10-13], and even produce polar- ized red luminescence [14] or strong blue photolumines- cence [15]. In this paper, we report intense photolumi- nescence from MPcs-derived thin films prepared by vacuum thermal evaporation of semiconductor powders from iron, lead and cobalt phhalocyanines with a double potassium salt derived from 1,8-dihydroxyanthraquinone (K2C14H6O4). Vibrational spectra are obtained and the refractive indices and absorption coefficients are deter- mined for the studied samples. 2. Experimental Details The raw materials used in this work are obtained from commercial sources with no purification prior to their use. The powders of the three compounds; C46H22N8O4KFe, C46H22N8O4KPb and C46H22N8O4KCo, are synthesized from metallic phthalocyanines and double potassium salt derived from 1,8-dihydroxianthraquinone, using the pro- cedure reported previously [16]. Thin film deposition of these compounds is carried out by vacuum thermal evapo- ration onto Corning 7059 glass slices and (100) single- crystalline silicon (c-Si), 200 Ω·cm wafers. The sub- strate temperatures are kept at 298 K during deposition. The Corning 7059 substrates are ultrasonically degreased in warm ethanol and dried in a nitrogen atmosphere. The silicon substrates are chemically etched with a p-etch solution (10 ml HF, 15 ml HNO3, and 300 ml H2O) in order to remove the native oxide from the c-Si surface. The evaporation source is a molybdenum boat with two grids. The temperature through the molybdenum boat is slowly increased to 453 K, below the first significant signal change observed in the thermo-gravimetric analysis thermogram, in order to prevent thermal decomposition of the compound and to identify the phase changes (evaporation, sublimation). All samples are obtained using the same deposition system, with the crucible and substrates arranged in the same geometry. The base pressure in the deposition chamber before thin film deposition and the amount of mass inside the crucible are the same in all cases. In spite of these similarities, sig- nificant differences in the thickness of deposited films are detected, which may be related to differences in the sublimation processes for the compounds used. An atomic force microscope (AFM) coupled to a potentio- stat/galvanostat module from Digital Instruments is also used to investigate the morphology of the thin films. A Gaertner L117 Ellipsometer equipped with a He-Ne laser (λ = 632.8 nm) is used to measure the thickness and re- fractive index of the films. The thickness of the films is also measured by means of a Sloan Dektak IIA pro- filometer. The chemical bonding behavior is analysed by means of a Fourier transform infrared (FTIR) spectro- photometer (Nicolet-210). Photoluminescence (PL) meas- urements are carried out in a dark room at room tem- perature, using a beam ( = 325 nm, 25 mW) from a Kimmon He-Cd laser as excitation source, with an inci- dent angle of 45˚ relative to the normal of the sample. The luminescence is collected at an angle normal to the sample using a quartz optic fiber and measured in the range from 350 nm to 800 nm with a Fluoromax-Spex spectrofluorometer. Ultraviolet-visible (UV-Vis) trans- mission measurements are carried out in the range from 300 to 1100 nm using a double-beam PerkinElmer Lambda 35 UV-Vis spectrophotometer. For PL, infrared and el- lipsometric measurements the substrates used are (100) oriented c-Si slices with 200 ·cm resistivity. For AFM and optical transmission measurements, the substrates are naked 7059 Corning glass slices. The electric con- ductivity at 298 K of the films is studied by means of a four-point probe; for these measurements, the sub- strates are Corning 7059 glass slices coated with four metallic strips acting as electrodes. The strips are depos- ited by thermal evaporation. In order to get an ohmic contact with the deposited films, the electrodes are made from silver. 3. Results and Discussion The purpose of IR spectroscopy on thin films is deter- mining if there were significant chemical changes on the MPcs-derived compounds during the thermal evapora- tion used to prepare the films. However, chemical charges or reactions are not expected to occur owing to the thermal stability present in these compounds. Table 1 shows the characteristic bands for these compounds on thin film. These results appear to indicate that the depos- ited compound is not affected by the thermal evaporation and deposition processes during film growth. The depos- ited films are formed by the same macro-ions as those of the original synthesized powder, as indicated by com- parison between the location of the absorption bands in the spectra of the synthesized powders, and those of the deposited films [16]. When compounds have the film form, the signs show slight changes in their location be- cause, in all thin films deposited by any method, there Copyright © 2011 SciRes. AMPC  M. E. SÁNCHEZ ET AL. Copyright © 2011 SciRes. AMPC 59 Table 1. Characteristic FT-IR bands for powders and thin films (cm–1). COMPOUND (C-H) (cm–1) (C-C) (cm–1) (C-N) (cm–1) (C=O) (cm–1) (C-O) (cm–1) C46H22N8O4KFe Thin Film 3049, 2851 1610, 630 1284, 1157, 1070 1606 1089 C46H22N8O4KFe KBr pellet 3048, 2855 1607, 632 1285, 1158, 1070 1604 1091 C46H22N8O4KPb Thin Film 3048, 2851 1603, 623 1277, 1156, 1077 1602 1087 C46H22N8O4KPb KBr pellet 3050, 2853 1608, 626 1274, 1159, 1079 1602 1088 C46H22N8O4KCo Thin Film 3045, 2852 1605, 625 1287, 1161, 1071 1609 1085 C46H22N8O4KCo KBr pellet 3044, 2849 1608, 628 1284, 1164, 1070 1610 1083 are inner stresses that affect the angles and energies of intramolecular bonds. Table 1 shows the signs corre- sponding to macrocycle [17,18]: two bands appearing at about 3048 and 2854 cm–1 are assigned as CH (symmet- ric stretching vibrations in the ring and asymmetric stretching vibrations as alkyl). The band appearing at 1609 cm–1 is assigned to the C-C stretching vibration in pyrrole. Additionally, the band appearing at 625 cm–1 is assigned the C-C macrocycle ring deformation. The bands appearing at 1284, 1161 and 1070 are assigned to the C-N in isoindole in plane band in pyrrole stretching vi- bration, respectively. The spectral pattern in this region depends strongly upon the molecular structure of the complexes and its chemical structure for the central metal with D4h molecular symmetry [18]. It may be noticed [16] that the materials from the MPc and double potas- sium salt derived from 1,8-dihydroxyanthraquinone ex- hibit C=O and C-O functional groups with wavelengths 1600 cm–1 and 1080 cm–1, respectively [16-19]. Due to the bond of phtalocyanine to the potassium double salt anion (C14H6O4)2–, a characteristic band around 1662 cm–1 assigned to the elongation vibration of carbonile group C=O in the quinones is observed. In addition, the band near 1083 cm–1 corresponding to the C-O elonga- tion vibration is present, as well [16-19]. In order to obtain information about the quality of the films we investigate the surface morphology by AFM. The AFM analysis of the evaporated films displays a homogeneous distribution of small spherical aggregates. The RMS roughness values are shown in Table 2. The refractive indices (n) of the films, obtained from ellip- sometric measurements are shown in Table 2, as well as the reflectance percentages at normal incidence, calcu- lated using the equation: 2 100 11Rnn 2 fraction indexes. It is noticed that at thin thicknesses all the photoluminescence (PL) spec- tra (1) The refraction index, as well as the reflectance, de- pend upon the thickness of the thin film: the lead-based film is the one which shows the least thickness, associ- ated with higher values for both the reflectance and re- films become transparent and no light is scattered or ab- sorbed. The electrical conductivity of each material is evaluated at 25˚C. These results are shown in Table 2 with the C46H22N8O4KCo material presenting the highest conductivity. Generally, the conductivity at room tem- perature decreases when increasing the atomic number of the central metal except Fe. This may be due to the change of chemical structure of Fe and it takes place for Fe2+ and Fe3+ [18]. Besides, electrical conductivity val- ues at room temperature for all materials are in the elec- trical conductivity range for semiconducting molecular materials (10–6 to 101 S·cm–1) [16]. This is important since a molecular semiconductor is generally defined in terms of its conductivity at room temperature and its be- havior with temperature. Conductivity is also related to impurity types, location and concentration, structure, stacking and overlaps between orbitals. The charge transfer in these compounds, occurs via phthalocyanine rings that stacks, generating a direct - interaction be- tween adjacent molecules in the pile, but very weak in- teractions between molecules in adjacent piles. The elec- tric charges transport on them is due to the highly or- dered structure that form; apparently there is a marked anisotropy as a consequence of the stacking of phthalo- cyanine columns in columnar piles, along which the electric charges flow. Figure 1(a) shows of the films, obtained at room temperature (300 K). It is evident from Figure 1(a) that these films exhibit lu- minescence in the visible region. These results are im- portant since most of the reports and studies on the lu- minescence of this type of metal organic compounds are made in the IR region. The PL spectra of the three sam- ples show two main central peaks and two side shoulders located at similar wavelengths but with different intensi- ties. The absorbance (A) spectra of the films (Figure 1(b)) show more complicated structure with optical ab- sorption peaks and edges distributed in the wavelength range from infrared to ultraviolet. It is well known that the absorption spectrum for phthalocyanines originates from molecular orbitals within the aromatic 18π electron system  M. E. SÁNCHEZ ET AL. 60 kness, refraction index, reflectance and electrical conductivity rical parameters C46H22N8O4KFe C46H22N8O4KPb C46H22N8O4KCo Table 2. AFM evaluation of the thin film roughness, film thic results for thin films. Optical and Elect RMS roughness (nm) 84.79 74.37 89.54 Film thickness (nm) 133 108 170 Refraction index 2.6 2.9 2.1 % Reflectance 19 24 12 Electrical conductivity(S/cm) 1.57E 1.36E–5 4.96E at 298 K –5–5 nd from overlapping orbitals on the central metal atom te the origin of the visible photo- lu on band in the UV re in the visible region have been generally been interpreted a [17]. The compounds C46H22N8O4KPb and C46H22N8O4KFe exhibit a similar behavior in the visible region in compari- son with C46H22N8O4KCo. This, in turn, can be explained by the different electronic configuration of the central me- tallic ion and the number of electrons in the outer level: 3d6 for C46H22N8O4KFe, 6S2 for C46H22N8O4KPb and 3d7 for C46H22N8O4KCo [18]. In order to investiga minescence and the relationship with the optical ab- sorption and electronic structure of these thin films, the PL and absorbance spectra of Figure 1 were plotted to- gether in an overlapping scheme in terms of photon en- ergy. These plots are presented in Figure 2. Since the analyzed samples have different thicknesses (see Table 2) and the PL intensity depends upon this parameter, the PL spectra of Figure 2 are normalized relative to the maxi- mum intensity in order to neglect this dependence. As can be seen from these plots, there is strong absorbance for the three samples at the energy of the excitation source photons (marked with an arrow). This means that the photons from the excitation source are efficiently absorbed by the samples, which partly explains their ef- ficient PL. It is interesting to note that the start and end energies (also marked with arrows in the spectra) of the main photoluminescence band correspond to energies where optical absorption bands or edges lie. These ener- gies are similar for the three samples. A close examination of the absorpti gion, which is known as the Soret band or the B-band (3 - 4.5 eV) [20], reveals one peak around 3.8 eV for C46H22N8O4KFe, C46H22N8O4KPb and C46H22N8O4KCo (see Figure 2 and Table 3). This strongly indicates the presence of a d-band associated with the central metal atom. This is because PcM(L) has partially occupied d bands. The absorption band near 4.0 eV may be due to π-d transition. The other well-know band of the phthalo- cyanine molecule, namely Q-band, appears in the region between 1.4 and 2.6 eV. The Q-band is split into two distinct peaks in the visible region due to molecule ag- gregation or molecular distortion [20]. As observed from Figure 2, the distinct characterized peaks for thin films in terms of π-π* excitation between bounding and anti- bounding molecular orbitals [20]. The Q-band consists of a high-energy peak around 2.6 eV and a low energy shoulder at 1.6 eV. The high-energy peak of the Q band is assigned to the first π-π* transition on the phthalocya- nine macrocycle. The low-energy peak of the Q band is explained either, as a second π-π* transition, as an exci- (a) (b) Figure 1. (a) Photoluminesced (b) absorbance spectra of C46H22N8O4KCo, C46H22N8 4KPb, C46H22N8O4KFe, thin films. nce an O Copyright © 2011 SciRes. AMPC 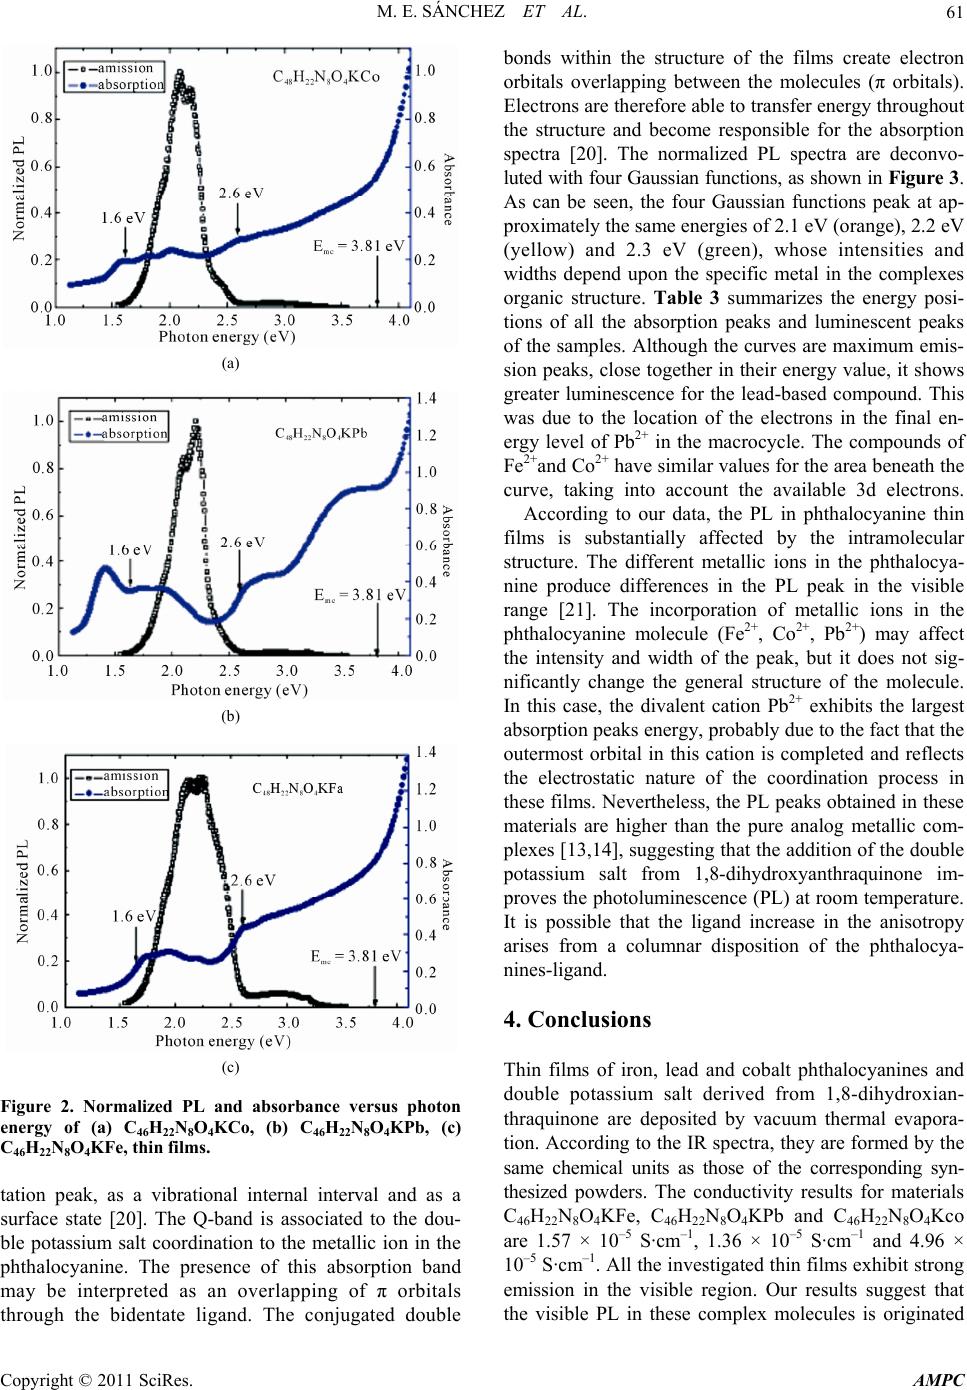 M. E. SÁNCHEZ ET AL.61 (a) (b) (c) Figure 2. Normalized PL and absorbance versus photon energy of (a) C46H22N8O4KCo, (b) C46H22N8O4KPb, (c) CHN O KFe, thin films. and is associated to the dou- ni Thin films of iron, lead and cobalt phthalocyanines and salt derived from 1,8-dihydroxian- thraquinone are deposited by vacuum thermal evapora- 46 228 4 tation peak, as a vibrational internal interval and as a urface state [20]. The Q-bs ble potassium salt coordination to the metallic ion in the phthalocyanine. The presence of this absorption band may be interpreted as an overlapping of π orbitals through the bidentate ligand. The conjugated double bonds within the structure of the films create electron orbitals overlapping between the molecules (π orbitals). Electrons are therefore able to transfer energy throughout the structure and become responsible for the absorption spectra [20]. The normalized PL spectra are deconvo- luted with four Gaussian functions, as shown in Figure 3. As can be seen, the four Gaussian functions peak at ap- proximately the same energies of 2.1 eV (orange), 2.2 eV (yellow) and 2.3 eV (green), whose intensities and widths depend upon the specific metal in the complexes organic structure. Table 3 summarizes the energy posi- tions of all the absorption peaks and luminescent peaks of the samples. Although the curves are maximum emis- sion peaks, close together in their energy value, it shows greater luminescence for the lead-based compound. This was due to the location of the electrons in the final en- ergy level of Pb2+ in the macrocycle. The compounds of Fe2+and Co2+ have similar values for the area beneath the curve, taking into account the available 3d electrons. According to our data, the PL in phthalocyanine thin films is substantially affected by the intramolecular structure. The different metallic ions in the phthalocya- ne produce differences in the PL peak in the visible range [21]. The incorporation of metallic ions in the phthalocyanine molecule (Fe2+, Co2+, Pb2+) may affect the intensity and width of the peak, but it does not sig- nificantly change the general structure of the molecule. In this case, the divalent cation Pb2+ exhibits the largest absorption peaks energy, probably due to the fact that the outermost orbital in this cation is completed and reflects the electrostatic nature of the coordination process in these films. Nevertheless, the PL peaks obtained in these materials are higher than the pure analog metallic com- plexes [13,14], suggesting that the addition of the double potassium salt from 1,8-dihydroxyanthraquinone im- proves the photoluminescence (PL) at room temperature. It is possible that the ligand increase in the anisotropy arises from a columnar disposition of the phthalocya- nines-ligand. 4. Conclusions double potassium tion. According to the IR spectra, they are formed by the same chemical units as those of the corresponding syn- thesized powders. The conductivity results for materials C46H22N8O4KFe, C46H22N8O4KPb and C46H22N8O4Kco are 1.57 × 10⁻⁵ S·cm–1, 1.36 × 10⁻⁵ S·cm–1 and 4.96 × 10⁻⁵ S·cm–1. All the investigated thin films exhibit strong emission in the visible region. Our results suggest that the visible PL in these complex molecules is originated Copyright © 2011 SciRes. AMPC 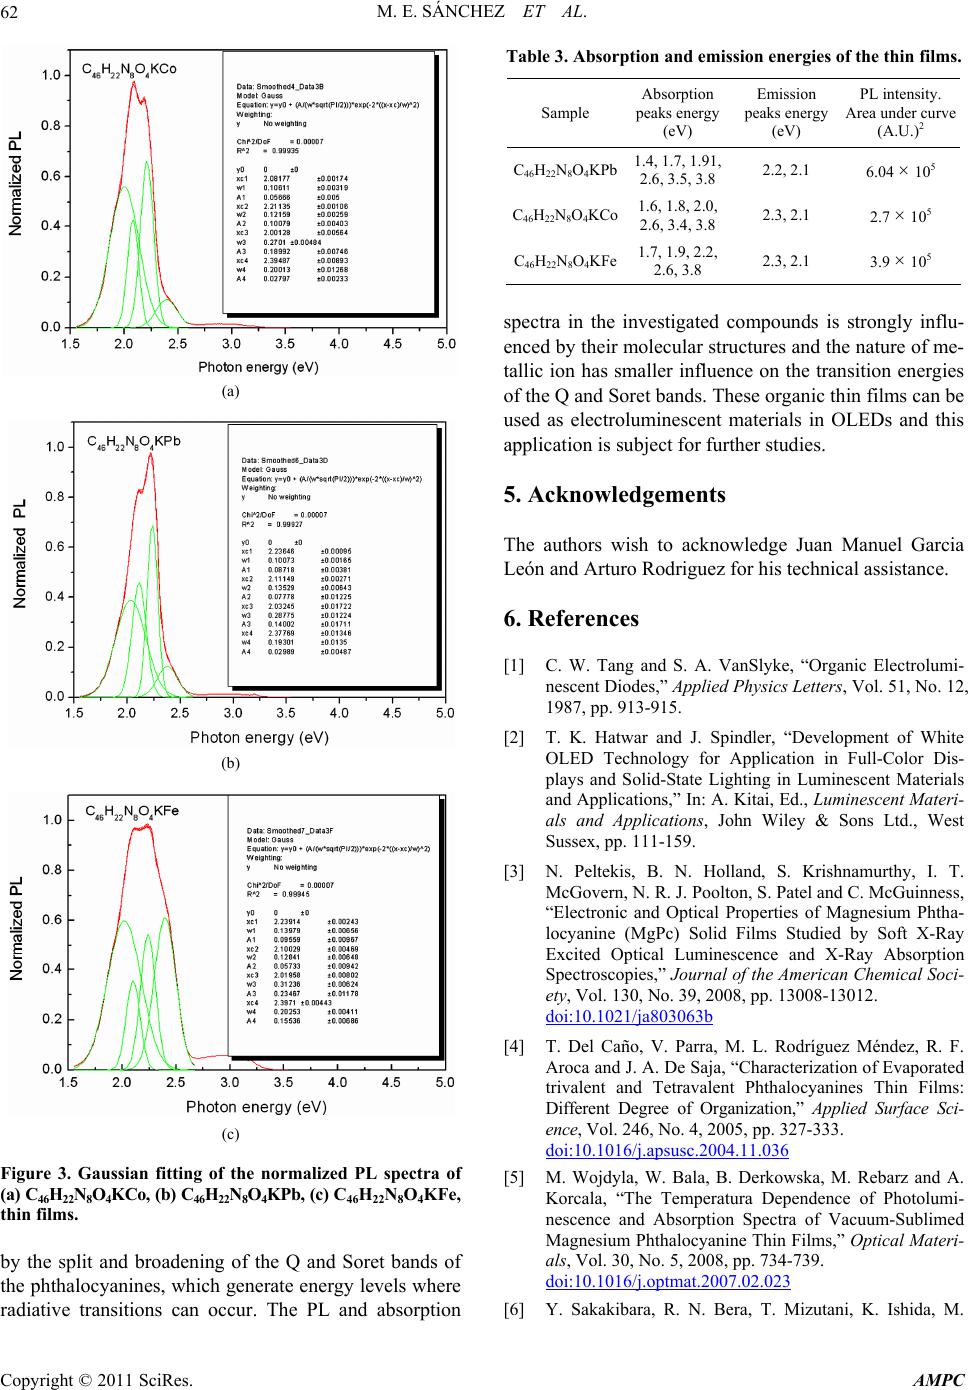 M. E. SÁNCHEZ ET AL. 62 (a) (b) (c) Figure 3. Gaussian fitting of the normalized PL spectra o (a) C46H22N8O4KCo, (b) C46H O4KPb, (c) C 46H22N8O4KFe thin films. cyanines, which generate energy levels where diative transitions can occur. The PL and absorption f , 22N8 by the split and broadening of the Q and Soret bands of the phthalo ra Table 3. Absorption and emission energies of the thin films. Sample Absorption peaks energy Emission peaks energy PL intensity. Area under curve (eV) (eV) (A.U.)2 C46H NOKPb 1 22 84.4, 1.7, 1.91, 2.6, 3.5, 3.8 2.2, 2.1 6.04 × 10⁵ C46H22N8O4KCo 1.6,.0, 2. 2. 5 C46H22N8O4KFe 2.3, 2.1 3.9 × 10 1.8, 2 2.6, 3.4, 3.8 1.7, 1.9, 2.2, 3, 2.1 7 × 10 2.6, 3.8 5 spect t inoms stroflu- enced by oures ahe ne- llic ion has smaller influence on the transition energies The authors wish to acknowledge Juan Manuel Garcia or his technical assistance. [1] C. W. Tang and S. A. VanSlyke, “Organic Electrolumi- ,” Applied Physics Letters, Vol. 51, No. 12, 15. Lighting in Luminescent Materials al Properties of Magnesium Phtha- ra inhe their m vestigated c lecular struct pounds i nd t ngly in ature of m ta of the Q and Soret bands. These organic thin films can be used as electroluminescent materials in OLEDs and this application is subject for further studies. 5. Acknowledgements León and Arturo Rodriguez f 6. References nescent Diodes 1987, pp. 913-9 [2] T. K. Hatwar and J. Spindler, “Development of White OLED Technology for Application in Full-Color Dis- plays and Solid-State and Applications,” In: A. Kitai, Ed., Luminescent Materi- als and Applications, John Wiley & Sons Ltd., West Sussex, pp. 111-159. [3] N. Peltekis, B. N. Holland, S. Krishnamurthy, I. T. McGovern, N. R. J. Poolton, S. Patel and C. McGuinness, “Electronic and Optic locyanine (MgPc) Solid Films Studied by Soft X-Ray Excited Optical Luminescence and X-Ray Absorption Spectroscopies,” Journal of the American Chemical Soci- ety, Vol. 130, No. 39, 2008, pp. 13008-13012. doi:10.1021/ja803063b [4] T. Del Caño, V. Parra, M. L. Rodríguez Méndez, R. F. Aroca and J. A. De Saja, “Characterization of Ev trivalent and Tetravalen aporated t Phthalocyanines Thin Films: Different Degree of Organization,” Applied Surface Sci- ence, Vol. 246, No. 4, 2005, pp. 327-333. doi:10.1016/j.apsusc.2004.11.036 [5] M. Wojdyla, W. Bala, B. Derkowska, M. Rebarz and A. Korcala, “The Temperatura Dependence nescence and Absorption Spectra of Vacuum-Sublimed of Photolumi- Magnesium Phthalocyanine Thin Films,” Optical Materi- als, Vol. 30, No. 5, 2008, pp. 734-739. doi:10.1016/j.optmat.2007.02.023 [6] Y. Sakakibara, R. N. Bera, T. Mizutani, K. Ishida, M. Copyright © 2011 SciRes. AMPC 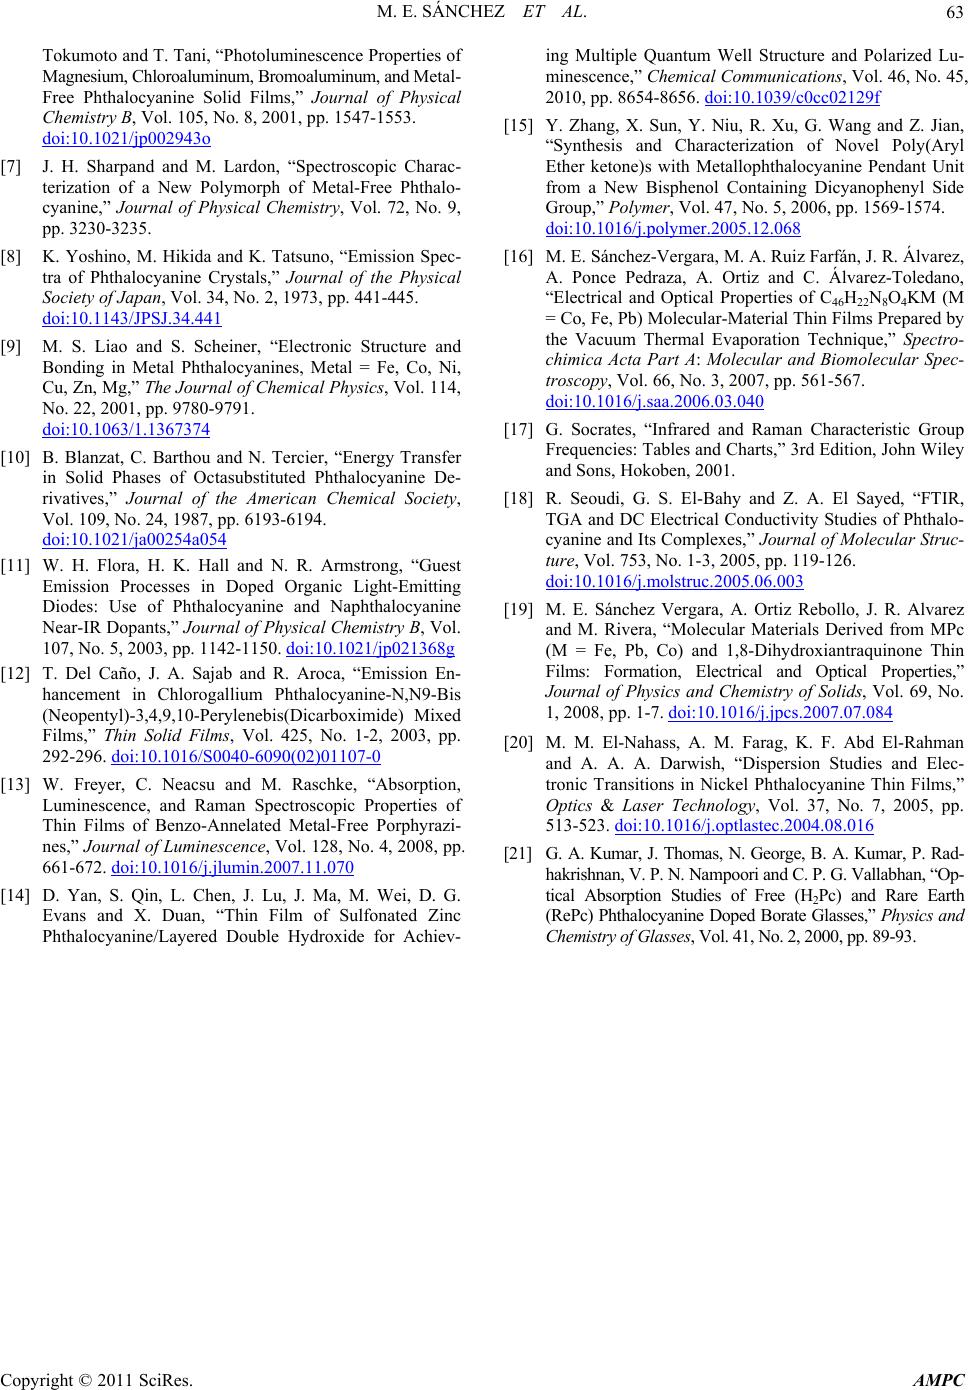 M. E. SÁNCHEZ ET AL. Copyright © 2011 SciRes. AMPC 63 ence Properties of oaluminum, and Metal- Tokumoto and T. Tani, “Photoluminesc Magnesium, Chloroaluminum, Brom Free Phthalocyanine Solid Films,” Journal of Physical Chemistry B, Vol. 105, No. 8, 2001, pp. 1547-1553. doi:10.1021/jp002943o [7] J. H. Sharpand and M. Lardon, “Spectroscopic Charac- terization of a New Polymorph of Metal-Free Phth cyanine,” Journal of Phy alo- sical Chemistry, Vol. 72, No. 9, , Vol. 34, No. 2, 1973, pp. 441-445. pp. 3230-3235. [8] K. Yoshino, M. Hikida and K. Tatsuno, “Emission Spec- tra of Phthalocyanine Crystals,” Journal of the Physical Society of Japan doi:10.1143/JPSJ.34.441 [9] M. S. Liao and S. Scheiner, “Electronic Structure and Bonding in Metal Phthalocyanines, Metal = Fe, Co Cu, Zn, Mg,” The Journal , Ni, of Chemical Physics, Vol. 114, No. 22, 2001, pp. 9780-9791. doi:10.1063/1.1367374 [10] B. Blanzat, C. Barthou and N. Tercier, “Energy Transfer in Solid Phases of Octasubst rivatives,” Journal of t ituted Phthalocyanine De- he American Chemical Society, Vol. 109, No. 24, 1987, pp. 6193-6194. doi:10.1021/ja00254a054 [11] W. H. Flora, H. K. Hall and N. R. Armstrong, “Guest Emission Processes in Doped Organic Ligh Diodes: Use of Phthaloc t-Emitting yanine and Naphthalocyanine Near-IR Dopants,” Journal of Physical Chemistry B, Vol. 107, No. 5, 2003, pp. 1142-1150. doi:10.1021/jp021368g [12] T. Del Caño, J. A. Sajab and R. Aroca, “Emission En- hancement in Chlorogallium Phthalocyanine-N,N9-Bis (Neopentyl)-3,4,9,10-Perylenebis(Dicarboximide) Mixed Films,” Thin Solid Films, Vol. 425, No. 1-2, 2003, pp. 292-296. doi:10.1016/S0040-6090(02)01107-0 [13] W. Freyer, C. Neacsu and M. Raschke, “Absorption, Luminescence, and Raman Spectroscopic Properties of Thin Films of Benzo-Annelated Metal-Free Porphyrazi- nes,” Journal of Luminescence, Vol. 128, No. 4, 2008, pp. 661-672. doi:10.1016/j.jlumin.2007.11.070 [14] D. Yan, S. Qin, L. Chen, J. Lu, J. Ma, M. Wei, D. G. Evans and X. Duan, “Thin Film of Sulfonated Zinc Phthalocyanine/Layered Double Hydroxide for Achiev- ing Multiple Quantum Well Structure and Polarized Lu- minescence,” Chemical Communications, Vol. 46, No. 45, 2010, pp. 8654-8656. doi:10.1039/c0cc02129f [15] Y. Zhang, X. Sun, Y. Niu, R. Xu, G. Wang and Z. Jian, “Synthesis and Characterization of Novel Poly(Aryl Ether ketone)s with Metallophthalocyanine Pendant Unit from a New Bisphenol Containing Dicyanophenyl Side Group,” Polymer, Vol. 47, No. 5, 2006, pp. 1569-1574. doi:10.1016/j.polymer.2005.12.068 [16] M. E. Sánchez-Vergara, M. A. Ruiz Farfán, J. R. Álvarez, A. Ponce Pedraza, A. Ortiz and C. Álvarez-Toledano, “Electrical and Optical Properties of C46H22N8O4KM (M = Co, Fe, Pb) Molecular-Material Thin Films Prepared by the Vacuum Thermal Evaporation Technique,” Spectro- chimica Acta Part A: Molecular and Biomolecular Spec- troscopy, Vol. 66, No. 3, 2007, pp. 561-567. doi:10.1016/j.saa.2006.03.040 [17] G. Socrates, “Infrared and Raman Characteristic Group and Z. A. El Sayed, “FTIR, Frequencies: Tables and Charts,” 3rd Edition, John Wiley and Sons, Hokoben, 2001. [18] R. Seoudi, G. S. El-Bahy TGA and DC Electrical Conductivity Studies of Phthalo- cyanine and Its Complexes,” Journal of Molecular Struc- ture, Vol. 753, No. 1-3, 2005, pp. 119-126. doi:10.1016/j.molstruc.2005.06.003 [19] M. E. Sánchez Vergara, A. Ortiz Rebollo, J. R. Alvarez and M. Rivera, “Molecular Materials Derived from MPc (M = Fe, Pb, Co) and 1,8-Dihydroxiantraquinone Thin Films: Formation, Electrical and Optical Properties,” Journal of Physics and Chemistry of Solids, Vol. 69, No. 1, 2008, pp. 1-7. doi:10.1016/j.jpcs.2007.07.084 [20] M. M. El-Nahass, A. M. Farag, K. F. Abd El-Rahman and A. A. A. Darwish, “Dispersion Studies and Elec- tronic Transitions in Nickel Phthalocyanine Thin Films,” Optics & Laser Technology, Vol. 37, No. 7, 2005, pp. 513-523. doi:10.1016/j.optlastec.2004.08.016 [21] G. A. Kumar, J. Thomas, N. George, B. A. Kumar, P. Rad- hakrishnan, V. P. N. Nampoori and C. P. G. Vallabhan, “Op- tical Absorption Studies of Free (H2Pc) and Rare Earth (RePc) Phthalocyanine Doped Borate Glasses,” Physics and Chemistry of Glasses, Vol. 41, No. 2, 2000, pp. 89-93.
|