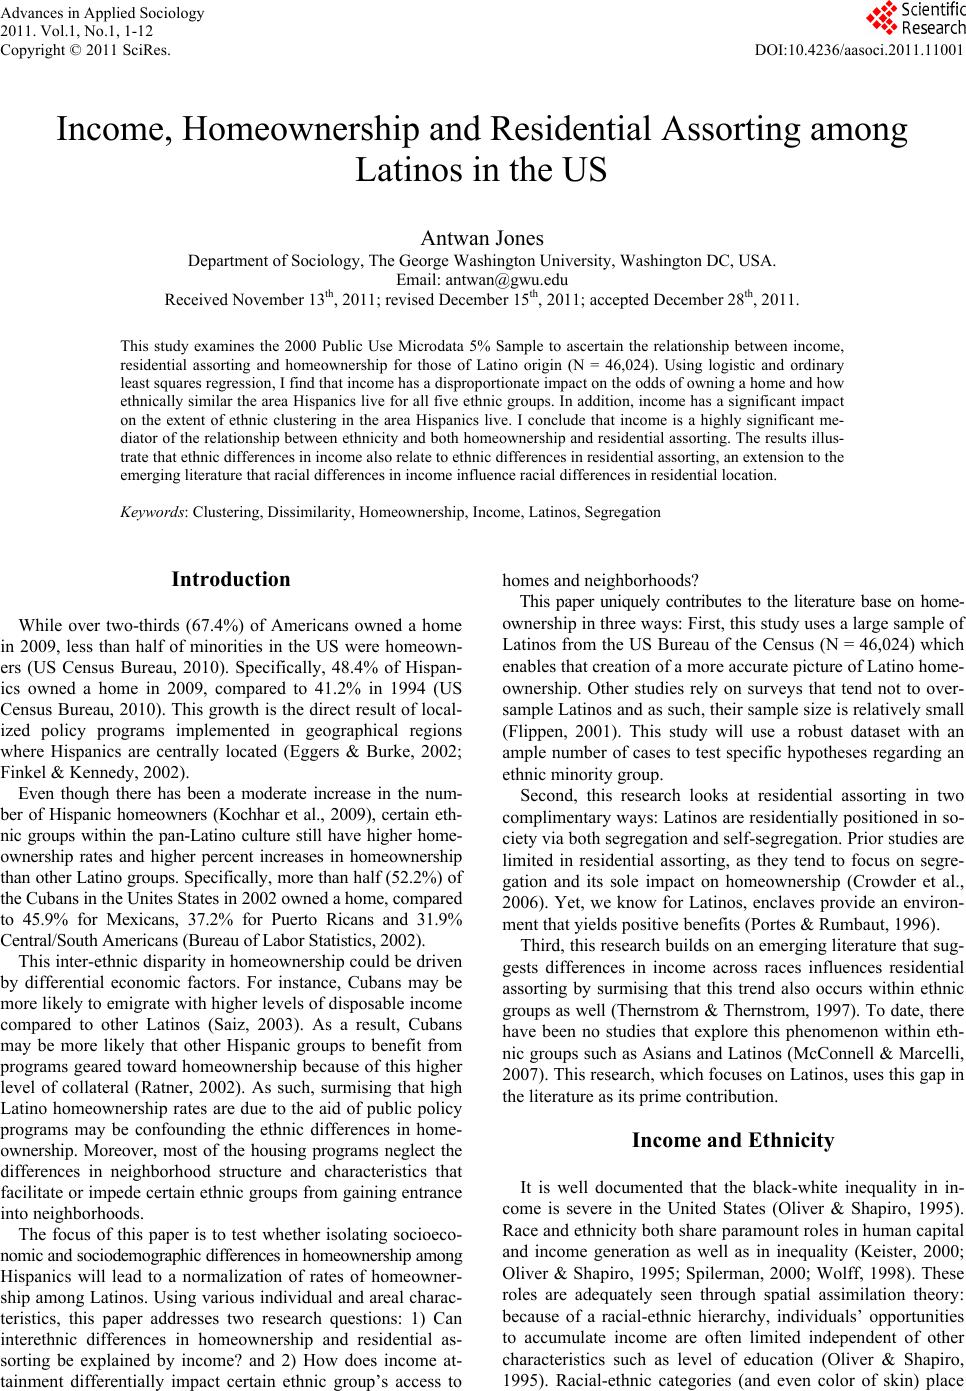
 Advances in Applied Sociology 2011. Vol.1, No.1, 1-12 Copyright © 2011 SciRes. DOI:10.4236/aasoci.2011.11001 Income, Homeownership and Residential Assorting among Latinos in the US Antwan Jones Department of Sociology, The George Washington University, Washington DC, USA. Email: antwan@gwu.edu Received November 13th, 2011; revised December 15th, 2011; accepted December 28th, 2011. This study examines the 2000 Public Use Microdata 5% Sample to ascertain the relationship between income, residential assorting and homeownership for those of Latino origin (N = 46,024). Using logistic and ordinary least squares regression, I find that income has a disproportionate impact on the odds of owning a home and how ethnically similar the area Hispanics live for all five ethnic groups. In addition, income has a significant impact on the extent of ethnic clustering in the area Hispanics live. I conclude that income is a highly significant me- diator of the relationship between ethnicity and both homeownership and residential assorting. The results illus- trate that ethnic differences in income also relate to ethnic differences in residential assorting, an extension to the emerging literature that racial differences in income influence racial differences i n residential location. Keywords: Clustering, Dissimilarity, Homeownership, Income, Latinos, Segregation Introduction While over two-thirds (67.4%) of Americans owned a home in 2009, less than half of minorities in the US were homeown- ers (US Census Bureau, 2010). Specifically, 48.4% of Hispan- ics owned a home in 2009, compared to 41.2% in 1994 (US Census Bureau, 2010). This growth is the direct result of local- ized policy programs implemented in geographical regions where Hispanics are centrally located (Eggers & Burke, 2002; Finkel & Kennedy, 2002). Even though there has been a moderate increase in the num- ber of Hispanic homeowners (Kochhar et al., 2009), certain eth- nic groups within the pan-Latino culture still have higher home- ownership rates and higher percent increases in homeownership than other Latino groups. Specifically , more than half (52.2%) of the Cubans in the Unites States in 2002 owned a home, compared to 45.9% for Mexicans, 37.2% for Puerto Ricans and 31.9% Central/South Americans (Bureau of Labor Statistics, 2002). This inter-ethnic disparity in homeownership could be driven by differential economic factors. For instance, Cubans may be more likely to emigrate with higher levels of disposable income compared to other Latinos (Saiz, 2003). As a result, Cubans may be more likely that other Hispanic groups to benefit from programs geared toward homeownership because of this higher level of collateral (Ratner, 2002). As such, surmising that high Latino homeownership rates are due to the aid of public policy programs may be confounding the ethnic differences in home- ownership. Moreover, most of the housing programs neglect the differences in neighborhood structure and characteristics that facilitate or impede certain ethnic groups from gaining entrance into neighborhoods. The focus of this paper is to test whether isolating socioeco- nomic and sociodemographic differences in homeownership among Hispanics will lead to a normalization of rates of homeowner- ship among Latinos. Using various individual and areal charac- teristics, this paper addresses two research questions: 1) Can interethnic differences in homeownership and residential as- sorting be explained by income? and 2) How does income at- tainment differentially impact certain ethnic group’s access to homes and neighborhoods? This paper uniquely contributes to the literature base on home- ownership in three ways: First, this study uses a large sample of Latinos from the US Bureau of the Census (N = 46,024) which enables that creation of a more accurate picture of Latino home- ownership. Other studies rely on surveys that tend not to over- sample Latinos and as such, their sample size is relatively small (Flippen, 2001). This study will use a robust dataset with an ample number of cases to test specific hypotheses regarding an ethnic minority group. Second, this research looks at residential assorting in two complimentary ways: Latinos are residentially positioned in so- ciety via both segregation and self-segregation. Prior studies are limited in residential assorting, as they tend to focus on segre- gation and its sole impact on homeownership (Crowder et al., 2006). Yet, we know for Latinos, enclaves provide an environ- ment that yields positive benefits (Portes & Rumbaut, 1996). Third, this research builds on an emerging literature that sug- gests differences in income across races influences residential assorting by surmising that this trend also occurs within ethnic groups as well (T hernstrom & Thernstrom, 1997). To date, there have been no studies that explore this phenomenon within eth- nic groups such as Asians and Latinos (McConnell & Marcelli, 2007). This research, which focuses on Latinos, uses this gap in the literature as its prime contributio n. Income and Ethnicity It is well documented that the black-white inequality in in- come is severe in the United States (Oliver & Shapiro, 1995). Race and ethnicity both share paramount roles in human capital and income generation as well as in inequality (Keister, 2000; Oliver & Shapiro, 1995; Spilerman, 2000; Wolff, 1998). These roles are adequately seen through spatial assimilation theory: because of a racial-ethnic hierarchy, individuals’ opportunities to accumulate income are often limited independent of other characteristics such as level of education (Oliver & Shapiro, 1995). Racial-ethnic categories (and even color of skin) place  A. JONES 2 individuals in this hierarchy, with Whites ranked above non- Whites and among non-Whites ranked Asian, Hispanic, and Black in order (Oliver & Shapiro, 1995). These social posi- tions offer differential opportunities and constraints in the ac- cumulation of income. Examples of the structural effect of the ethnic hierarchy in- clude but are not limited to the following four aspects. First, minorities are more likely to have lower incomes. The ethnic hierarchy in the US sorts individuals to the capital-intensive primary sector and labor intensive secondary sector of the labor market and subjects them to institutional or other forms of dis- crimination (Doeringer & Piore, 1971). Second, minority workers are strictly placed in the ethnic queue for a job (Lieberson, 1980; Reskin & Roos, 1990) and bottom positions in the ethnic hierarchy are the last to be con- sidered. Thus, coupled with being tracked into secondary sector occupations, minorities are also being considered last for those positions. Third, minorities are more likely to live in segregated neigh- borhoods. Segregation creates unfavorable lending institution policies and housing prices in dual housing markets (Alba & Logan, 1991; Massey & Denton, 1993). Minorities are subject to higher mortgage interest rates and their houses depreciate in segregated neighborhoods (Williams et al., 2005). Fourth, these constraints further pass across generations. The disadvantages of minorities are replicated and deepened through intergenerational transfers of income in the form of inheritance (Spilerman, 2000). Blacks and Hispanics have a lower inci- dence and lesser amounts of parental intergenerational transfers (Smith, 1995), which directly affects the amount of income and indirectly affects income through the investment in children’s college education (Conley, 1999). These constraints face non- Whites even though their human capital is comparable with Whites, resulting in their lower rate of income accumulation (Hao, 2006). Because income is accumulated along the life cycle, differential rates of income accumulation lead to increas- ing disparities in income that follow throughout the life cycle. Differential rates also lead to increasing disparities in other im- portant things in life, suc h as property purchases, inheritance an d credit (Hao, 2004). Residential Segregation and Self-Segregation Given that income provides access to resources that affect homeownership, it is also feasible that income, along with his- torical, geographical and migration patterns, impact general residential assorting of minorities. Residential assorting in this research is defined as the percent distribution of ethnic group’s presence at a given neighborhood level. Two key archetypes of a high percent distribution of Latino groups are residential seg- regation and self-segregation. Both have differential impacts on homeownership and income operates differently in these two types of neighborhood types. However, income may have a greater positive effect in self-segregated areas rather than insti- tutionalized segregated residential areas. Residential Segregation Segregation is generally defined as the practice of separating people of different races, classes, or ethnic groups, in various different social contexts such as schools, housing, and public or commercial facilities. When discussing residential segregation, it is important to slightly alter this definition. Residential seg- regation can be defined as the practice of separating and grouping people of different racial or socioeconomic groups in the con- text of housing (Massey, 1989). This separation can be gener- ally conceptualized in one of two forms: denial of access into a neighborhood or partitioning members of a group into a confined, geographic entity. According to some, residential segregation is more pronounced in areas where there are more rented apartments that homes (Massey, 1989). This is an important observation, as homeown- ership represents an important form of household income, both through the status (i.e., wealth creation) and social psychology- cal benefits it embodies and through the forced savings, infla- tion protection and numerous tax benefits its confers (Henretta, 1979; Kain & Quigley, 1972). Income inequality is a basic component of place stratification theory—those with the great- est income also tend to be those at the top of the hierarchy and tend to reside outside of segregated neighborhoods (Iceland, 2004; Haan, 2005). Essentially, income creates a division, and those with more income are able to not only actively decide where they want to live, but, as a result, they inevitably decide where those with little income can live. There is little research on the effect of residential segregation on Hispanics with regards to homeownership. Flippen (2001) states that these shortcomings need to be addressed because of three facts: 1) Hispanic-White segregation has increased with time in the United States; 2) Hispanic segregation is lower than corresponding figures for African Americans, even though they are the largest group; and 3) There is a divergent segregation experience between those Hispanics who enter the country and those Hispanics who are second- and third-generation immi- grants in the United States. Previous research on the impact of segregation on home- ownership for Hispanics has drawn three conclusions: First, this type of ethnic assorting negatively affects homeownership at all levels of socioeconomic status. Flippen (2001) was able to as- certain this conclusion by comparing homeownership within segregated areas with regards to Blacks and Whites. Second, there is an intergenerational link in ethnic residential segrega- tion and this intergenerational link decreases the propensity to live in an ethnically diverse neighborhood. Borjas (1998) found that the probability that a respondent lived in an ethnically seg- regated neighborhood in 1992 would be 49.5 percentage points higher if their parents also lived in an ethnically segregated neighb orh ood. Th i rd, re si de ntial se g regati on ha s a se mi -sta bi lizin g, yet negative affect on housing tenure and resilience of neigh- borhood change, that is, people who live in segregated areas tend to stay in these areas, which then create little room for the neighborhood to change. Painter et al. (2001) finds that al- though Latinos have a higher likelihood of residing in their neighborhood for more than ten years, they also have lower homeownership probabilities. In addition, if one is a recent im- migrant into this segregated area, this probability decreases further by 12 percentages points (Painter et al., 2001). What the litera- ture generally shows is a negative outcome for Hispanics that live in segregated areas with regards to homeownership. Residential Self-Segregation The notion of self-segregation has a longstanding presence in the literature but in the public sphere, Tatum’s (1999) boo k, Why are all the black kids sitting together in the cafeteria? and other conversations about race, sparked public concern over the issue of self-segregation. Self-segregation, loosely defined, is the tendency for people of one ethnic group to gravitate to- wards members of that ethnic group. The assumption embodied in self-segregation is that people are making individual, rational choices that are independent of social structures that may force  A. JONES 3 the individuals in close arrangements otherwise. In the Latino context, self-segregation occurs in the form of enclaves. An en- clave is a spatial residential concentration of immigrants from a given ethnic group. There is much information on enclaves and the enclave labor market; however, there are only a few empirical studies that ad- dress the enclave impact on individual homeownership. Gener- ally, the function of enclaves is to incorporate recent immigrants into mainstream society without assimilation (South et al., 2005). Rosenbaum (1992) looks at the case of New York City and finds that enclaves allow for privileged information of housing vacancies before the unit even becomes vacant. In addition, rental turnover occurs within the White-Puerto Rican context when units are of low quality. Puerto Rican-White turnover occurs when the rental units are in higher quality neighborhoods. Krivo (1995) posits that household crowding and housing costs play a role in the low homeownership rates of Mexicans, Puerto Ricans and Cubans. However, the strongest predictors of homeownership were the ethnic composition of one’s neighbors and the composition of the immigrant’s household. Income is used as a control variable and not as a focus variable, which is a recurring, problematic issue in research on homeownership and neighborhood composition. Regardless, once the data are post- stratified by ethnicity and national origin, Krivo finds that for Cubans, the regression has little explanatory power for these groups. Krivo surmises that because of the nature of the immi- grant enclaves (i.e., in Florida) having a strong influence on the property value and ethnic composition of one’s neighbors, these predictors that were once significant cease to be significant in another model because the metric has changed. Within the enclave, the property value and neighborhood composition has a different meaning. Property value must in- clude spillover effects, and neighborhood composition must also include absence of assimilation (Logan et al., 2002). These two things are implied when measuring Latino groups. As such, if researchers were to operationalize the variables that would con- ceptualize the nature of segregation in an enclave, they might find significance in the predictors for the Cuban case that Krivo could not. Hypotheses On the basis of the above review, the following hypotheses will be tested about the impact of income, homeownership and residential assorting for Latinos: 1) Because income is generally salient in homeownership, increasing the amount of income will increase the likelihood of a Latino person owning a home. 2) Because income is generally salient in residential assorting, increasing the amount of income will increase the likelihood of a Latino person owning a home in a non-segregated neighbor- hood. However, low income will increase the likelihood of a Latino person to rent a home in a se gr ega te d n eighborhood. 3) While income is important in residential outcomes, ethnic- ity also plays a role in shaping how and where individuals re- side, as not all ethnic groups own homes or live in areas uni- formly similar. As such, income will have differential impacts with regard to ethnic status. Thus, for some groups, income will matter more in dictating whether or not they own a home and whether or not they live in segregated or self-segregated areas. Specifically, Cubans will be the most impacted by income’s influence on residential outcomes than other Latino groups. Likewise, compared to other Latino groups, Puerto Ricans will be the least impacted by income’s influence on residential out- comes. Data and Methods For this research, I will be analyzing the 2000 Public Use Microdata Sample (PUMS) files. There are fifty files, each cor- responding to the fifty states. The PUMS files contain records representing five-percent samples of the occupied and vacant housing units in the US and the people in the occupied units. People living in group quarters also are included. The PUMS files can be used to answer many questions about housing units and households in the United States. The interviews cover core questions that are repeated each decade. The PUMS files pro- vide data on apartments, single-family homes, mobile homes, vacant homes, family composition, income, housing and neigh- borhood quality, housing costs, equipment, fuels, size of hous- ing unit, and recent movers. The overall sample size is 46,024 persons of Latino origin who identified themselves as house- holder or head of household and who lived in identifiable Pub- lic Use Microdata Areas (PUMAs). The PUMS files contain PUMAs in order to maintain the confidentiality of the PUMS data. The 5-percent state-level files contain PUMAs having a minimum population of 100,000. Each state is separately identified and may be comprised of one or more PUMAs. Large metropolitan areas may be subdivided into PUMAs. PUMAs and do not cross sta te lines. PUMAs also are defined for places of residence on April 1, 1995 and places of work. The two dependent variables are homeownership propensity (whether or not the respondent owns a home) and residential assorting (the extent to which the respondent lives in a segre- gated area). Homeownership propensity is a dummy variable, based on if the respondent owns a home (which is the reference category). Residential assorting is measured by two segregation indices: evenness and clustering. Conceptually, evenness mea- sures the percentage of a group’s population that would have to change residence for each neighborhood to have the same per- centage of that group as the metropolitan area overall (Massey & Denton, 1989). To measure evenness, the index of dissimi- larity, Id, will be used. The range of this index is from 0 (com- plete integration) to 1 (complete segregation). Clustering measures the extent to which areal units inhabited by minority members adjoin one another, or cluster, in space (Massey & Denton, 1993; Wilkes & Iceland, 2004). The US Bureau of the Census has two distinct measures of clustering: spatial proximity, which is the average of intragroup proximi- ties for the minority and majority populations weighted by the proportions each group represents of the total population, and relative clustering, which compares the average distance between minority members with the average distance between majority members (Wilkes & Iceland, 2004). For this research, relative clustering is used. This index equals 0 when minority members display the same amount of clustering as the majority, is posi- tive when minorities display greater clustering than the majority, and is negative when minorities display less clustering than the majority. Thus, evenness measures people (capturing segrega- tion) and clustering measures space (capturing self-segregation). Ethnicity is the main independent variable and is captured by six categories: Mexican (53.76% of the sample), Puerto Rican (11.70%), Cuban (5.96%), South American (a conglomeration of several ethnicities tied to countries in South America as well as Central America, all accounting for 14.48% of the sample), Spaniard (origin is from the country of Spain, accounting for  A. JONES 4 0.51% of the sample) and Other (13.58%). Other refers to peo- ple who listed a religion as their ancestry but listed Hispanic as their ethnicity. Because of the relatively high percentage of those falling in the “Other” category, they will be kept in the analysis. There are two blocks of control variables that will be simul- taneously controlled for in the model. In this study, demo- graphic variables shall be defined as those variables to which ethnicity is not inextricably linked. Age is one control variable that facilitates the relationship between income, homeowner- ship and cost of home. Young adults may be more likely to not have income and rent instead of own (Skaburskis, 1996). In ad- dition, young adults may be more likely to live in highly segre- gated areas. Age, in the regression models, will be centered, in order to limit any collinearity present in the data. Education, a standard indicator of socioeconomic status, is also a control va riable—the assi milation model expects more highly edu- cated people to be more likely to accumulate income and own a home (Borjas, 1998) Highly educated persons should live in more diverse environments. Education, as a categorical variable, will also be centered in the regression analysis. Ethnic employment status is also a determinant of income, homeownership and residential as- sortment. Specifically, those individuals who are employed are more likely to own a home, have income and have live in non-segregated areas. Employment status is a dummy variable. Gender is a control variable used in the model s. The literat ure sug- gests that on average, me n are more likely to accrue income and be homeowners than women (Reskin & Roos, 1990). Thus, men are used as th e contr ast c ategor y. Marital status is another demographic variable related to the dependent variab les. Non-family households and cohabitors may be less permanent and therefore less able to commit themselves to owning a home (Wu et al., 2004). In addition, divorced cou- ples will be less likely to own a home, as they are more apt to sell the house after marital dissolution. This is also true for sin- gle-parent families. As such, it is expected to find more stable family units engaging in homeownership and income than un- stable family types. Marital status is conceptualized as a dummy variable indicating if the respondent has ever been married. Region of residence is the final demographic variable included in the analysis. Persons in the southern region of the United States are more prone to own homes, as there is more residen- tial assorting of homes in the South than the other regions (Walker et al., 1997). In addition, those in the southern region would be more likely to live in segregated areas than other regions. Thus, the South is used as the contrast categ ory. In tandem with demographic variables, sociodemographic vari- ables shall be defined as those variables with which ethnic- ity shares some relationship. Immigration status (immigrated before 1975 or after 1975) is an aspect of assimilation (Alba, 1992). This measure operationalizes the spatial assimilation model, which would anticipate less desirable spatial outcomes, and thus less proximity to non-Hispanic whites, for recent immigrants. The cut-off date of 1975 is literature-consistent (Jones-Correa, 1998). Language is also a sociodemographic determinant: bilingual persons who speak English poorly are the most likely to live in residential enclaves (Chandrasekhar, 2004). English language ability, meaning speaking English only at home and speaking English well, is an important aspect of assimilation. Nativity, in tandem with language, is another factor that affects whether one lives in an ethnically similar area. Group members born in the United States are expected to be less likely to live in ethnic neighborhoods than immigrants; among immigrants, the most recent arrivals are expected to be most likely to live in residen- tial enclaves (Chandrasekhar 2004). To examine the relationship between ethnicity, income and homeownership, logistic regression is used. To examine the re- lationship between ethnicity, income and residential assorting, ordinary least squares regression is used. To model each of the three dependent variables, each dependent variable will have three models. The first model for each dependent variable will include income and ethnicity. The subsequent model for each dependent variable will add to the previous model demographic and sociodemographic control variables. The final model for each dependent variable will add to the second model interact- tion terms between income and ethnicity. Results Descriptive Statistics Table 1 presents descriptive statistics for the characteristics of respondents, both as the sample as a whole and stratified by each individual Latino ethnic group. Significant differences are marked on the table. Approximately 45 percent of the respon- dents in the sample are homeowners, with higher percentages coming from Cubans (57.45%) and Spaniards (57.81%). Puerto Ricans and South Americans have the lowest percentage of homeowners, with 34.7 and 34.4 percent respectively. Across all ethnicities, there seems to suggest a high level of segrega- tion, the lowest value on the dissimilarity index being 0.5957 and the highest value being 0.6940. With the relative clustering index, all values are positive, indicating Latinos display greater clustering than the Whites. The average family income for the sample is around $38,000. Cubans and Spaniards have consid- erably higher average family incomes ($42,000 and $51,000 respectively), while Puerto Ricans have considerably lower av- erage family incomes ($33,000). Demographic controls. The average age of the respondents in the sample is 43 years. Spaniards and Cubans have consid- erably higher mean ages, 48 and 53 respectively. Cubans and Spaniards also have higher educational attainment relative to the overall average. Cubans, on average, were high school gra- duates, and Spaniards have an average of one or more years of college with no degree. The overall average i s twelfth grade with no diploma. Approximately 62% of the sample is employed, with higher percentages in Mexicans (65%) and South Ameri- cans (66%) and lower percentages in Cubans (52%) and Puerto Ricans (55%). Generally, at least half of those in each ethnicity are employed. Over two-thirds of the sample is male. Even more outstanding, 72% of Mexicans in the sample are male, indicat- ing that there are significantly more males than female repre- sentation relative to the other ethnic groups. Over half of the sample (58%) is married, again with a significant difference in the proportion of married Mexicans (63%). Lastly, 35 percent of this sample lives in the Southern part of the United States. Ethnic variation exists in the data, as 74% of Cubans residing in the South, reinforcing the great geographic concentration that Cubans have in the South, particularly in Florida where there are Cuban enclaves (Borjas, 1998). Among the remaining eth- nicities, this characteristic is reversed, with 22% being the low- est percentage of residents in the South (Puerto Ricans) and 37 percent being the highest (“Other” group). Sociodemographic controls. The overall percentage of peo- ple who immigrated after 1975 is 44%. South Americans had the highest percentage of respondents who immigrated after 1975 (72%) while Mexicans approached the overall proportion of respondents immigrating after 1975 (44%). The remainder of the ethnicities showed less than two-fifths of the respondents 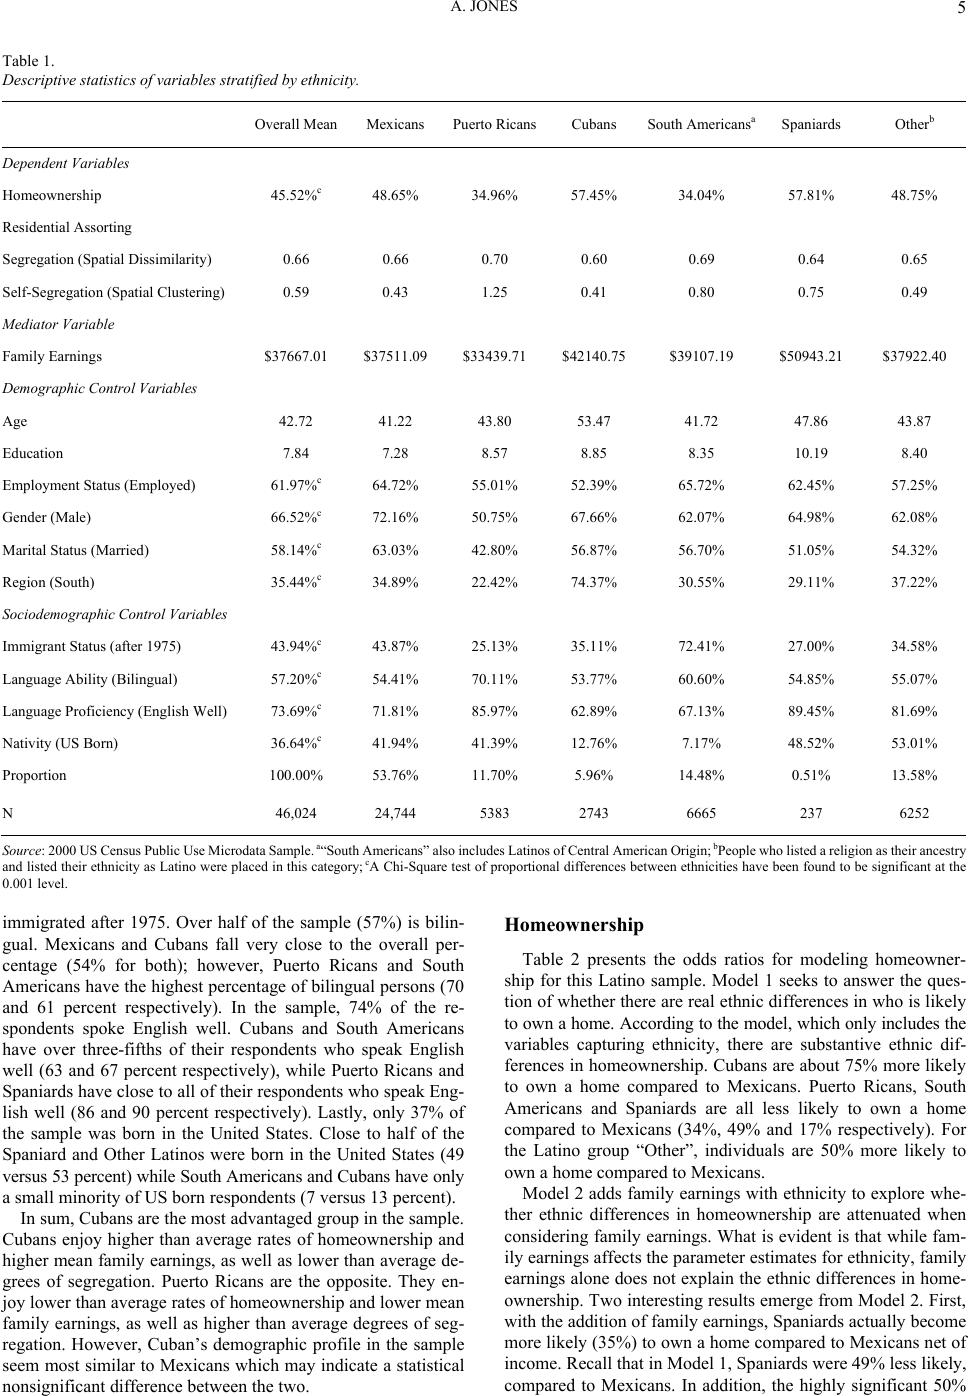 A. JONES 5 Table 1. Descriptive statistics of variables stratified by ethnicity. Overall Mean Mexicans Puerto RicansCubans South Americansa Spaniards Otherb Dependent Variables Homeownership 45.52%c 48.65% 34.96% 57.45% 34.04% 57.81% 48.75% Residential Assorting Segregation (Spatial Dissimilarity) 0.66 0.66 0.70 0.60 0.69 0.64 0.65 Self-Segregation (Spatial Clustering) 0.59 0.43 1.25 0.41 0.80 0.75 0.49 Mediator Variable Family Earnings $37667.01 $37511.09 $33439.71 $42140.75 $39107.19 $50943.21 $37922.40 Demographic Control Variables Age 42.72 41.22 43.80 53.47 41.72 47.86 43.87 Education 7.84 7.28 8.57 8.85 8.35 10.19 8.40 Employment Status (Employed) 61.97%c 64.72% 55.01% 52.39% 65.72% 62.45% 57.25% Gender (Male) 66.52%c 72.16% 50.75% 67.66% 62.07% 64.98% 62.08% Marital Status (Marr ied) 58.14%c 63.03% 42.80% 56.87% 56.70% 51.05% 54.32% Region (South ) 35.44%c 34.89% 22.42% 74.37% 30.55% 29.11% 37.22% Sociodemographic Control Variables Immigrant Status (after 1975) 43.94%c 43.87% 25.13% 35.11% 72.41% 27.00% 34.58% Language Ability (Bilingual) 57.20%c 54.41% 70.11% 53.77% 60.60% 54.85% 55.07% Language Proficiency (English Well) 73.69%c 71.81% 85.97% 62.89% 67.13% 89.45% 81.69% Nativity (US Born) 36.64%c 41.94% 41.39% 12.76% 7.17% 48.52% 53.01% Proportion 100.00% 53.76% 11.70% 5.96% 14.48% 0.51% 13.58% N 46,024 24,744 5383 2743 6665 237 6252 Source: 2000 US Census Public Use Microdata Sample. a“South Am ericans” al so includes Latinos of Central American Origin; bPeople who listed a religion as their ancestry and listed their ethnicity as Latino were placed in this category; cA Chi-Square test of proportional differences between ethnicities have been found to be sign ificant at the 0.001 le vel. immigrated after 1975. Over half of the sample (57%) is bilin- gual. Mexicans and Cubans fall very close to the overall per- centage (54% for both); however, Puerto Ricans and South Americans have the highest percentage of bilingual persons (70 and 61 percent respectively). In the sample, 74% of the re- spondents spoke English well. Cubans and South Americans have over three-fifths of their respondents who speak English well (63 and 67 percent respectively), while Puerto Ricans and Spaniards have close to all of their respondents who speak Eng- lish well (86 and 90 percent respectively). Lastly, only 37% of the sample was born in the United States. Close to half of the Spaniard and Other Latinos were born in the United States (49 versus 53 percent) while South Americans and C ubans have o nly a small minority of US born respondents (7 versus 13 percent). In sum, Cubans are the most advantaged group in the sample. Cubans enjoy higher than average rates of homeownership and higher mean family earnings, as well as lower than average de- grees of segregation. Puerto Ricans are the opposite. They en- joy lower than average rates of homeownership and lower mean family earnings, as well as higher than average degrees of seg- regation. However, Cuban’s demographic profile in the sample seem most similar to Mexicans which may indicate a statistical nonsignificant difference between the two. Homeownership Table 2 presents the odds ratios for modeling homeowner- ship for this Latino sample. Model 1 seeks to answer the ques- tion of whether there are real ethnic differences in who is likely to own a home. According to the model, which only includes the variables capturing ethnicity, there are substantive ethnic dif- ferences in homeownership. Cubans are about 75% more likely to own a home compared to Mexicans. Puerto Ricans, South Americans and Spaniards are all less likely to own a home compared to Mexicans (34%, 49% and 17% respectively). For the Latino group “Other”, individuals are 50% more likely to own a home compared to Mexicans. Model 2 adds family earnings with ethnicity to explore whe- ther ethnic differences in homeownership are attenuated when considering family earnings. What is evident is that while fam- ily earnings affects the parameter estimates for ethnicity, family earnings alone does not explain the ethnic differences in home- ownership. Two interesting results emerge from Model 2. First, with the addition of family earnings, Spaniards actually become more likely (35%) to own a home compared to Mexicans net of income. Recall that in Model 1, Spaniards were 49% less likely, compared to Mexicans. In addition, the highly significant 50% 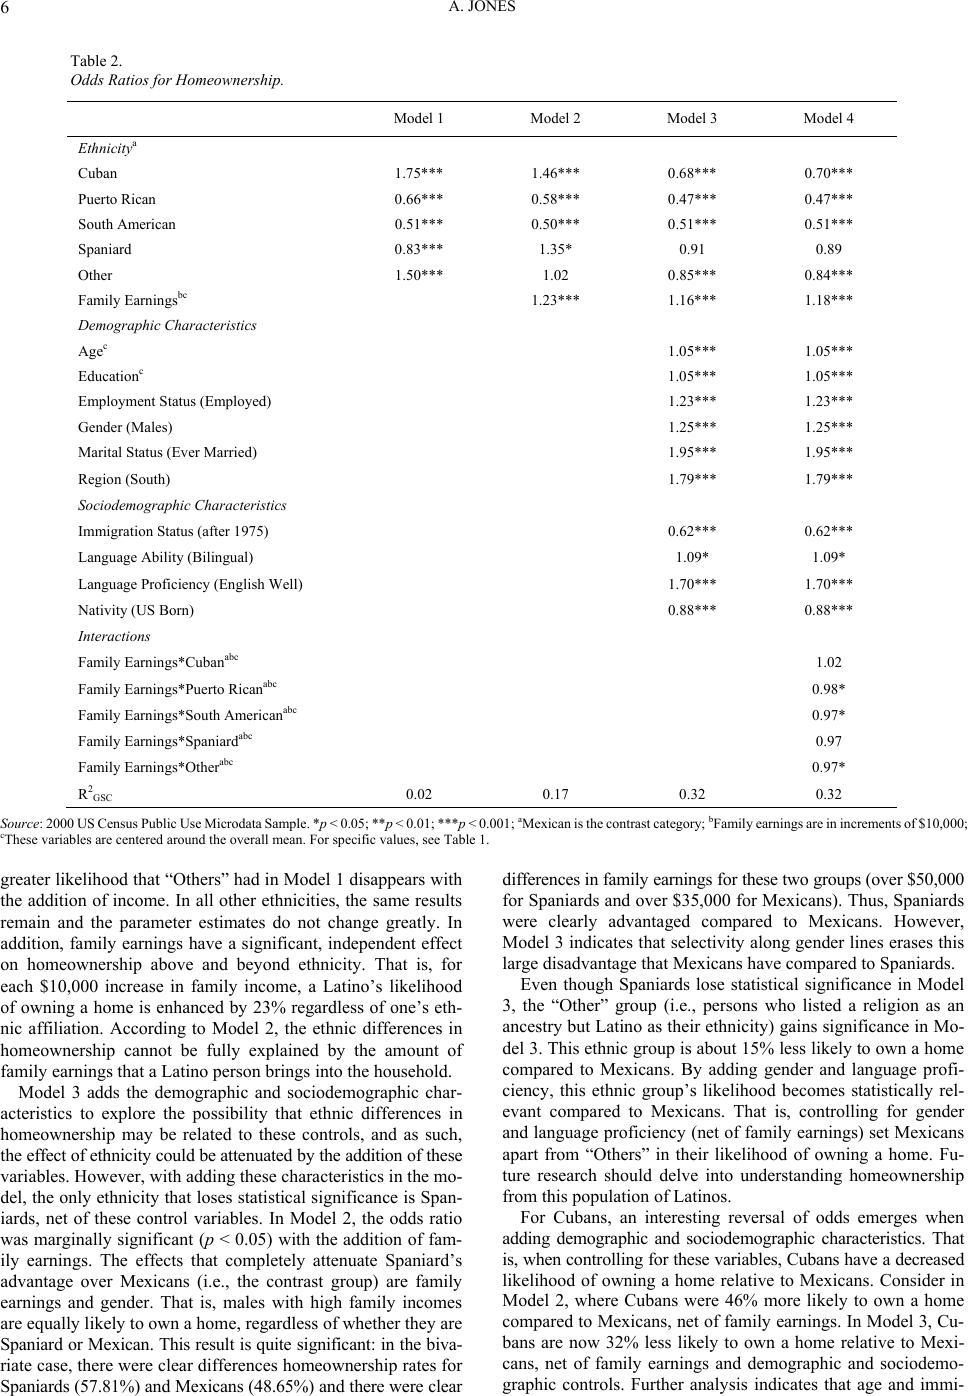 A. JONES 6 Table 2. Odds Ratios for Homeownership. Model 1 Model 2 Model 3 Model 4 Ethnicitya Cuban 1.75*** 1.46*** 0.68*** 0.70*** Puerto Rican 0.66*** 0.58*** 0.47*** 0.47*** South American 0.51*** 0.50*** 0.51*** 0.51*** Spaniard 0.83*** 1.35* 0.91 0.89 Other 1.50*** 1.02 0.85*** 0.84*** Family Earningsbc 1.23*** 1.16*** 1.18*** Demographic Characteristics Agec 1.05*** 1.05*** Educationc 1.05*** 1.05*** Employment Status (Employed) 1.23*** 1.23*** Gender (Ma l es) 1.25*** 1.25*** Marital Status (Ever Married) 1.95*** 1.95*** Region (South) 1.79*** 1.79*** Sociodemographic Characteristics Immigration Status (after 1975) 0.62*** 0.62*** Language A bility (Bilingual) 1.09* 1.09* Language Proficiency (English Well) 1.70*** 1.70*** Nativity (US B orn) 0.88*** 0.88*** Interactions Family Earnings*Cubanabc 1.02 Family Earnings*Puerto Ricanabc 0.98* Family Earnings*South Americanabc 0.97* Family Earnings*Spaniardabc 0.97 Family Earnings*Otherabc 0.97* R2GSC 0.02 0.17 0.32 0.32 Source: 2000 US Census Public Use Microdata Sample. *p < 0.05; **p < 0.01; ***p < 0.001; aMexican is the contrast category; bFamily earnings are in increm ents of $10,000; cThese variables are cent ered around the overall mean. For specific values, see Table 1. greater likelihood that “Others” had in Model 1 disappears with the addition of income. In all other ethnicities, the same results remain and the parameter estimates do not change greatly. In addition, family earnings have a significant, independent effect on homeownership above and beyond ethnicity. That is, for each $10,000 increase in family income, a Latino’s likelihood of owning a home is enhanced by 23% regardless of one’s eth- nic affiliation. According to Model 2, the ethnic differences in homeownership cannot be fully explained by the amount of family earnings that a Latino person brings into the household. Model 3 adds the demographic and sociodemographic char- acteristics to explore the possibility that ethnic differences in homeownership may be related to these controls, and as such, the effect of ethnicity could be attenuated by the addition of these variables. However, with adding these characteristics in the mo- del, the only ethnicity that loses statistical significance is Span- iards, net of these control variables. In Model 2, the odds ratio was marginally significant (p < 0.05) with the addition of fam- ily earnings. The effects that completely attenuate Spaniard’s advantage over Mexicans (i.e., the contrast group) are family earnings and gender. That is, males with high family incomes are equally likely to own a home, regardless of whether they are Spaniard or Mexican. This result is quite significant: in the biva- riate case, there were clear differences homeownership rates for Spaniards (57.81%) and Mexican s (48.65%) and t here were clear differences in family earnings for these two groups (over $50,000 for Spaniards and over $35,000 for Mexicans). Thus, Spaniards were clearly advantaged compared to Mexicans. However, Model 3 indicates that selectivity along gender lines erases this large disadvantage that Mexicans have compared to Spaniards. Even though Spaniards lose statistical significance in Model 3, the “Other” group (i.e., persons who listed a religion as an ancestry but Latino as their ethnicity) gains significance in Mo- del 3. This ethnic group is about 15% less likely to own a home compared to Mexicans. By adding gender and language profi- ciency, this ethnic group’s likelihood becomes statistically rel- evant compared to Mexicans. That is, controlling for gender and language proficiency (net of family earnings) set Mexicans apart from “Others” in their likelihood of owning a home. Fu- ture research should delve into understanding homeownership from this population of Latinos. For Cubans, an interesting reversal of odds emerges when adding demographic and sociodemographic characteristics. That is, when controlling for these variables, Cubans have a decreased likelihood of owning a home relative to Mexicans. Consider in Model 2, where Cubans were 46% more likely to own a home compared to Mexicans, net of family earnings. In Model 3, Cu- bans are now 32% less likely to own a home relative to Mexi- cans, net of family earnings and demographic and sociodemo- graphic controls. Further analysis indicates that age and immi- 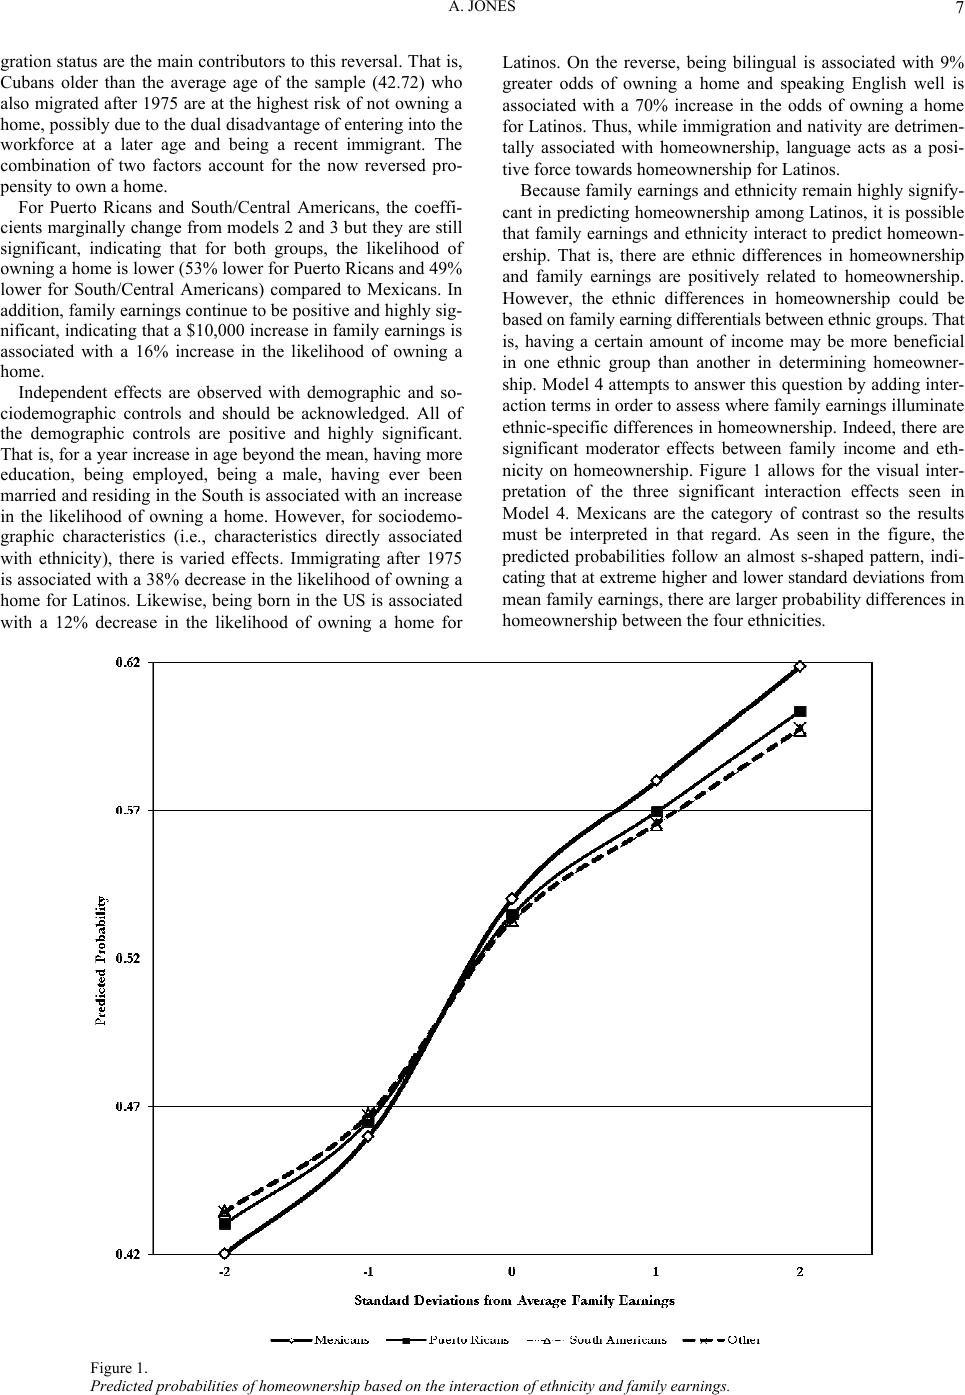 A. JONES 7 gration status are the main contributors to this reversal. That is, Cubans older than the average age of the sample (42.72) who also migrated after 1975 are at the highest risk of not owning a home, possibly due to the dual disadvantage of entering into the workforce at a later age and being a recent immigrant. The combination of two factors account for the now reversed pro- pensity to own a home. For Puerto Ricans and South/Central Americans, the coeffi- cients marginally change from models 2 and 3 but they are still significant, indicating that for both groups, the likelihood of owning a home is lower (53% lower for Puerto Ricans and 49% lower for South/Central Americans) compared to Mexicans. In addition, family earnings continue to be positive and highly sig- nificant, indicating that a $10,000 increase in family earnings is associated with a 16% increase in the likelihood of owning a home. Independent effects are observed with demographic and so- ciodemographic controls and should be acknowledged. All of the demographic controls are positive and highly significant. That is, for a ye ar increase in age beyond the mean, having more education, being employed, being a male, having ever been married and residing in the South is associated with an increase in the likelihood of owning a home. However, for sociodemo- graphic characteristics (i.e., characteristics directly associated with ethnicity), there is varied effects. Immigrating after 1975 is associated with a 38% decrease in the likelihood of owning a home for Latinos. Likewise, being born in the US is associated with a 12% decrease in the likelihood of owning a home for Latinos. On the reverse, being bilingual is associated with 9% greater odds of owning a home and speaking English well is associated with a 70% increase in the odds of owning a home for Latinos. Thus, while immigration and nativity are detrimen- tally associated with homeownership, language acts as a posi- tive force towards homeownership for Latinos. Because family earnings and ethnicity remain highly signify- cant in predicting homeownership among Latinos, it is possible that family earnings and ethnicity interact to predict homeown- ership. That is, there are ethnic differences in homeownership and family earnings are positively related to homeownership. However, the ethnic differences in homeownership could be based on family earning differentials between ethnic groups. That is, having a certain amount of income may be more beneficial in one ethnic group than another in determining homeowner- ship. Model 4 attempts to answer this question by adding inter- action terms in order to assess where family earnings illuminate ethnic-specific differences in homeownership. Indeed, there are significant moderator effects between family income and eth- nicity on homeownership. Figure 1 allows for the visual inter- pretation of the three significant interaction effects seen in Model 4. Mexicans are the category of contrast so the results must be interpreted in that regard. As seen in the figure, the predicted probabilities follow an almost s-shaped pattern, indi- cating that at extreme higher and lower standard deviations from mean family earnings, there are larger probability differences in homeownership between the four ethnicities. Figure 1. Predicted probabilities of homeownership based on the interaction of ethnicity and family earnings. 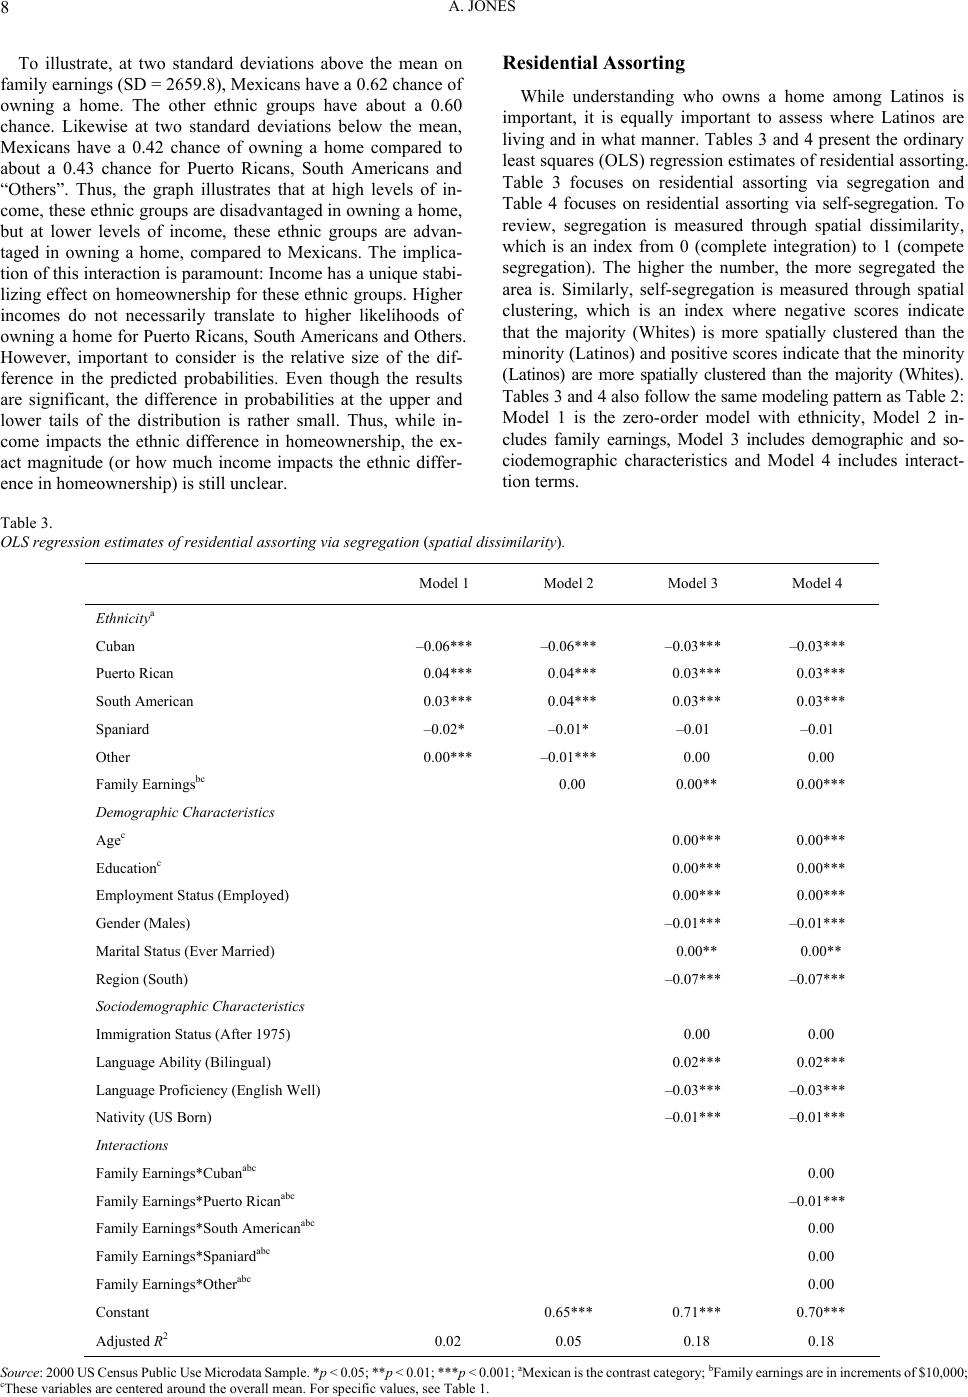 A. JONES 8 To illustrate, at two standard deviations above the mean on family earnings (SD = 2659.8), Mexicans have a 0.62 chance of owning a home. The other ethnic groups have about a 0.60 chance. Likewise at two standard deviations below the mean, Mexicans have a 0.42 chance of owning a home compared to about a 0.43 chance for Puerto Ricans, South Americans and “Others”. Thus, the graph illustrates that at high levels of in- come, these ethnic groups are disadvantaged in owning a home, but at lower levels of income, these ethnic groups are advan- taged in owning a home, compared to Mexicans. The implica- tion of this interaction is paramount: Income has a unique stabi- lizing effect on homeownership for these ethnic groups. Higher incomes do not necessarily translate to higher likelihoods of owning a home for Puerto Ricans, South Americans and Others. However, important to consider is the relative size of the dif- ference in the predicted probabilities. Even though the results are significant, the difference in probabilities at the upper and lower tails of the distribution is rather small. Thus, while in- come impacts the ethnic difference in homeownership, the ex- act magnitude (or how much income impacts the ethnic differ- ence in homeownership) is still unclear. Residential Assorting While understanding who owns a home among Latinos is important, it is equally important to assess where Latinos are livi ng and in what mann er. Tables 3 an d 4 present the ordinary least squares (OLS) regression estimates of residential assorting. Table 3 focuses on residential assorting via segregation and Table 4 focuses on residential assorting via self-segregation. To review, segregation is measured through spatial dissimilarity, which is an index from 0 (complete integration) to 1 (compete segregation). The higher the number, the more segregated the area is. Similarly, self-segregation is measured through spatial clustering, which is an index where negative scores indicate that the majority (Whites) is more spatially clustered than the minority (Latinos) and positive scores indicate that the minority (Latinos) are more spatially clustered than the majority (Whites). Tables 3 and 4 also follow the same modeling pat tern as Table 2: Model 1 is the zero-order model with ethnicity, Model 2 in- cludes family earnings, Model 3 includes demographic and so- ciodemographic characteristics and Model 4 includes interact- tion terms. Table 3. OLS regression estimates of residential assorting via segregation (spatial dissimilarity). Model 1 Model 2 Model 3 Model 4 Ethnicitya Cuban –0.06*** –0.06*** –0.03*** –0.03*** Puerto Rican 0.04*** 0.04*** 0.03*** 0.03*** South American 0.03*** 0.04*** 0.03*** 0.03*** Spaniard –0.02* –0.01* –0.01 –0.01 Other 0.00*** –0.01*** 0.00 0.00 Family Earningsbc 0.00 0.00** 0.00*** Demographic Characteristics Agec 0.00*** 0.00*** Educationc 0.00*** 0.00*** Employment Status (Employed) 0.00*** 0.00*** Gender (Ma l es) –0.01*** –0.01*** Marital Status (Ever Marrie d) 0.00** 0.00** Region (South) –0.07*** –0.07*** Sociodemographic Characteristics Immigration S t atus (After 1975) 0.00 0.00 Language Ab ility (Bilingual ) 0.02*** 0.02*** Language Proficiency (English Well) –0.03*** –0.03*** Nativity (US Born) –0.01*** –0.01*** Interactions Family Earnings*Cubanabc 0.00 Family Earnings*Puerto Ricanabc –0.01*** Family Earnings*South Americanabc 0.00 Family Earnings*Spaniardabc 0.00 Family Earnings*Otherabc 0.00 Constant 0.65*** 0.71*** 0.70*** Adjusted R2 0.02 0.05 0.18 0.18 Source: 2000 US Census Public Use Microdata Sample. *p < 0.05; **p < 0.01; ***p < 0.001; aMexican is the contrast category; bFamily earnings are in increm ents of $10,000; cThese variables are cent ered around the overall mean. For specific values, see Table 1. 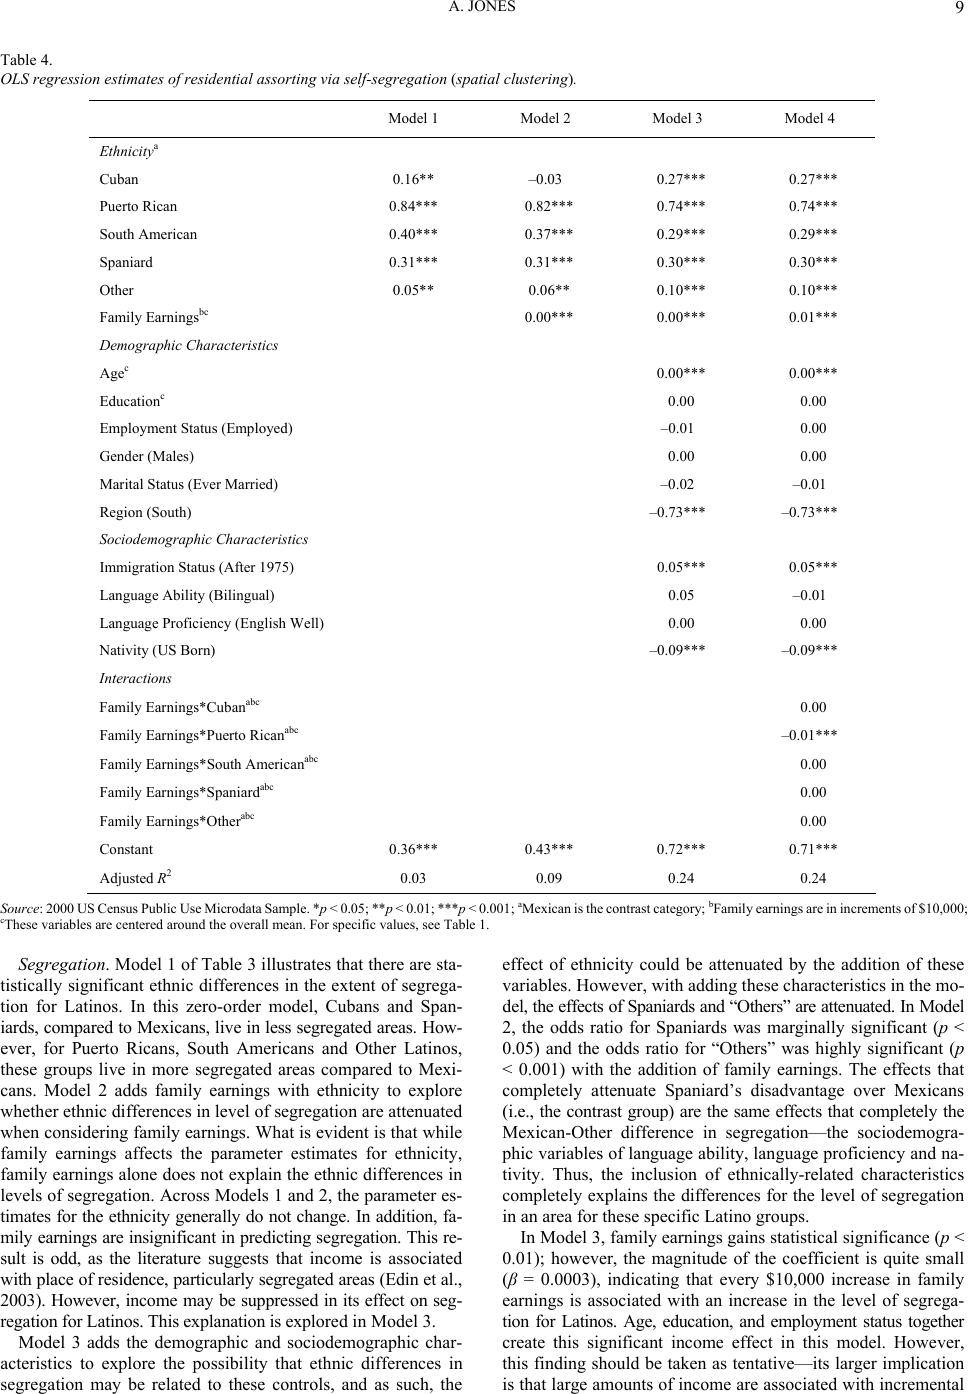 A. JONES 9 Table 4. OLS regression estimates of residential assorting via self-segregation (spatial clustering). Model 1 Model 2 Model 3 Model 4 Ethnicitya Cuban 0.16** –0.03 0.27*** 0.27*** Puerto Rican 0.84*** 0.82*** 0.74*** 0.74*** South American 0.40*** 0.37*** 0.29*** 0.29*** Spaniard 0.31*** 0.31*** 0.30*** 0.30*** Other 0.05** 0.06** 0.10*** 0.10*** Family Earningsbc 0.00*** 0.00*** 0.01*** Demographic Characteristics Agec 0.00*** 0.00*** Educationc 0.00 0.00 Employment Status (Employed) –0.01 0.00 Gender (Males) 0.00 0.00 Marital Status ( Ever Married) –0.02 –0.01 Region (South) –0.73*** –0.73*** Sociodemographic Characteristics Immigration Status (After 1975) 0.05*** 0.05*** Language Ability (Bilingual) 0.05 –0.0 1 Language Proficiency (English Well) 0.00 0.00 Nativity (US Born) –0.09*** –0.09*** Interactions Family Earnings*Cubanabc 0.00 Family Earnings*Puerto Ricanabc –0.01*** Family Earnings*South Americanabc 0.00 Family Earnings*Spaniardabc 0.00 Family Earnings*Otherabc 0.00 Constant 0.36*** 0.43*** 0.72*** 0.71*** Adjusted R2 0.03 0.09 0.24 0.24 Source: 2000 US Census Public Use Microdata Sample. *p < 0.05; **p < 0.01; ***p < 0.001; aMexican is the contrast category; bFamily earnings are in increments of $1 0,000; cThese variables are cent ered around the overall mean. For specific values, see Table 1. Segregation. Model 1 of Table 3 illustrates that there are sta- tistically significant ethnic differences in the extent of segrega- tion for Latinos. In this zero-order model, Cubans and Span- iards, compared to Mexicans, live in less segregated areas. How- ever, for Puerto Ricans, South Americans and Other Latinos, these groups live in more segregated areas compared to Mexi- cans. Model 2 adds family earnings with ethnicity to explore whether ethnic differences in level of segregation are attenuated when considering family earnings. What is evident is that while family earnings affects the parameter estimates for ethnicity, family earnings alone does not explain the ethnic differences in levels of segregation. Across Models 1 and 2, the parameter es- timates for the ethnicity generally do not change. In addition, fa- mily earnings are insignificant in predicting segregation. This re- sult is odd, as the literature suggests that income is associated with place of residence, particularly segregated area s (Edin et al., 2003). However, inco me may be suppressed in its effect on seg- regation for Latinos. This explanation is explored in Model 3. Model 3 adds the demographic and sociodemographic char- acteristics to explore the possibility that ethnic differences in segregation may be related to these controls, and as such, the effect of ethnicity could be attenuated by the addition of these variables. However, with adding these characteristics in the mo- del, the effects of Spaniards and “Others” are attenuated. In Model 2, the odds ratio for Spaniards was marginally significant (p < 0.05) and the odds ratio for “Others” was highly significant (p < 0.001) with the addition of family earnings. The effects that completely attenuate Spaniard’s disadvantage over Mexicans (i.e., the contrast group) are the same effects that completely the Mexican-Other difference in segregation—the sociodemogra- phic variables of language ability, language proficiency and na- tivity. Thus, the inclusion of ethnically-related characteristics completely explains the differences for the level of segregation in an area for these specific Latino groups. In Model 3, family earnings gains statistical significance (p < 0.01); however, the magnitude of the coefficient is quite small (β = 0.0003), indicating that every $10,000 increase in family earnings is associated with an increase in the level of segrega- tion for Latinos. Age, education, and employment status together create this significant income effect in this model. However, this finding should be taken as tentative—its larger implication is that large amounts of income are associated with incremental 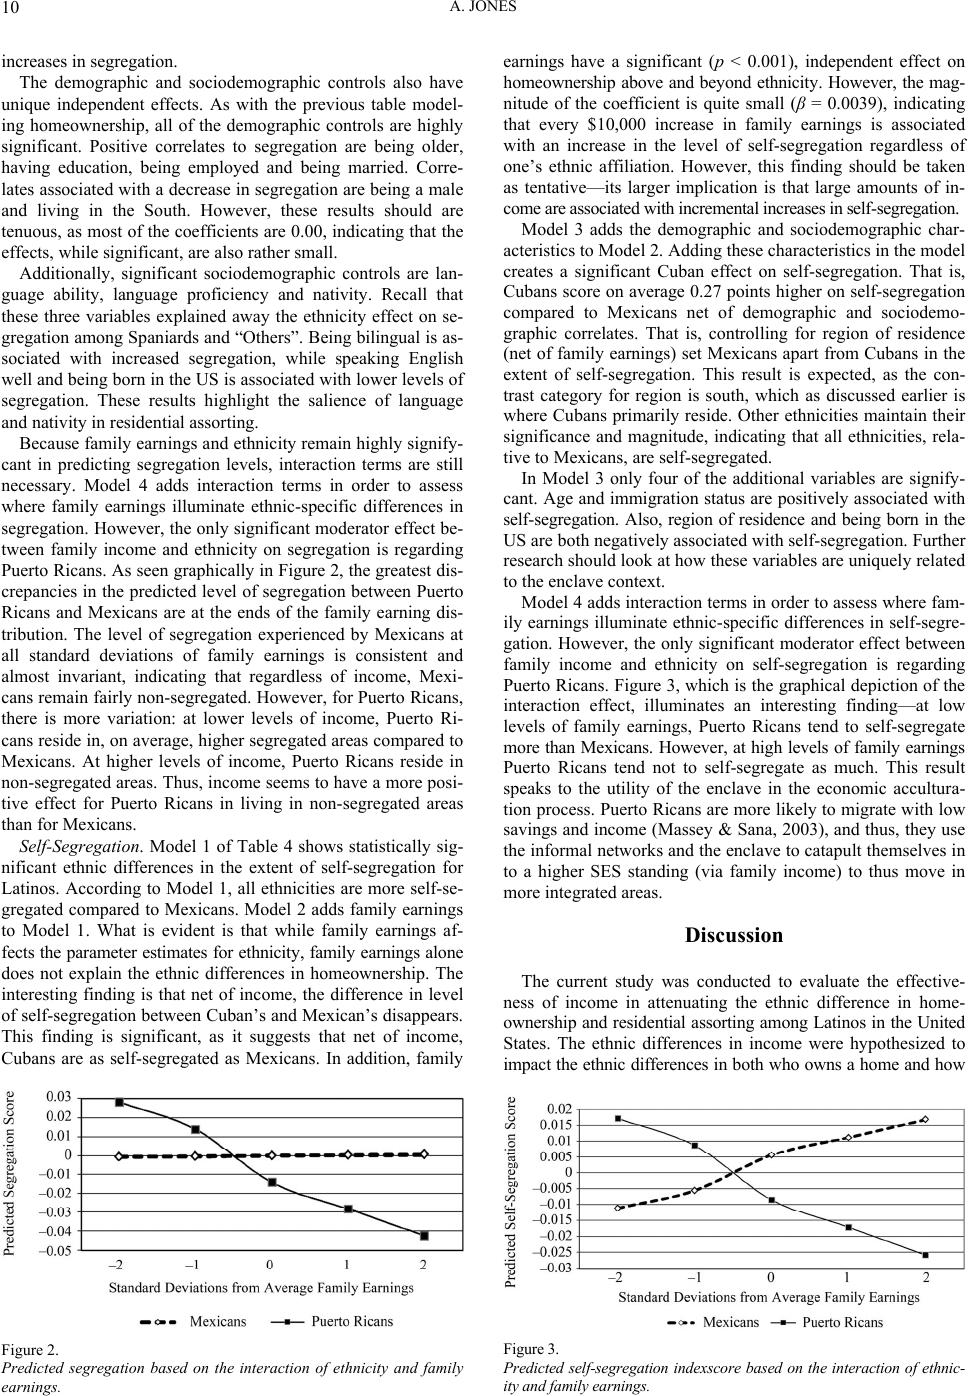 A. JONES 10 increases in segrega tion. The demographic and sociodemographic controls also have unique independent effects. As with the previous table model- ing homeownership, all of the demographic controls are highly significant. Positive correlates to segregation are being older, having education, being employed and being married. Corre- lates associated with a decrease in segregation are being a male and living in the South. However, these results should are tenuous, as most of the coefficients are 0.00, indicating that the effects, while significant, are also rather small. Additionally, significant sociodemographic controls are lan- guage ability, language proficiency and nativity. Recall that these three variables explained away the ethnicity effect on se- gregation among Spaniards and “Others”. Being bilingual is as- sociated with increased segregation, while speaking English well and being born in the US is associated with lower levels of segregation. These results highlight the salience of language and nativity in residential assorting. Because family earnings and ethnicity remain highly signify- cant in predicting segregation levels, interaction terms are still necessary. Model 4 adds interaction terms in order to assess where family earnings illuminate ethnic-specific differences in segregation. However, the only significant moderator effect be- tween family income and ethnicity on segregation is regarding Puerto Ricans. As seen graphically in Figure 2, the greatest dis- crepancies in the predicted level of segregation between Puerto Ricans and Mexicans are at the ends of the family earning dis- tribution. The level of segregation experienced by Mexicans at all standard deviations of family earnings is consistent and almost invariant, indicating that regardless of income, Mexi- cans remain fairly non-segregated. However, for Puerto Ricans, there is more variation: at lower levels of income, Puerto Ri- cans reside in, on average, higher segregated areas compared to Mexicans. At higher levels of income, Puerto Ricans reside in non-segregated areas. Thus, income seems to have a more posi- tive effect for Puerto Ricans in living in non-segregated areas than for Mexicans. Self-Segregation. Model 1 of Table 4 shows statistically sig- nificant ethnic differences in the extent of self-segregation for Latinos. According to Model 1, all ethnicities are more self-se- gregated compared to Mexicans. Model 2 adds family earnings to Model 1. What is evident is that while family earnings af- fects the parameter estimates for ethnicity , family earnings alone does not explain the ethnic differences in homeownership. The interesting finding is that net of income, the difference in level of self-segregation between Cuban’s and Mexican’s disappears. This finding is significant, as it suggests that net of income, Cubans are as self-segregated as Mexicans. In addition, family Figure 2. Predicted segregation based on the interaction of ethnicity and family earnings. earnings have a significant (p < 0.001), independent effect on homeownership above and beyond ethnicity. However, the mag- nitude of the coefficient is quite small (β = 0.0039), indicating that every $10,000 increase in family earnings is associated with an increase in the level of self-segregation regardless of one’s ethnic affiliation. However, this finding should be taken as tentative—its larger implication is that large amounts of in- come are assoc iated with in cremen tal in creas es in self-s egreg ation . Model 3 adds the demographic and sociodemographic char- acteristics to Model 2. Adding these characteristics in the model creates a significant Cuban effect on self-segregation. That is, Cubans score on average 0.27 points higher on self-segregation compared to Mexicans net of demographic and sociodemo- graphic correlates. That is, controlling for region of residence (net of family earnings) set Mexicans apart from Cubans in the extent of self-segregation. This result is expected, as the con- trast category for region is south, which as discussed earlier is where Cubans primarily reside. Other ethnicities maintain their significance and magnitude, indicating that all ethnicities, rela- tive to Mexicans, are self-segregated. In Model 3 only four of the additional variables are signify- cant. Age and immigrati on status are positively associated with self-segregation. Also, region of residence and being born in the US are both negatively associated with self-segregation. Further research should look at how these variables are uniquely related to the enclave context. Model 4 adds interaction terms in order to assess where fam- ily earnings illuminate ethnic-specific differences in self-segre- gation. However, the only significant moderator effect between family income and ethnicity on self-segregation is regarding Puerto Ricans. Figure 3, which is the graphical depiction of the interaction effect, illuminates an interesting finding—at low levels of family earnings, Puerto Ricans tend to self-segregate more than Mexicans. However, at high levels of family earnings Puerto Ricans tend not to self-segregate as much. This result speaks to the utility of the enclave in the economic accultura- tion process. Puerto Ricans are more likely to migrate with low savings and income (Massey & Sana, 2003), and thus, they use the informal networks and the enclave to catapult themselves in to a higher SES standing (via family income) to thus move in more integrated areas. Discussion The current study was conducted to evaluate the effective- ness of income in attenuating the ethnic difference in home- ownership and residential assorti ng among Latinos in the United States. The ethnic differences in income were hypothesized to impact the ethnic differences i n both who owns a home and how Figure 3. Predicted self-segregation indexscore based on the interaction of ethnic- ity and family earnings. 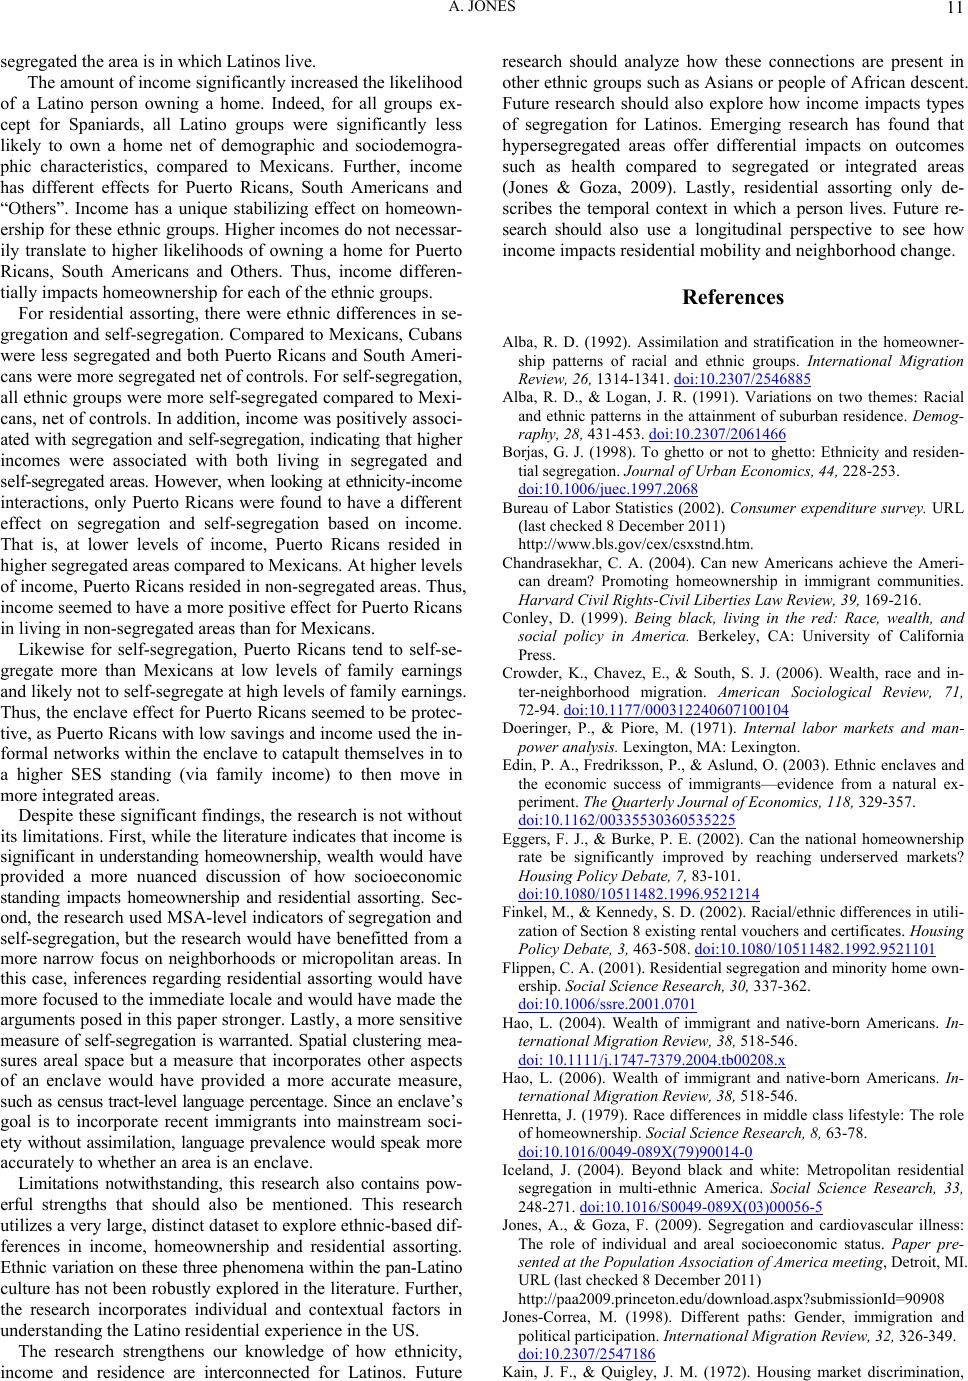 A. JONES 11 segregated the area is in which Latinos liv e. The amount of income significantly increased the likelihood of a Latino person owning a home. Indeed, for all groups ex- cept for Spaniards, all Latino groups were significantly less likely to own a home net of demographic and sociodemogra- phic characteristics, compared to Mexicans. Further, income has different effects for Puerto Ricans, South Americans and “Others”. Income has a unique stabilizing effect on homeown- ership for these ethnic groups. Higher incomes do not necessar- ily translate to higher likelihoods of owning a home for Puerto Ricans, South Americans and Others. Thus, income differen- tially impacts homeownership for each of the ethnic groups. For residential assorting, there were ethnic differences in se- gregation and self-segregation. Compared to Mexicans, Cubans were less segregated and both Puerto Ricans and South Ameri- cans were more segregated net of controls. For self-segregation, all ethnic groups were more self-segregated compared to Mexi- cans, net of controls. In addition, income was positively associ- ated with segregation and self-se gregation, indicating that higher incomes were associated with both living in segregated and se lf-segregated areas. However, whe n looking at ethnicity -income interactions, only Puerto Ricans were found to have a different effect on segregation and self-segregation based on income. That is, at lower levels of income, Puerto Ricans resided in higher segregated areas compared to Mexicans. At higher levels of income, Puerto Ricans resided in non-segregated areas. Thus, income seemed to have a more positive effect for Puerto Ricans in living in non-segregated areas than for Mexicans. Likewise for self-segregation, Puerto Ricans tend to self-se- gregate more than Mexicans at low levels of family earnings and likely not to self-segregate at high levels of family earnings. Thus, the enclave effect for Puerto Ricans seemed to be protec- tive, as Puerto Ricans with low savings and income used the in- formal networks within the enclave to catapult themselves in to a higher SES standing (via family income) to then move in more integrated areas. Despite these significant findings, the research is not without its limitations. First, while the literature indicates that income is significant in understanding homeownership, wealth would have provided a more nuanced discussion of how socioeconomic standing impacts homeownership and residential assorting. Sec- ond, the research used MSA-level indicators of segregation and self-segregation, but the research would have benefitted from a more narrow focus on neighborhoods or micropolitan areas. In this case, inferences regarding residential assorting would have more focused to the immediate locale and would have made the arguments posed in this paper stronger. Lastly, a more sensitive measure of self-segregation is warranted. Spatial clustering mea- sures areal space but a measure that incorporates other aspects of an enclave would have provided a more accurate measure, such as census tract-level language percentage. Since an enclave’s goal is to incorporate recent immigrants into mainstream soci- ety without assi milation, language prevalence would speak more accurately to whether an area is an enclave. Limitations notwithstanding, this research also contains pow- erful strengths that should also be mentioned. This research utilizes a very large, distinct dataset to explore ethnic-based dif- ferences in income, homeownership and residential assorting. Et hnic variation on these three phenomena within the pan-Latino culture has not been robustly explored in the literature. Further, the research incorporates individual and contextual factors in understanding the Latino residential experience in the US. The research strengthens our knowledge of how ethnicity, income and residence are interconnected for Latinos. Future research should analyze how these connections are present in other ethnic groups such as Asians or people of African descent. Future research should also explore how income impacts types of segregation for Latinos. Emerging research has found that hypersegregated areas offer differential impacts on outcomes such as health compared to segregated or integrated areas (Jones & Goza, 2009). Lastly, residential assorting only de- scribes the temporal context in which a person lives. Future re- search should also use a longitudinal perspective to see how income impacts residential mobility and neighborhood change. References Alba, R. D. (1992). Assimilation and stratification in the homeowner- ship patterns of racial and ethnic groups. International Migration Review, 26, 1314-1341. doi:10.2307/2546885 Alba, R. D., & Logan, J. R. (1991). Variations on two themes: Racial and ethnic patterns in the attainment of suburban residence. Demog- raphy, 28, 431-453. doi:10.2307/2061466 Borjas, G. J. (1998). To ghetto or not to ghetto: Ethnicity and residen- tial segregation. Journal of Urban Economics, 44, 228-253. doi:10.1006/juec.1997.2068 Bureau of Labor Statistics (2002). Consumer expenditure survey. URL (last checked 8 December 201 1) http://www.bls.gov/cex/csxstnd.htm. Chandrasekhar, C. A. (2004). Can new Americans achieve the Ameri- can dream? Promoting homeownership in immigrant communities. Harvard Civil Rights-Civil Liberties Law Review, 39, 169-216. Conley, D. (1999). Being black, living in the red: Race, wealth, and social policy in America. Berkeley, CA: University of California Press. Crowder, K., Chavez, E., & South, S. J. (2006). Wealth, race and in- ter-neighborhood migration. American Sociological Review, 71, 72-94. doi:10.1177/000312240607100104 Doeringer, P., & Piore, M. (1971). Internal labor markets and man- power analysis. Lexingto n, MA: Lexington. Edin, P. A., Fredriksson, P., & Aslund, O. (2003). Ethnic enclaves and the economic success of immigrants—evidence from a natural ex- periment. The Quarterly Journal of Economics, 118, 329-357. doi:10.1162/00335530360535225 Eggers, F. J., & Burke, P. E. (2002). Can the national homeownership rate be significantly improved by reaching underserved markets? Housing Policy Debate, 7, 83-101. doi:10.1080/10511482.1996.9521214 Finkel, M., & Kennedy, S. D. (2002). Racial/ethnic differences in utili- zation of Section 8 existing rental vouchers and certificates. Housing Policy Debate, 3, 463-508. doi:10.1080/10511482.1992.9521101 Flippen, C. A. (2001). Residential segregation and minority home own- ership. Social Science Research, 30, 337-362. doi:10.1006/ssre.2001.0701 Hao, L. (2004). Wealth of immigrant and native-born Americans. In- ternational Migration Review, 38, 518-546. doi: 10.1111/j.1747-7379.2004.tb00208.x Hao, L. (2006). Wealth of immigrant and native-born Americans. In- ternational Migration Review, 38, 518-546. Henretta, J. (1979). Race differences in middle class lifestyle: The role of homeownership. Social Science Research, 8, 63-78. doi:10.1016/0049-089X(79)90014-0 Iceland, J. (2004). Beyond black and white: Metropolitan residential segregation in multi-ethnic America. Social Science Research, 33, 248-271. doi:10.1016/S0049-089X(03)00056-5 Jones, A., & Goza, F. (2009). Segregation and cardiovascular illness: The role of individual and areal socioeconomic status. Paper pre- sented at the Population Association of America meeting, Detroit, MI. URL (last checked 8 December 2011) http://paa2009.princeton.edu/download.aspx?submissionId=90908 Jones-Correa, M. (1998). Different paths: Gender, immigration and political participation. International Migration Review, 32, 326-349. doi:10.2307/2547186 Kain, J. F., & Quigley, J. M. (1972). Housing market discrimination,  A. JONES 12 homeownership and savings behavior. American Economic Review, 72, 263-277. Keister, L. A. (2000). Wealth in America. Cambridge, UK: Cambridge University Press. doi:10.1017/CBO9780511625503 Kochhar, R., Gonzalez-Barrera A., & Dockterman, D. (2009). Through boom and bust: Minorities, immigrants and homeownership. Pew Hispanic Center Report. URL (last checked December 8, 2011) www.pewhispanic.org/files/reports/109.pdf. Krivo, L. J. (1995). Immigrant characteristics and Hispanic-Anglo housing inequality. Demography, 32, 599-615. doi:10.2307/2061677 Lieberson, S. (1980). A piece of the pie: Blacks and white immigrants since 1880. Berkeley, CA: University of California Press. Massey, D. S., & Denton, N. A. (1989). Hypersegregation in US met- ropolitan areas: Black and Hispanic segregation along five dimen- sions. Demography, 26, 373-391. doi:10.2307/2061599 Massey, D. S., & Denton, N. A. (1993). American apartheid: Segrega- tion and the making of the underclass. Cambridge, MA: Harvard University Press. Massey, D. S., & Sana, M. (2003). Patterns of US migration from Mexico, the Caribbean, and Central America. Migraciones Interna- cionales, 2, 5-39. McConnell, E. D., & Marcelli, E. A. (2007). Buying into the American dream? Mexican immigrants, legal status and homeownership in Los Angeles county. Social Science Quarterly, 88, 199-221. doi:10.1111/j.1540-6237.2007.00454.x Oliver, M. L., & Shapiro T. (1995). Black wealth/white wealth: A new perspective on racial inequality. New York, NY: Rout ledge. Painter, G., Gabriel, S., & Myers, D. (2001). Race, immigrant status and housing tenure choice. Journal of Urban Economics, 49, 150- 167. doi:10.1006/juec.2000.2188 Portes, A., & Rumbaut R. G. (1996). Immigrant America: A portrait (2nd ed.). Los Angeles, CA : U ni v ersity of California Press. Ratner, M. S. (2002). Many routes of homeownership: A four-site ethnographic study of minority and immigrant experiences. Housing Policy Debate, 7, 103-145. doi:10.1080/10511482.1996.9521215 Reskin, B., & Roos P. (1990). Job queues, gender queues: Explaining women’s inroads into male occupations. Philadelphia, PA: Temple University Press. Rosenbaum, E. (1992). Race and ethnicity in housing: Turnover in New York City, 1978-1987. Demography, 29, 467-486. doi:10.2307/2061829 Saiz, A. (2003). Room in the kitchen for the melting pot: Immigration and rental prices. The Review of Economics and Statistics, 85, 502-521. doi:10.1162/003465303322369687 Skaburskis, A. (1996). Race and tenure in Toronto. Urban Studies, 33, 223-252. doi:10.1080/00420989650011988 Smith, J. P. (1995). Racial and ethnic differences in wealth in the Health and Retirement Study. Journal of Human Resources, 30, S159-S183. doi:10.2307/146282 South, S. J., Crowder, K., & Chavez, E. (2005). Migration and spatial assimilation among US Latinos: Classical versus segmented trajecto- ries. Demography, 42, 497-521. doi:10.1353/dem.2005.0025 Spilerman, S. (2000). Wealth and stratification processes. Annual Re- view of Sociology, 26, 497-524. doi:10.1146/annurev.soc.26.1.497 Thernstrom, S., & Thernstrom, A. (1997). America in black and white: One nation, indivisible. New York: S imon and Schuster. US Census Bureau (2010). Housing vacancies and homeownership annual statistics. URL (last checked 8 December 2011) http://www.census.gov/hhes/www/housing/hvs/annual10/ann10ind.ht ml. Walker, R. T., Solecki, W. D., & Harwell, C. (1997). Land use dynam- ics and ecological transition: The case of south Florida. Urban Eco- systems, 1, 37-47. doi:10.1023/A:1014311116523 Wilkes, R., & Iceland, J. (2004). Hypersegregation in the twenty-first century. Demography, 41, 23-36. doi:10.1353/dem.2004.0009 Williams, R. A., Nesiba, R., & McConnell, E. D. (2005). The changing face of inequality in home mortgage lending. Social Problems, 52, 181-208. doi:10.1525/sp.2005.52.2.181 Wolff, E. N. (1998). Recent trends in the size distribution of household wealth. Journal of Economic Prospective, 12, 131-150. doi:10.1257/jep.12.3.131 Wu, W., Lien, H, & Lin, C. (2004). Housing and educational attain- ments of children. Department of Economics, National Chengchi University, unpublished manuscript. URL (last checked 8 December 2011) http://www.rst.nus.edu.sg/ r e search/symposium_files/j.wu.pdf.
|