 Open Journal of Nephrology, 2011, 1, 5-14 doi:10.4236/ojneph.2011.12002 Published Online December 2011 (http://www.SciRP.org/journal/ojneph) Copyright © 2011 SciRes. OJNeph The Effect of Glucose Added to the Dialysis Fluid on Blood Pressure, Vasoactive Hormones and Energy Transfer during Hemodialysis in Chronic Renal Failure —An Analysis of Changes in Blood Pressure and Plasma Concentration of Renin, Angiotensin II, Endothelin, Insulin, Glucagon and Growth Hormone Erling B. Pedersen*, Birte Ardal, Jesper N. Bech, Thomas G. Lauridsen, Niels A. Larsen, Lisbeth Mikkelsen, Maren Sangill, Ingrid M. Thomsen Department of Medical Research and Department of Medicine, Holstebro Hospital and University of Aarhus, Aarhus, Denmark E-mail: *ebp@dadlnet.dk Received November 3, 2011; revised November 22, 2011; accepted December 8, 2011 Abstract Background: Previous studies showed that blood pressure was reduced in patients with chronic renal failure during hemodialysis with glucose added to the dialysis fluid. We wanted to test the hypotheses that blood pressure is reduced in non-diabetic and diabetic dialysis patients, when glucose is added to the dialysis fluid, and that blood pressure changes are caused by changes in plasma concentrations of vasoactive hormones or to vasodilation secondary to an increase in body temperature. Methods: The effect of dialysis with glucose added to the dialysis fluid was measured in three randomized, placebo-controlled, un-blinded and cross-over studies with periods of one week duration. In non-diabetic nephropathy (Study 1, n = 19) and diabetic neph- ropathy (Study 2, n = 15), we measured blood pressure (BP) and pulse rate (PR), plasma concentrations of glucose (p-Glucose), renin (PRC), angiotensin II (p-AngII), endothelin (p-Endot), insulin (p-Ins), glucagon (p-Glu), and human growth hormone (p-hGH). In non-diabetic nephropathy (Study 3, n = 24), we measured the effect of dialysis with glucose added to the dialysis fluid on energy transport from form the body using body temperature control. Results: Study 1 and 2 showed that BP, PRC, p-AngII, and p-Ins were unchanged, whereas P-Endot increased and P-hGH decreased, in dialysis patients with or without glucose added to the dialysis fluid. In diabetics, a marginal increase in p-Glu was measured during dialysis with glucose, but not without glucose. Study 3 showed that SBP increased significantly using dialysis with temperature control of dialysis fluid compared with no temperature control (145 versus 138 mm Hg). In parallel with the increase in SBP, the energy flux from the patients was significantly higher with temperature control than without. Con- clusion: In non-diabetics and diabetics, blood pressure was unchanged during dialysis with glucose added to the dialysis fluid in a short-term study. Vasoactive hormones in plasma were changed in the same way inde- pendently of glucose in the dialysis fluid. Systolic blood pressure increased using dialysis with temperature control of dialysis fluid, presumably due to vasoconstriction to prevent or antagonize a fall in body tempera- ture. Keywords: Angiotensin, Blood Pressure, Chronic Renal Failure, Diabetes, Dialysis, Dialysis Fluid, Endothelin, Glucagon, Growth Hormone, Hemodialysis, Insulin, Renin 1. Introduction Patients with chronic renal failure often have such ad- verse reactions as fatigue, headache, disorientation and malaise during and in the hours after a dialysis session. This can be due to manifest or undiagnosed hypoglycae- mia [1,2], since 15 g - 30 g of glucose is removed during a dialysis session [3-6]. Hypoglycaemia can be preven ted or the incidence can be decreased by addition of glucose to the dialysis fluid [4-6], and the occurrence of head- ache and fatigue is reduced [5,7,8]. However, in some studies dialysis patients do not become hypoglycaemic  E. B. PEDERSEN ET AL. 6 during treatment with glucose-free dialyses fluid [5,9]. Previously, we have performed a randomized, placebo controlled, un-blinded, cross-over study of haemodialysis patients, who were allocated to treatment with and with- out glucose in the dialysis fluid during two 10 weeks pe- riods [10 ]. We found that blood pr essure was r educed when glucose was added to the dialysis fluid, but the underly- ing mechanism for the blood pressure reduction was not clarified. Plasma insulin increases, when the glucose concentra- tion in the dialysis fluid exceeds pre-dialysis concentra- tion of blood glucose [5,9]. An increase in plasma insulin within the physiological range resu lts in vasodilatatio n in both animals and man [11,12]. A fall in blood pressure will be antagonized by a reflex mediated increased in the sympathetic adrenergic activity. In our previous study the pulse rate was unchanged, although blood glucose increased. Thus, the explanation seems to be more complex, partly because patients with chronic renal failure have some degree of insulin resistance, and consequently also of in- sulin induced vasodilat ation [1 3], and partly due to the fact that the response to pressure factors/hormones generally is decreased in chronic renal failure. An alternative ex- planation of the blood pressure reduction could be an in- crease in metabolism due to the glucose load and subse- quently an increase in body temperature, vasodilatation and fall in blood pressure. New knowledge regarding the pathophysiological me- chanism during dialysis treatment with glucose added to the dialysis fluid may have consequences for future clini- cal practice in treatment of patients with chronic renal failure. We wanted to test the hypotheses that blood pressure is reduced in non-diabetic and diabetic dialysis patients, when glucose is added to the dialysis fluid, that blood pressure changes can be attributed to changes in plasma concentrations of vasoactive hormones (renin, angioten- sin II, endothelin, insulin, glucagon and human growth hormone), and that blood pressure changes are related to an increased glucose metabolism with an increase in body temperature and subsequently vasodilatation when glu- cose is added to dialysis fluid. The purpose was to measure the effect of dialysis with glucose added to the dialysis fluid in three randomized, placebo-controlled, un-blinded and cross-over studies. In Study 1 of dialysis patients with non-diabetic nephropa- thy, we measured 1) Blood pressure (BP) and pulse rate (PR), 2) Plasma concentration of glucose (p-Glucose), 3) Plasma concentrations of renin (PRC), angiotensin II (p- AngII), and Endothelin (p-Endot), 4) Plasma concentra- tions of insulin (p-Ins), glucagon (p-Glu), human growth hormone (p-hGH), and 5) Energy transport from the body. In Study 2 of dialysis patients with diabetic nephr opathy, we measured the same effect variables as in Study 1. In Stu dy 3 of dialysis patients with non-diabetic nephropathy, we measured the effect of dialysis with glucose added to the dialysis fluid on energy transport from form the body using body temperature control. 2. Material and Methods 2.1. Design All three studies were randomized, placebo-controlled, un- blinded, and cross-over. During the active treatment pe- riod, patients received treatment with hemodialysis with glucose added to the dialysis fluid. During the placebo period, patients received treatment without glucose added to the dialysis fluid. Each study was of 4 weeks duration. Week 1was a “run-in” period, and week 3 was a “wash-out” period. During weeks 2 and 4, patients received dialysis treatment with dialysis with and without glucose added to the dialysis fluid after randomization. 2.2. Ethical Aspects The studies were approved by the local Ethics Commit- tee and Danish Data Protection Agency. The study was done according to the rules given in Good Clinical Prac- tice. The three studies were registered in ClinicalTrials. gov Protocol Registration System under the numbers: NCT 00438295, NCT 00438503, and NCT 00439023. 2.3. Patients Group 1: Non-diabetic nephropathy Inclusion criteria: Age > 18 years, both men and wo men, and chronic renal failure treated with haemodialysis for more than 3 months. Exclusion criteria: Heart failure, lung insufficiency, liver disease, diabetes mellitus, other endocrine diseases than dia- betes mellitus not sufficiently treated, malignant disease, nephrotic syndrome, treatment with haemodiafiltration, other diseases or conditions which implied that a patient could not participate, and unwillingness to participate. Withdrawal criteria: Development of one of the exclu- sion criteria, changes in dialysis treatm ent during the study period, and kidney transplantation. Group 2: Diabetic nephropathy The inclusion, exclusion and withdrawal criteria were as in group 1 except that diabetes mellitus was added as an inclusion criterion and removed as exclusion criterion. 2.4. Recruitment All patients were recruited amo ng dialysis patients in the Copyright © 2011 SciRes. OJNeph 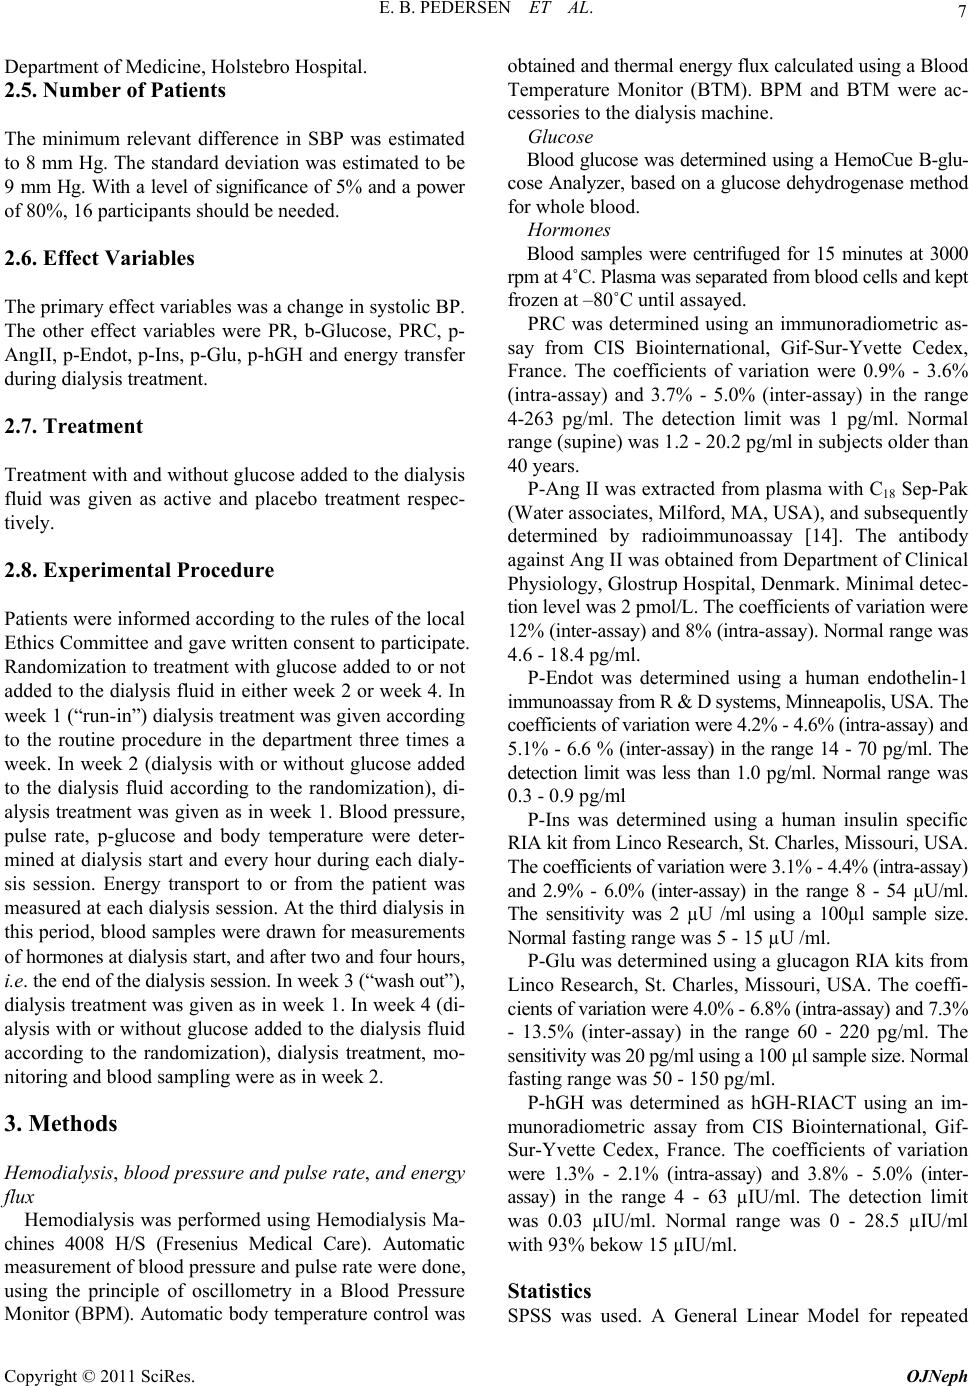 7 E. B. PEDERSEN ET AL. Departm e nt of Medicine, Holste br o Hospital. 2.5. Number of Patients The minimum relevant difference in SBP was estimated to 8 mm Hg. The standard deviation was estimated to be 9 mm Hg. With a level of significance of 5% and a pow er of 80%, 16 participants should be need ed. 2.6. Effect Variables The primary effect variables was a change in systolic BP. The other effect variables were PR, b-Glucose, PRC, p- AngII, p-En dot, p-Ins, p-Glu, p-hGH and energ y transfer during dialy si s treatment. 2.7. Treatment Treatment with and without glucose added to the dialysis fluid was given as active and placebo treatment respec- tively. 2.8. Experimental Procedure Patients were informed according to the rules of the local Ethics Committee and gave written con sent to participate. Randomization to treatment with glucose added to or not added to the dialysis fluid in either week 2 or week 4. In week 1 (“run-in”) dialysis treatment was given acco rding to the routine procedure in the department three times a week. In week 2 (dialysis with or without glucose added to the dialysis fluid according to the randomization), di- alysis treatment was given as in week 1. Blood pressure, pulse rate, p-glucose and body temperature were deter- mined at dialysis start and every hour during each dialy- sis session. Energy transport to or from the patient was measured at each dialysis session. At the third dialysis in this period, blood samples were dr awn for measurements of hormones at dialysis start, and after two and four hours, i.e. the end of the dialysis session. In week 3 (“wash out”), dialysis treatment was given as in week 1. In week 4 (di- alysis with or without glucose added to the dialysis fluid according to the randomization), dialysis treatment, mo- nitoring and blood sampling were as in week 2. 3. Methods Hemodialysis, blood pressure and pulse rate, and energy flux Hemodialysis was performed using Hemodialysis Ma- chines 4008 H/S (Fresenius Medical Care). Automatic measurement of blood pressure and pulse rate were done, using the principle of oscillometry in a Blood Pressure Monitor (BPM). Automatic b ody temperature control was ob tained and thermal energy flux calculated using a Blood Temperature Monitor (BTM). BPM and BTM were ac- cessories to the dialysis machine. Glucose Blood glucose was determined using a HemoCue B-glu- cose Analyzer, based on a glucose dehydrogenase method for whole blo o d. Hormones Blood samples were centrifuged for 15 minutes at 3000 rpm at 4 ˚C. Plasma was separated from blood cells and kept frozen at –80˚C until assayed. PRC was determined using an immunoradiometric as- say from CIS Biointernational, Gif-Sur-Yvette Cedex, France. The coefficients of variation were 0.9% - 3.6% (intra-assay) and 3.7% - 5.0% (inter-assay) in the range 4-263 pg/ml. The detection limit was 1 pg/ml. Normal range (supine) was 1.2 - 20.2 pg/ml in subjects older than 40 years. P-Ang II was extracted from plasma with C18 Sep-Pak (Water associates, Milford, MA, USA), and subsequently determined by radioimmunoassay [14]. The antibody against Ang II was obtained from Department of Clinical Physiology, Glostrup Hospital, Denmark. Minimal detec- tion level was 2 pmol/L. The coefficients of vari ati on were 12% (inter-assay) and 8% (intra-assay). Normal range was 4.6 - 18.4 pg/ml. P-Endot was determined using a human endothelin-1 immunoassay from R & D syst ems, Mi nneapolis, USA. T he coefficients of variation were 4.2% - 4.6% (intra-assay) and 5.1% - 6.6 % (inter-assay) in the range 14 - 70 pg/ml. The detection limit was less than 1.0 pg/ml. Normal range w as 0.3 - 0.9 pg/ml P-Ins was determined using a human insulin specific RIA kit from Linco Research, St. Charles, Missouri, USA. The coefficients of variation were 3.1% - 4.4% (intra-assay) and 2.9% - 6.0% (inter-assay) in the range 8 - 54 µU/ml. The sensitivity was 2 µU /ml using a 100µl sample size. Normal fasting range was 5 - 15 µU /ml. P-Glu was determined using a glucagon RIA kits from Linco Research, St. Charles, Missouri, USA. The coeffi- cien ts of variation were 4.0% - 6.8% ( intra-assay) and 7.3 % - 13.5% (inter-assay) in the range 60 - 220 pg/ml. The sensitivity was 20 pg/ml using a 100 µl sample size. Normal fasting range was 50 - 150 pg/ml. P-hGH was determined as hGH-RIACT using an im- munoradiometric assay from CIS Biointernational, Gif- Sur-Yvette Cedex, France. The coefficients of variation were 1.3% - 2.1% (intra-assay) and 3.8% - 5.0% (inter- assay) in the range 4 - 63 µIU/ml. The detection limit was 0.03 µIU/ml. Normal range was 0 - 28.5 µIU/ml with 93% beko w 15 µIU/ml. Statistics SPSS was used. A General Linear Model for repeated Copyright © 2011 SciRes. OJNeph 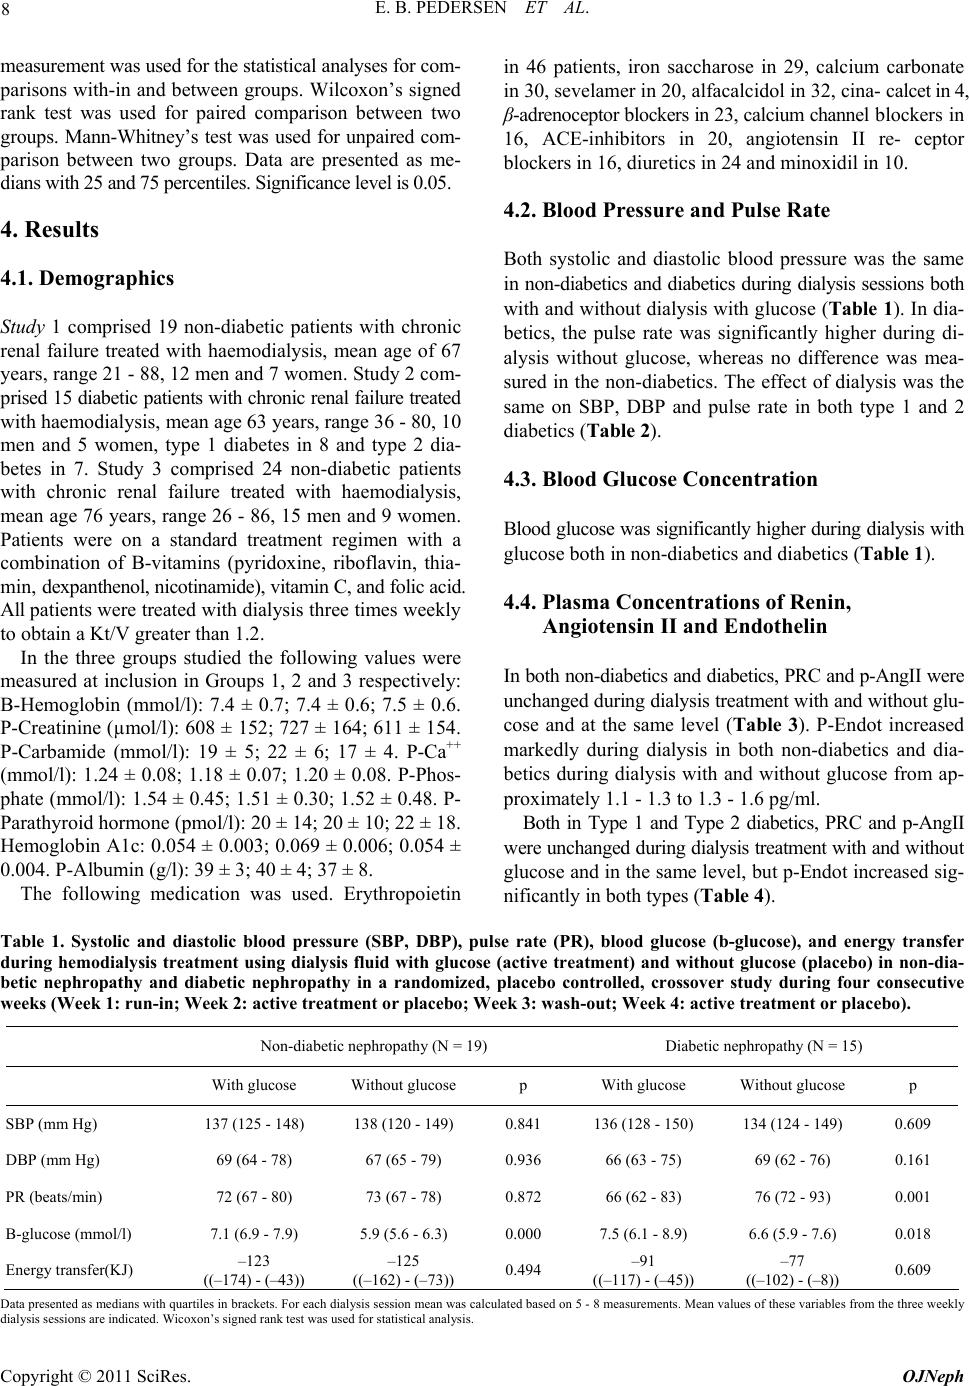 E. B. PEDERSEN ET AL. Copyright © 2011 SciRes. OJNeph 8 measurement was used for the statistica l analys es for com- parisons with- in and between grou ps. Wilcoxon’s signed rank test was used for paired comparison between two groups. Mann-Whitney’s test was used for unpaired com- parison between two groups. Data are presented as me- dians with 25 and 75 percentiles. Significance level is 0.05. 4. Results 4.1. Demographics Study 1 comprised 19 non-diabetic patients with chronic renal failure treated with haemodialysis, mean age of 67 years, range 21 - 88, 12 men and 7 women. Study 2 com- prised 15 diab etic patients with chronic renal failure treated with haemodialysis, mean age 63 years, range 36 - 80, 10 men and 5 women, type 1 diabetes in 8 and type 2 dia- betes in 7. Study 3 comprised 24 non-diabetic patients with chronic renal failure treated with haemodialysis, mean age 76 years, range 26 - 86, 15 men and 9 women. Patients were on a standard treatment regimen with a combination of B-vitamins (pyridoxine, riboflavin, thia- mi n, dexpanthenol, nicotinamide), vitamin C, and folic acid. All patients were treated with dialysis three times weekly to obtain a Kt/V greater than 1.2. In the three groups studied the following values were measured at inclusion in Groups 1, 2 and 3 respectively: B-Hemoglobin (mmol/l): 7.4 ± 0.7; 7.4 ± 0.6; 7.5 ± 0.6. P-Creatinine (µmol/l): 608 ± 152; 727 ± 164; 611 ± 154. P-Carbamide (mmol/l): 19 ± 5; 22 ± 6; 17 ± 4. P-Ca++ (mmol/l): 1.24 ± 0.08; 1.18 ± 0.07; 1.20 ± 0.08. P-Phos- phate (mmol/l): 1.54 ± 0.45; 1.51 ± 0 .30; 1.52 ± 0.48. P- Parathyroid hormone (pmol/l): 20 ± 14; 20 ± 10; 22 ± 18. Hemoglobin A1c: 0.054 ± 0.003; 0.069 ± 0.006; 0.054 ± 0.004. P-Albumin (g/l): 39 ± 3; 40 ± 4; 37 ± 8. The following medication was used. Erythropoietin in 46 patients, iron saccharose in 29, calcium carbonate in 30, sevelamer in 20, alfacalcidol in 32, cina- calcet in 4, β-adrenoceptor blockers in 23, calcium channel b l o ck e r s in 16, ACE-inhibitors in 20, angiotensin II re- ceptor blockers in 16, diuretics in 24 and minoxidil in 10. 4.2. Blood Pressure and Pulse Rate Both systolic and diastolic blood pressure was the same in non-diabetics and diabetics during dialysis sessions both with and withou t dialysis with glucose ( Table 1). In dia- betics, the pulse rate was significantly higher during di- alysis without glucose, whereas no difference was mea- sured in the non-diabetics. The effect of dialysis was the same on SBP, DBP and pulse rate in both type 1 and 2 diabetics (Table 2). 4.3. Blood Glucose Concentration Blood glucose was significantly higher dur ing dialysis with glucose both in non-diabetics and diabetics (Table 1). 4.4. Plasma Concentrations of Renin, Angiotensin II and Endothelin In bo th non-diabetics and diabetics, PRC and p-AngII were unchanged during dialysis treatment with and without glu- cose and at the same level (Table 3). P-Endot increased markedly during dialysis in both non-diabetics and dia- betics during dialysis with and without glucose from ap- proximately 1.1 - 1.3 to 1.3 - 1.6 pg/ml. Both in Type 1 and Type 2 diabetics, PRC and p-AngII were un changed during dialysis treatment with and withou t glucose and in the same level, but p-Endot increased sig- nificantly in both types (Table 4). Table 1. Systolic and diastolic blood pressure (SBP, DBP), pulse rate (PR), blood glucose (b-glucose), and energy transfer during hemodialysis treatment using dialysis fluid with glucose (active treatment) and without glucose (placebo) in non-dia- betic nephropathy and diabetic nephropathy in a randomized, placebo controlled, crossover study during four consecutive weeks (Week 1: run-in; Week 2: active treatment or placebo; Week 3: wash-out; Week 4: active treatment or placebo). Non-diabetic nephropathy (N = 19) Diabetic nephropathy (N = 15) With glucose Without glucose p With glucose With o u t glucose p SBP (mm Hg) 137 (125 - 148) 138 (120 - 149) 0.841 136 (128 - 150) 134 (124 - 149) 0.609 DBP (mm Hg) 69 (64 - 78) 67 (65 - 79) 0.936 66 (63 - 75) 69 (62 - 76) 0.161 PR (beats/min) 72 (67 - 80) 73 (67 - 78) 0.872 66 (62 - 83) 76 (72 - 93) 0.001 B-glucose (mmol/l) 7.1 (6.9 - 7.9) 5.9 (5.6 - 6.3) 0.000 7.5 (6.1 - 8.9) 6.6 (5.9 - 7.6) 0.018 Energy transfer(KJ) –123 ((–174) - (–43)) –125 ((–162) - (–73)) 0.494 –91 ((–117) - (–45)) –77 ((–102) - (–8)) 0.609 Data presented as medians with quartiles in brackets. For each dialysis session mean was calculated based on 5 - 8 measurements. Mean values of these variables from the three weekly dialysis sessions are indicated. Wicoxon’s signed rank test was used for statistical analysis. 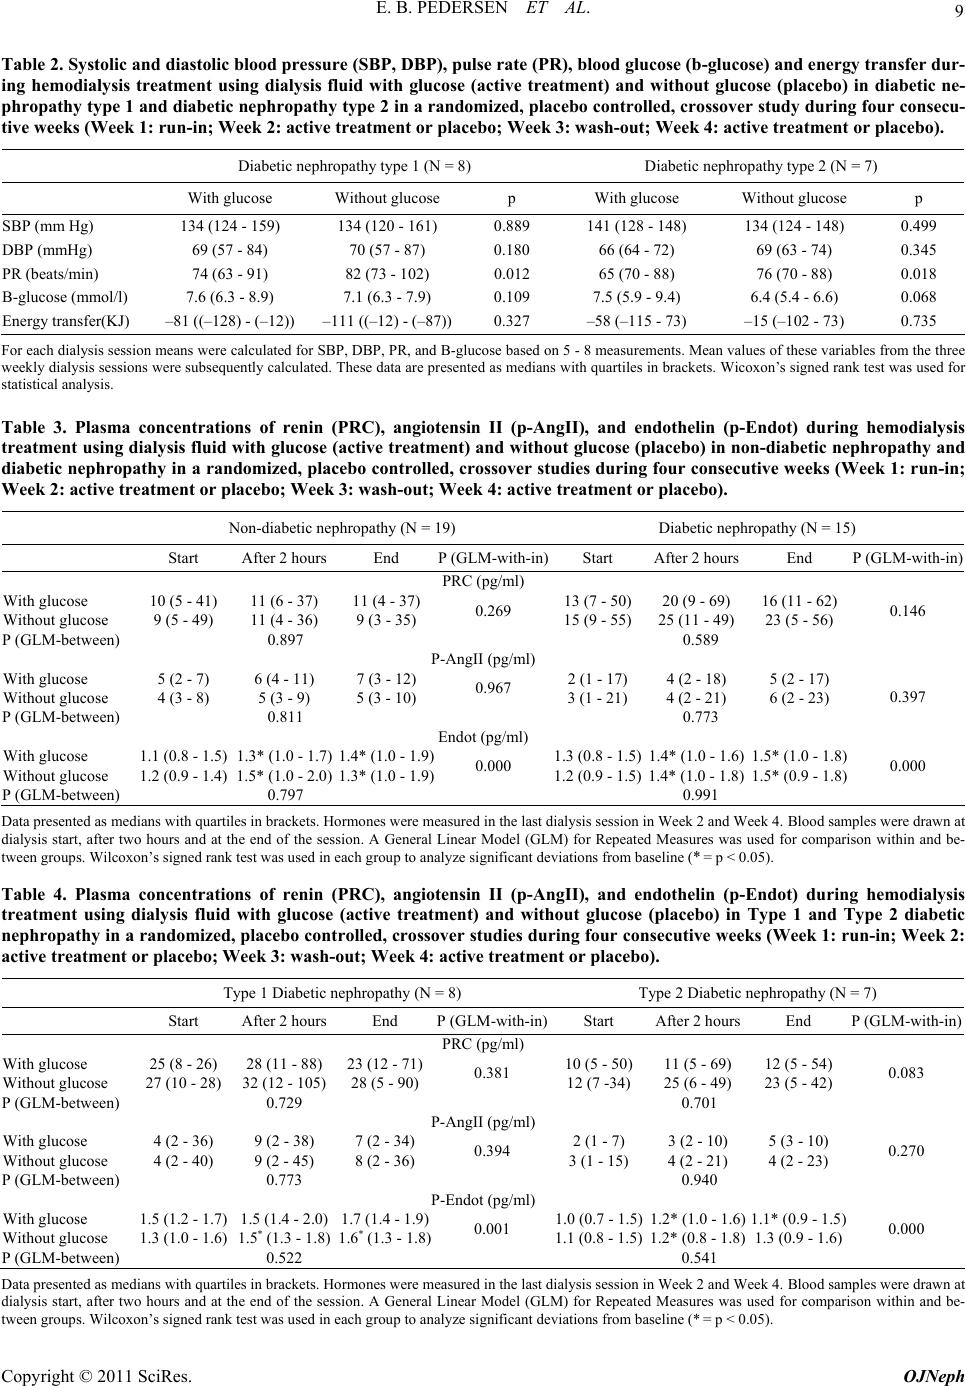 9 E. B. PEDERSEN ET AL. Table 2. Systolic and diastolic blood pressure (SBP, DBP), pulse rate (PR), blood glucose (b-glucose) and energy transfer dur- ing hemodialysis treatment using dialysis fluid with glucose (active treatment) and without glucose (placebo) in diabetic ne- phropathy type 1 and diabe tic nephropathy type 2 in a randomized, placebo controlled, crossover study during four consecu- tive weeks (Week 1: run-in; Week 2: active treatment or placebo; Week 3: wash-out; Week 4: active treatment or placebo). Diabetic nephropathy type 1 (N = 8) Diabetic nephropathy type 2 (N = 7) With glucose Without glucose p With glucose W i t hout glucose p SBP (mm Hg) 134 (124 - 159) 134 (120 - 161) 0. 889 141 (128 - 148) 134 (124 - 148) 0.499 DBP (mmHg) 69 (57 - 84) 70 (57 - 87) 0.180 66 (64 - 72) 69 (63 - 74) 0.345 PR (beats/min) 74 (63 - 91) 82 (73 - 102) 0.012 65 ( 70 - 88) 76 (70 - 88) 0.018 B-glucose (mmol/l) 7.6 (6.3 - 8.9) 7.1 (6.3 - 7.9) 0.109 7.5 (5.9 - 9.4) 6.4 (5.4 - 6.6) 0.068 Energy transfer (KJ) –81 ((–128) - (–12)) –111 ((–12) - (–87))0.327 –58 (–115 - 73) –15 (–102 - 73) 0.735 For each d ialysi s sessi on means wer e cal culated for SBP, DBP, P R, and B-g luco se bas ed on 5 - 8 measur ements . Mean valu es of these variables from the three weekly dialysis sessions were subsequently calculated. These data are presented as medians with quartiles in brackets. Wicoxon’s signed rank test was used for statistical analysis. Table 3. Plasma concentrations of renin (PRC), angiotensin II (p-AngII), and endothelin (p-Endot) during hemodialysis treatment using dialysis fluid with glucose (active treatment) and without glucose (placebo) in non-diabetic nephropathy and diabetic nephropathy in a randomized, placebo controlled, crossover studies during four consecutive weeks (Week 1: run-in; Week 2: active treatment or placebo; Week 3: wash-out; Week 4: active treatment or placebo). Non-diabetic ne p hropathy (N = 19) Diabetic nephropathy (N = 15) Start After 2 hours End P (GLM-with-in)Start After 2 hours End P (GLM-with-in) PRC (pg/ml) With glucose 10 (5 - 41) 11 (6 - 37) 11 (4 - 37)13 (7 - 50)20 (9 - 69) 16 (11 - 62) Without glucose 9 (5 - 49) 11 (4 - 36) 9 (3 - 35) 0.269 15 (9 - 55)25 (11 - 49) 23 (5 - 56) 0.146 P (GLM-between) 0.897 0.589 P-AngII (pg/ml) With glucose 5 (2 - 7) 6 (4 - 11) 7 (3 - 12) 2 (1 - 17) 4 (2 - 18) 5 (2 - 17) Without glucose 4 (3 - 8) 5 (3 - 9) 5 (3 - 10) 0.967 3 (1 - 21) 4 (2 - 21) 6 (2 - 23) 0.397 P (GLM-between) 0.811 0.773 Endot (pg/ml) With glucose 1.1 (0.8 - 1.5) 1. 3 * (1.0 - 1.7) 1.4* (1.0 - 1.9)1.3 (0.8 - 1. 5)1.4* (1.0 - 1. 6) 1.5* (1.0 - 1.8) Without glucose 1.2 (0.9 - 1.4) 1.5* (1.0 - 2.0 ) 1.3* (1.0 - 1. 9 )0.000 1.2 (0. 9 - 1.5)1.4* (1.0 - 1.8) 1.5* (0.9 - 1.8) 0.000 P (GLM-between) 0.797 0.991 Data presented as medians with quartiles in brackets. Hormones were measure d in the last dialysis session in Week 2 and Week 4. Blood samples were drawn at dialysis start, after two hours and at the end of the session. A General Linear Model (GLM) for Repeated Measures was used for comparison within and be- tween groups. Wilcoxon’s signed rank test was used in each group to analyze significant deviations from baseline (* = p < 0.05). Table 4. Plasma concentrations of renin (PRC), angiotensin II (p-AngII), and endothelin (p-Endot) during hemodialysis treatment using dialysis fluid with glucose (active treatment) and without glucose (placebo) in Type 1 and Type 2 diabetic nephropathy in a randomized, placebo controlled, crossover studies during four consecutive weeks (Week 1: run-in; Week 2: active treatment or placebo; Week 3: wash-out; Week 4: active treatment or placebo). Type 1 Diabetic nephropathy (N = 8) Ty p e 2 Diabetic n e p h ropathy (N = 7) Start After 2 hours End P (GLM-with-in)Start After 2 hours End P (GLM-with-in) PRC (pg/ml) With glucose 25 (8 - 26) 28 (11 - 88) 23 (12 - 71)10 (5 - 50)11 (5 - 69) 12 (5 - 54) Without glucose 27 (10 - 28) 32 (12 - 105) 28 (5 - 90)0.381 12 (7 -34)25 (6 - 49) 23 (5 - 42) 0.083 P (GLM-between) 0.729 0.701 P-AngII (pg/ml) With glucose 4 (2 - 36) 9 (2 - 38) 7 (2 - 34) 2 (1 - 7) 3 (2 - 10) 5 (3 - 10) Without glucose 4 (2 - 40) 9 (2 - 45) 8 (2 - 36) 0.394 3 (1 - 15) 4 (2 - 21) 4 (2 - 23) 0.270 P (GLM-between) 0.773 0.940 P-Endot (pg/ml) With glucose 1.5 (1.2 - 1 .7) 1.5 (1.4 - 2. 0) 1.7 (1.4 - 1.9)1.0 (0.7 - 1. 5)1.2* (1.0 - 1.6) 1.1* (0.9 - 1.5) Without glucose 1.3 (1.0 - 1.6) 1.5* ( 1.3 - 1.8) 1.6* (1.3 - 1.8)0.001 1.1 (0.8 - 1.5)1.2* (0.8 - 1.8) 1.3 (0.9 - 1.6) 0.000 P (GLM-between) 0.522 0.541 Data presented as medians with quartiles in brackets. Hormones were measure d in the last dialysis session in Week 2 and Week 4. Blood samples were drawn at dialysis start, after two hours and at the end of the session. A General Linear Model (GLM) for Repeated Measures was used for comparison within and be- tween groups. Wilcoxon’s signed rank test was used in each group to analyze significant deviations from baseline (* = p < 0.05). Copyright © 2011 SciRes. OJNeph  E. B. PEDERSEN ET AL. Copyright © 2011 SciRes. OJNeph 10 Comparison between Type 1 and Type 2 diabetics showed no significant differences in the level of PRC, p-AngII and p-Endot either during dialysis with or without glucose added to dialysis fluid, using a General Linear Model with parameter estimates (PRC: p = 0.803, p-AngII: p = 0.359, p-Endot: p = 0.09 2 ). 4.5. Plasma Concentrations of Insulin, Glucagon, and Human Growth Hormone Table 5 shows the results for non-di abet i c s and di abet i cs. Neither non-diabetics nor diabetics p-Ins was signify- cantly changed during dialysis eith er with or without g lu- cose. P-Glu was not significantly ch ang ed during dialysis with or without glucose in non-diabetics. In diabetics, a marginal increase was measured during dialysis with glucose, but not without glucose. P-hGH decreased sig- nificantly during dialysis both with and without glucose in both non-diabetics and d iabetics from a level around 3 - 4 µU/ml to 0.3 - 0.4 µU/ml after both 2 and 4 hours of dialysis (p < 0.00 0 f or b oth n on - di abet i cs a n d di abet ic s). Both in Type 1 and Type 2 diabetics, p-Ins and p-Glu wer e unchanged during dialysis treatment with and without glucose and at the same level, but p-hGH fell significantly in both types (Table 6). Comparison between Type 1 and Type 2 diabetics showed a significantly higher p-Ins in Type 1 compared with Type 2 diabetics during dialysis with or without glucose added to dialysis fluid, using a General Linear Model with pa- rameter estimates (Between Type 1 and 2: p = 0.011; pa- rameter estimates: at dialysis start: p = 0.092, after two hours dialysis: p = 0.040, and at the end of dialysis p = 0.016). P-Glu was lower in Type 1 than Type 2 diabetics dur- ing d ialysis with or without glucose added to dialysis fluid, using a the same analysis (Between Type 1 and 2: p = 0.018; parameter estimates: at dialysis start: p = 0.009 after two hours dialysis: p = 0.035, and at the end of dialysis p = 0.030). P-hGH was the same in Type 1 than Type 2 diabetics during dialysis with or without glucose added to dialysis fluid, using a the same analysis (Between Type 1 and 2: p = 0.177; parameter estimates: at dialysis start: p = 0.159 after two hours dialysis: p = 0.851, and at the end of di- alysis p = 0.130). 4.6. Energy Transfer during Dialysis Table 1 shows that the energy transfer was similar during dialysis in both non-diabetics (w ith glucose: –123 ((– 174) - (–43) KJ, and without glucose: –125 ((–163) - (–73) KJ), p = 0.494), and diabetic s (with glucose: –91 (–(117) - ( –91)) KJ , an d without: –77 ((– 102) - (–8) KJ), p = 0.609). How- ever, the energy transfer was significantly higher in dia- betics than non-diabetics du ring dialysis without glucos e, whereas no significant difference was measured between the two groups with glucose added to the dialysis fluid. 3.7. Effect of Temperature Control during Dialysis Using dialysis treatment with temperature control we aimed to keep the patient’s body temperature at the same level during the dialysis session. Systolic blood pressure was significantly higher and the energy loss more pronounced using dialysis with temperature control compared with dialysis without temperature control in a group of non- diabetics (Group 3) as indicated in Table 7. Both body Table 5. Plasma concentrations of insulin (p-Ins), glucagon (p-Glu), and human growth hormone (p-GH) during hemodialysis treatment using dialysis fluid with glucose (active treatment) and without glucose (placebo) in non-diabetic nephropathy and diabetic nephropathy in a randomized, placebo controlled, crossover study during four consecutive weeks (Week 1: run-in; Week 2: active treatment or placebo; Week 3: wash-out; Week 4: active treatment or placebo). Non-diabetic nephropathy (N = 19) Diabetic nephropathy (N = 15) Start After 2 hours End P (GLM-with-in) Start After 2 hours End P (GLM-with-in) P-Ins (µU/ml) With glucose 21 (9 - 34) 20 (13 - 43) 23 (16 - 35)27 (18 - 35)22 (16 - 55) 23 (14 - 64) Without glucose 16 (10 - 34 ) 11 (9 - 32) 15 (9 - 23) 0.430 31 (13 - 45)24 (16 - 40 ) 22 (14 - 35) 0.853 P (GLM-between) 0.083 0.972 P-Glu (pg/ml) With glucose 203 (159 - 256) 185 (141 - 363) 198 (122 - 364)154 (145 - 334)164 (106 - 275) 157* (101 - 256) Without glucose 211 (170 - 285) 212 (138 - 274) 254 (142 - 308)0.446 153 (124 - 249)126 (104 - 265) 146 (99 - 297) 0.048 P (GLM-between) 0.948 0.854 P-hGH (µIU/ml) With glucose 4.1 (2. 6 - 6.4) 0.3* (0.2 - 0. 7) 0.3* (0.1 - 1.2)3.8 (1.7 - 5. 5)0.3* (0.2 - 0. 8) 0.2* (0.1 - 0.4) Without glucose 2.6 (1.1 - 4. 9) 0.3* (0.2 - 0.6) 0.3* (0.1 - 0.5)0.000 1.8 (1.8 - 5.5)0.4* (0.2 - 1.1) 0.2* ( 0.1 - 0.6) 0.000 P (GLM-between) 0.104 0.742 Data presented as medians with quartiles in brackets. Hormones were measure d in the last dialysis session in Week 2 and Week 4. Blood samples were drawn at dialysis start, after two hours and at the end of the session. A General Linear Model (GLM) for Repeated Measures was used for comparison within and be- tween groups. Wilcoxon’s signed rank test was used in each group to analyze significant deviations from baseline (*= p < 0.05). 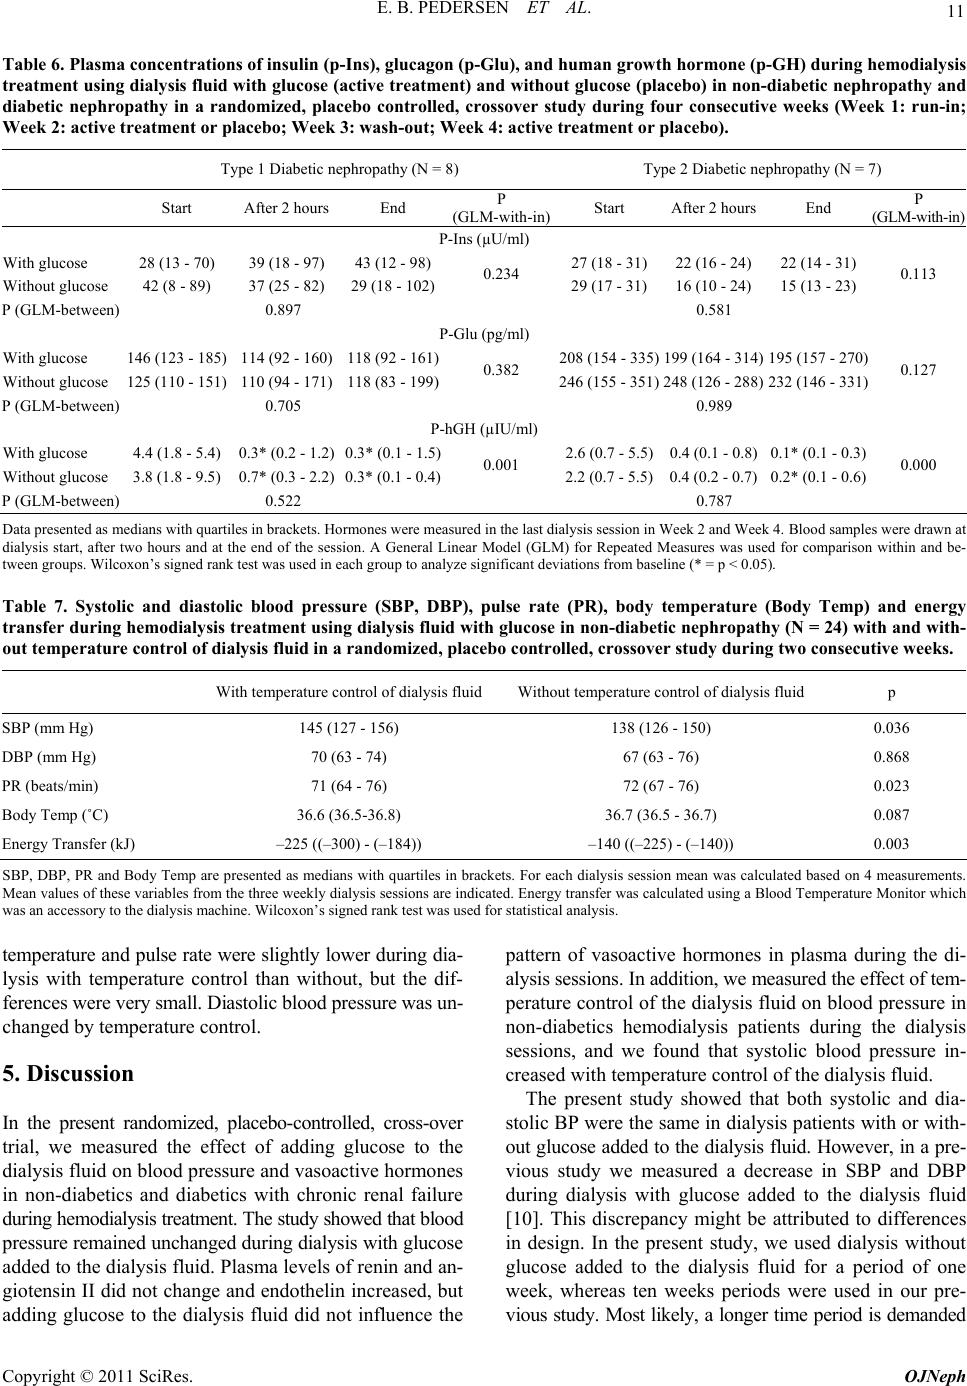 11 E. B. PEDERSEN ET AL. Table 6. Plasma concentrations of insulin (p-Ins), glucagon (p-Glu), and human growth hormone (p-GH) during hemodialysis treatment using dialysis fluid with glucose (active treatment) and without glucose (placebo) in non-diabetic nephropathy and diabetic nephropathy in a randomized, placebo controlled, crossover study during four consecutive weeks (Week 1: run-in; Week 2: active treatment or placebo; Week 3: wash-out; Week 4: active treatment or placebo). Type 1 Diabetic nephropathy (N = 8) Type 2 Diabetic nephropathy (N = 7) Start After 2 hours End P (GLM-with-in) Start After 2 hours End P (GLM-with-in) P-Ins (µU/ml) With glucose 28 (13 - 70) 39 (18 - 97) 43 (12 - 98)27 (18 - 31)22 (16 - 24) 22 (14 - 31) Without glucose 42 (8 - 89) 37 (25 - 82) 29 ( 1 8 - 102)0.234 29 (17 - 31)16 (10 - 24) 15 (13 - 23) 0.113 P (GLM-between) 0.897 0.581 P-Glu (pg/ml) With glucose 146 (123 - 185) 114 (92 - 160) 118 (92 - 161)208 (154 - 335)199 (164 - 314) 195 (157 - 270) Without glucose 125 (110 - 151) 110 (94 - 171) 118 (83 - 199)0.382 246 (155 - 351)248 (126 - 288) 232 (146 - 331) 0.127 P (GLM-between) 0.705 0.989 P-hGH (µIU/ml) With glucose 4.4 (1.8 - 5.4) 0.3* (0.2 - 1.2) 0.3* (0.1 - 1.5)2.6 (0.7 - 5.5)0. 4 (0.1 - 0.8) 0.1* (0. 1 - 0.3) Without glucose 3.8 (1.8 - 9.5) 0.7* (0.3 - 2.2) 0.3* (0.1 - 0.4)0.001 2.2 (0.7 - 5. 5 )0.4 (0 .2 - 0.7) 0.2* (0.1 - 0.6) 0.000 P (GLM-between) 0.522 0.787 Data presented as medians with quartiles in brackets. Hormones were measure d in the last dialysis session in Week 2 and Week 4. Blood samples were drawn at dialysis start, after two hours and at the end of the session. A General Linear Model (GLM) for Repeated Measures was used for comparison within and be- tween groups. Wilcoxon’s signed rank test was used in each group to analyze significant deviations from baseline (* = p < 0.05). Table 7. Systolic and diastolic blood pressure (SBP, DBP), pulse rate (PR), body temperature (Body Temp) and energy transfer during hemodialy sis treatment using dialysis fluid with glucose in non-diabetic ne phropathy (N = 24) with and with- out temperature control of dialysis fluid in a randomized, placebo controlled, crossover study during two consecutive weeks. With temperature control of dialysis fluid Wi t ho ut t e mperature control of dialysis fluid p SBP (mm Hg) 145 (127 - 156) 138 (126 - 150) 0.036 DBP (mm Hg) 70 (63 - 74) 67 (63 - 76) 0.868 PR (beats/min) 71 (64 - 76) 72 (67 - 76) 0.023 Body Temp (˚C) 36.6 (36 .5-36.8) 36.7 (36.5 - 36.7) 0.087 Energy Transfer (kJ) –225 ((–300) - (–184)) –140 ((–225) - (–140)) 0.003 SBP, DBP, PR and Body Temp are present ed as medians wit h quartiles i n brackets. For ea ch dialysis s ession mean was c alculated based on 4 measurements. Mean values of th ese vari ables from th e three week ly di alysi s sessi ons ar e indicat ed. Ener gy tr ansf er was calcu lated u sing a Blood Temperature Monitor which was an accessory to the dialysis machine. Wilcoxon’s signed rank test was used for statistical analysis. temperature and pulse rate were slightly lower during dia- lysis with temperature control than without, but the dif- ferences were very small. Diastolic blood pressure was un- changed by temperature control. 5. Discussion In the present randomized, placebo-controlled, cross-over trial, we measured the effect of adding glucose to the dialysis fluid on blood pressure and vasoactive hormones in non-diabetics and diabetics with chronic renal failure during hemodialysis treatment. The study showed that blood pressure remained unchanged during dialysis with glucose added to the dialysis fluid. Plasma levels of renin and an- giotensin II did not change and endothelin increased, but adding glucose to the dialysis fluid did not influence the pattern of vasoactive hormones in plasma during the di- alysis sessions. In addition, we measured the effect of tem- perature control of the dialysis fluid on blood pressure in non-diabetics hemodialysis patients during the dialysis sessions, and we found that systolic blood pressure in- creased with temperature control of the dialysis fluid. The present study showed that both systolic and dia- stolic BP were the same in dialysis patients with or with- out glucose added to the dialysis fluid. However, in a pre- vious study we measured a decrease in SBP and DBP during dialysis with glucose added to the dialysis fluid [10]. This discrepancy might be attributed to differences in design. In the present study, we used dialysis without glucose added to the dialysis fluid for a period of one week, whereas ten weeks periods were used in our pre- vious study. Most likely, a longer time period is demanded Copyright © 2011 SciRes. OJNeph 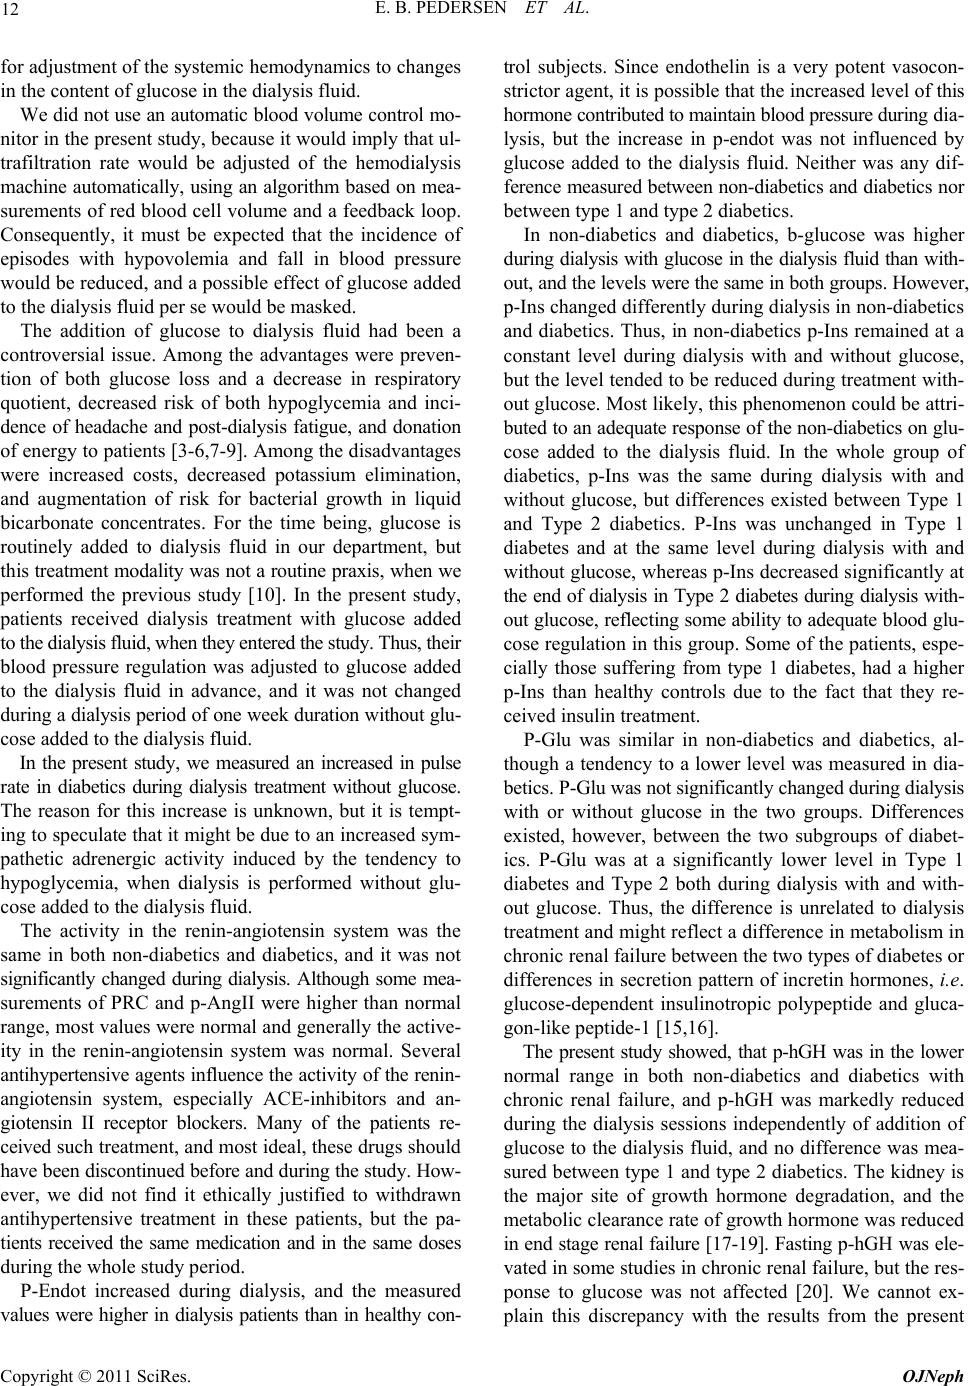 E. B. PEDERSEN ET AL. 12 for adjustment of the systemic hemodynamics to changes in the content of glucose in the dialysis fluid. We did not use an automatic blood volume control mo- nitor in the present stud y, because it would imply that u l- trafiltration rate would be adjusted of the hemodialysis machine automatically, using an algorithm based on mea- surements of red blood cell volume and a feedback loop. Consequently, it must be expected that the incidence of episodes with hypovolemia and fall in blood pressure would be reduced, and a possible effect of glucose added to the dialysis fluid per se would be masked. The addition of glucose to dialysis fluid had been a controversial issue. Among the advantages were preven- tion of both glucose loss and a decrease in respiratory quotient, decreased risk of both hypoglycemia and inci- dence of headache and post-dialysis fatigue, and donation of energy to patients [3-6,7-9]. Among the disadvantages were increased costs, decreased potassium elimination, and augmentation of risk for bacterial growth in liquid bicarbonate concentrates. For the time being, glucose is routinely added to dialysis fluid in our department, but th is treatment modality was n ot a routine praxis, when we performed the previous study [10]. In the present study, patients received dialysis treatment with glucose added to the dialysis fluid, when they entered th e study. Thus, thei r blood pressure regulation was adjusted to glucose added to the dialysis fluid in advance, and it was not changed during a dialysis period of one week duration without glu- cose added to the dialysis fluid. In the present study, we measured an increased in pulse rate in diabetics during dialysis treatment without glucose. The reason for this increase is unknown, but it is tempt- ing to speculate that it might be due to an increased sym- pathetic adrenergic activity induced by the tendency to hypoglycemia, when dialysis is performed without glu- cose added to the dialysis fluid. The activity in the renin-angiotensin system was the same in both non-diabetics and diabetics, and it was not significantly changed during dialysis. Although some mea- surements of PRC and p-AngII were higher than normal range, most values were normal and generally the active- ity in the renin-angiotensin system was normal. Several antihypertens ive agents influen ce the activity of the renin- angiotensin system, especially ACE-inhibitors and an- giotensin II receptor blockers. Many of the patients re- ceived such treatment, and most ideal, these drug s should have been discontinued before and during the study. How- ever, we did not find it ethically justified to withdrawn antihypertensive treatment in these patients, but the pa- tients received the same medication and in the same doses during the whole study period. P-Endot increased during dialysis, and the measured values were higher in dialysis patients than in healthy con- trol subjects. Since endothelin is a very potent vasocon- strictor agent, it is po ssible that the in creased level of this hormone contributed to maintain blood pressure during dia- lysis, but the increase in p-endot was not influenced by glucose added to the dialysis fluid. Neither was any dif- ference measured between non-diabetics and diabetics nor between type 1 and type 2 diabetics. In non-diabetics and diabetics, b-glucose was higher during dial ysis with glu cose in th e dialysis fluid than with- out, and the levels were the same in both groups. However, p-Ins changed differently during dialysis in non-diabetics and diabetics. Thus, in non-diabetics p-Ins remained at a constant level during dialysis with and without glucose, but the level ten ded to be reduced during treatment with- out glucose. Most likely, this phenomenon could be attri- buted to an adequate response of the non-diabetics on glu- cose added to the dialysis fluid. In the whole group of diabetics, p-Ins was the same during dialysis with and without glucose, but differences existed between Type 1 and Type 2 diabetics. P-Ins was unchanged in Type 1 diabetes and at the same level during dialysis with and without glucose, whereas p-Ins decreased significantly at the end of dialysis in Type 2 diabetes during dialysis with- out glucose, reflecting some ability to adequate blood glu- cose regulation in this group. Some of th e patients, espe- cially those suffering from type 1 diabetes, had a higher p-Ins than healthy controls due to the fact that they re- ceived insulin treatment. P-Glu was similar in non-diabetics and diabetics, al- though a tendency to a lower level was measured in dia- betics. P-Glu was not significantly changed during dialysis with or without glucose in the two groups. Differences existed, however, between the two subgroups of diabet- ics. P-Glu was at a significantly lower level in Type 1 diabetes and Type 2 both during dialysis with and with- out glucose. Thus, the difference is unrelated to dialysis treatment and might reflect a difference in metabolism in chronic renal failure between the two types of diabetes or differences in secretion pattern of incretin hormones, i.e. glucose-dependent insulinotropic polypeptide and gluca- gon-like peptide-1 [15,16]. The present study showed, that p-hGH was in the lower normal range in both non-diabetics and diabetics with chronic renal failure, and p-hGH was markedly reduced during the dialysis sessions independently of addition of glucose to the dialysis fluid, and no difference was mea- sured between type 1 and type 2 diabetics. The k idney is the major site of growth hormone degradation, and the metabolic clearance rate of growth hormone was reduced in end stage renal failure [17-19]. Fasting p-hGH was ele- vated in some studies in chronic renal failure, but the res- ponse to glucose was not affected [20]. We cannot ex- plain this discrepancy with the results from the present Copyright © 2011 SciRes. OJNeph  13 E. B. PEDERSEN ET AL. study. The pronounced decrease in p-hGH during the dia- lysis sessions might be due to elimination during dialysis, since the molecule weight is 22.000 Dalton, or to adhesion to the filter membrane, but the mechanism is unknown. In a separate group comprising 24 non diabetic dialy- sis patients, we measured a significant increase in SBP us- ing dialysis with temperature control of dialysis fluid com- pared with dialysis without temperature control (145 versus 138 mm Hg). In parallel with the increase in SBP, the energy flux from the patien ts was significantly higher with temperature control than without. Most likely, the increase in SBP could be attributed to peripheral vaso- constriction secondary to loss of energy in form of heat. However, the measured body temperature did not deviate significantly between the two dialysis modalities. It is rea- sonable to suppose that the auto regulatory capacity of body temperature antagonized and overruled the attempt of tem- perature control during the dialysis procedure. The price for temperature control was a slight increase in SBP and a marginal although significant reduction in pulse rate. Thus, the use of temperature control of dialysis fluid does not seem to be justified on a routinely basis, but can be one of several treatment options to prevent blood pressure fall during dialysis sessions. To sum up, in non-diabetics and diabetics, blood pressure was unchanged during dialysis with glucose added to the dialysis fluid in a short-term study. Vasoactive hormones in plasma changed in the same way independently of glu- cose in the dialysis fluid. Systolic blood pressure increased using dialysis with temperature control of dialysis fluid, presumably due to vasoconstriction to prevent or antago- nize a fall in body temperature. 6. Acknowledgements The study was supported by Ringkjoebing Amt and Re- gion Midt, Denmark, and by a grant from European Ne- phrology Dialysis Institute, Oberursel, Germany. We thank the staff of nurses in the Dialysis Unit and the Laboratory Technicians in Department of Medical Research for skillful assistance to perform the study. 7. References [1] M. A. Jackson, M. R. Holland, J. Nicholas, R. Lodwick, D. Forster and I. A. Macdonald, “Hemodialysis-Induced Hypoglycemia in Diabetic Patients,” Clinical Nephrology, Vol. 54, No.1, 2000, pp. 30-34. [2] M. A. Jackson, M. R. Holland, J. Nicholas, et al., “Occult Hypoglycemia Caused by Hemodialysis,” Clinical Ne- phrology, Vol. 51, No. 4, 1999, pp. 242-247. [3] R. A. Ward, M. J. Shirlow, J. M. Hayes, G. V. Chapman and P. C. Farrell, “Protein Catabolism during Hemodialy- sis,” American Journal of Clinical Nutrition, Vol. 32, No. 12, 1979, pp. 2443-2449. [4] R. A. Ward, R. L. Wathen, T. E. Williams and G. B. Harding, “Hemodialysate Composition and Intradialytic Metabolic, Acid-Base and Potassium Changes,” Kidney International, Vol. 32, 1987, pp. 129-135. doi:10.1038/ki.1987.182 [5] A. Gutierrez, J. Bergstrom and A. Alvestrand, “Hemodi- alysis-Associated Protein Catabolism with and without Glucose in the Dialysis Fluid,” Kidney International, Vol. 46, 1994, pp. 814-822. doi:10.1038/ki.1994.337 [6] C. L. Skutches and M. H. Sigler, “Plasma Glucose Turn- over and Oxidation during Hemodialysis: Nutritional Ef- fect of Dialysis Fluid,” American Journal of Clinical Nu- trition, Vol. 65, No. 1, 1997, pp. 128-135. [7] S. F. Raju, A. R. White, T. T., Barnes P. P. Smith and K. A. Kirchner, “Improvement in Disequilibrium Symptoms during Dialysis with Low Glucose Dialyzate,” Clinical Nephrology, Vol. 18, No. 3, 1982, pp. 126-129. [8] M. Leski, T. Niethammer and T. Wyss, “Glucose-En- riched Dialysate and Tolerance to Maintenance Hemodi- alysis,” Nephron, Vol. 24, No. 6, 1979, pp. 271-273. doi:10.1159/000181734 [9] G. Ramirez, B. L. Bercaw, D. E. Butcher, H. L. Mathis, C. Brueggemeyer and J. L. Newton, “The Role of Glucose in Hemodialysis: The Effects of Glucose-Free Dialysate,” American Journal of Kidney Diseases, Vol. 7, No. 5, 1986, pp. 413-420. [10] M. Sangill and E. B. Pedersen, “The Effect of Glucose Added to the Dialysis Fluid on Blood Pressure, Blood Glucose and Quality of Life in Hemodialysis Patients: A Placebo Controlled Cross-Over Study,” American Journal of Kidney Diseases, Vol. 47, No. 4, 2006, pp. 636-643. doi:10.1053/j.ajkd.2006.01.007 [11] A. D. Baron, “Hemodynamic Actions of Insulin,” Ame- rican Journal of Physiology, Vol. 267, No. 2, 1994, pp. E187-202. [12] J. E. Hall, T. G. Coleman, H. L. Mizelle and M. J. Smith Jr., “Chronic Hyperinsulinemia and Blood Pressure Re- gulation,” American Journal of Physiology, Vol. 258, No. 3, 1990, pp. F722-731, [13] R. A. DeFronzo, J. D. Tobin, J. W. Rowe and R. Andres, “Glucose Intolerance in Uremia. Quantification of Pan- creatic Beta Cell Sensitivity to Glucose and Tissue Sensi- tivity to Insulin,” Journal of Clinical Investigation, Vol. 62, 1978, pp. 425-435. doi:10.1172/JCI109144 [14] E. B. Pedersen, H. Eiskjaer, B. Madsen, H. Danielsen, M. Egeblad and C. B. Nielsen, ”Effect of Captopril on Renal Extraction of Renin, Angiotensin II, Atrial Natriuretic Peptide and Vasopressin, and Renal Vein Renin Ratio In Patients with Arterial Hypertension and Unilateral Renal Artery Disease,” Nephrology Dialysis Transplantation, Vol. 8, No. 10, 1993, pp. 1064-1070. [15] S. Efendic and N. Portwood, “Overview of Incretin Hor- mones,” Hormone and Metabolic Research, Vol. 36, No. 11-12, 2004, pp. 742-746. doi:10.1055/s-2004-826157 [16] D. J. Drucker, “The Role of Gut Hormones in Glucose Copyright © 2011 SciRes. OJNeph  E. B. PEDERSEN ET AL. Copyright © 2011 SciRes. OJNeph 14 Homeostasis,” Journal of Clinical Investigation, Vol. 117, No. 1, 2007, pp. 24-32. doi:10.1172/JCI30076 [17] V. Johnson and T. Maack, “Renal Extraction, Filtration, Absorption, and Catabolism of Growth Hormone,” American Journal of Physiology, Vol. 233, No. 3, 1977, pp. F185-196. [18] D. Haffner, F. Schaefer, J. Girard, E. Ritz and O. Mehls, “Metabolic Clearance of Recombinant Human Growth Hormone in Health and Chronic Renal Failure,” Journal of Clinical Investigation, Vol. 93, No. 3, 1994, pp. 1163- 1171. doi:10.1172/JCI117069 [19] J. D. Veldhuis, A. Iranmanesh, M. J. Wilkowski and E. Samojlik, “Neuroendocrine Alterations in the Somato- tropic and Lactotropic Axes in Uremic Men,” European Journal of Endocrinology, Vol. 131, No. 5, 1994, pp. 489- 498. doi:10.1530/eje.0.1310489 [20] V. Allegra, F. Amendolagine, G. Mengozzi, M. Tenti and A. Vasile, “Growth Hormone Secretion Abnormalities in Uremic Patients: Which Is the Role of Impaired Glucose Hypothalamic Sensitivity?” Nephron, Vol. 48, No. 1, 1988, pp. 76-77. doi:10.1159/000184874
|