Paper Menu >>
Journal Menu >>
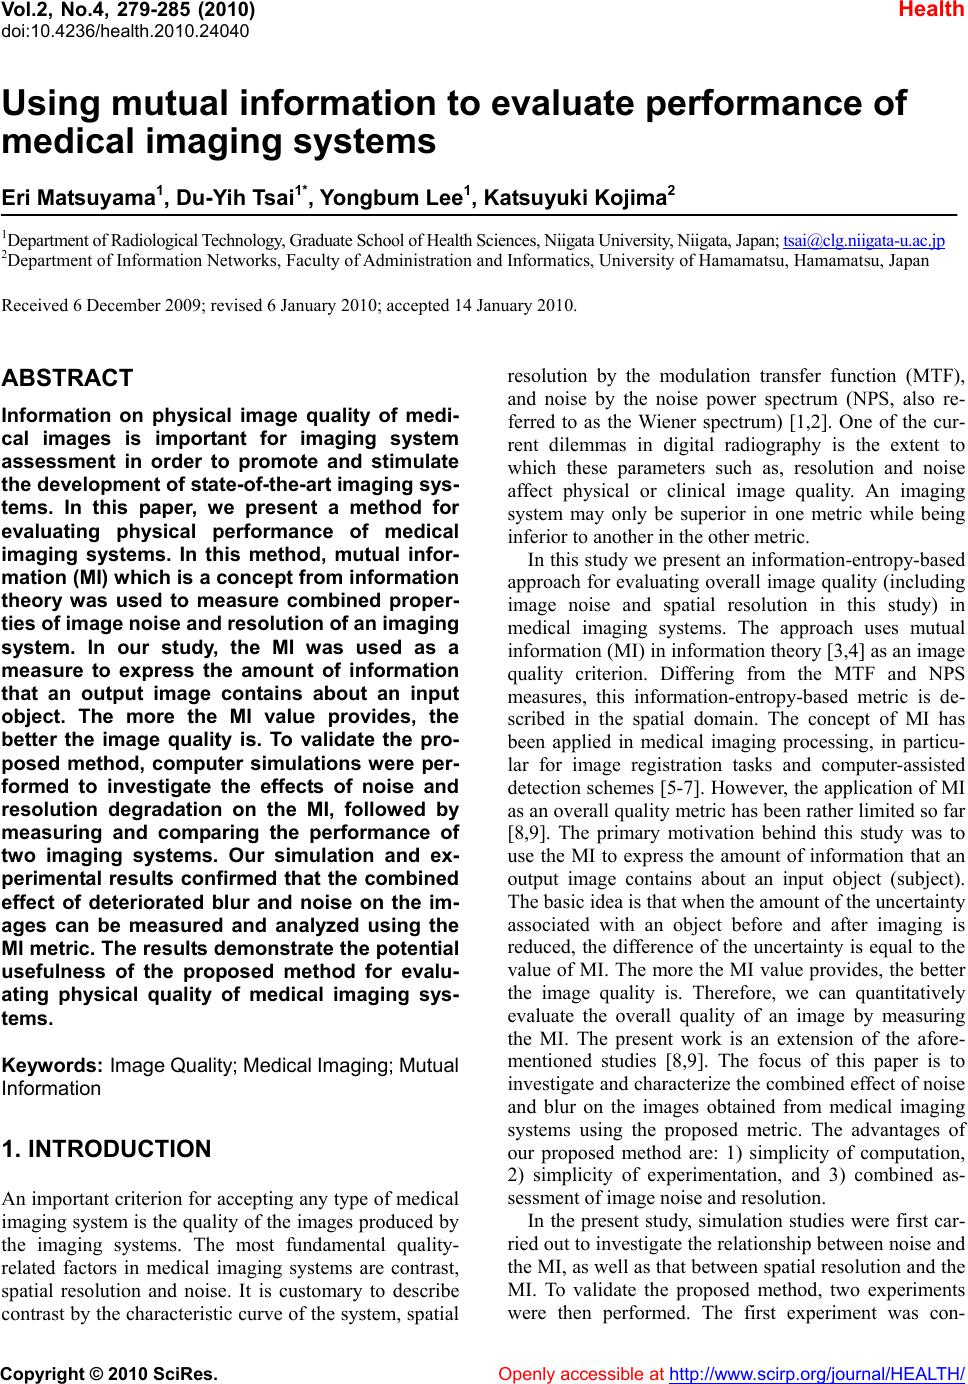 Vol.2, No.4, 279-285 (2010) Health doi:10.4236/health.2010.24040 Copyright © 2010 SciRes. Openly accessible at http://www.scirp.org/journal/HEALTH/ Using mutual information to evaluate performance of medical imaging systems Eri Matsuyama1, Du-Yih Tsai1*, Yongbum Lee1, Katsuyuki Kojima2 1Department of Radiological Technology , Graduate School of Health Sciences, Niigata University , Niigata, Japan; tsai@clg.niigata-u.ac.jp 2Department of Information Networks, Faculty of Administration and Informatics, University of Hama matsu, Hamamatsu, Japan Received 6 December 2009; revised 6 January 2010; accepted 14 January 2010. ABSTRACT Information on physical image quality of medi- cal images is important for imaging system assessment in order to promote and stimulate the development of state-of-the-art imaging sys- tems. In this paper, we present a method for evaluating physical performance of medical imaging systems. In this method, mutual infor- mation (MI) which is a concept from information theory was used to measure combined proper- ties of image noise and resolution of an imaging system. In our study, the MI was used as a measure to express the amount of information that an output image contains about an input object. The more the MI value provides, the better the image quality is. To validate the pro- posed method, computer simulations were per- formed to investigate the effects of noise and resolution degradation on the MI, followed by measuring and comparing the performance of two imaging systems. Our simulation and ex- perimental results confirmed that the combined effect of deteriorated blur and noise on the im- ages can be measured and analyzed using the MI metric. The results demonstrate the potential usefulness of the proposed method for evalu- ating physical quality of medical imaging sys- tems. Keywords: Image Quality; Medical Imaging; Mutual Information 1. INTRODUCTION An important criterion for accepting an y type of medical imaging system is the quality of the images produced by the imaging systems. The most fundamental quality- related factors in medical imaging systems are contrast, spatial resolution and noise. It is customary to describe contrast by the characteristic curve of the system, spatial resolution by the modulation transfer function (MTF), and noise by the noise power spectrum (NPS, also re- ferred to as the Wiener spectrum) [1,2]. One of the cur- rent dilemmas in digital radiography is the extent to which these parameters such as, resolution and noise affect physical or clinical image quality. An imaging system may only be superior in one metric while being inferior to another in the other metric. In this study we present an information-entropy-based approach for evaluating overall image quality (including image noise and spatial resolution in this study) in medical imaging systems. The approach uses mutual information (MI ) in infor mation theor y [3,4 ] as an image quality criterion. Differing from the MTF and NPS measures, this information-entropy-based metric is de- scribed in the spatial domain. The concept of MI has been applied in medical imaging processing, in particu- lar for image registration tasks and computer-assisted detection schemes [5-7]. However, the application of MI as an overall quality metric has been rather limited so far [8,9]. The primary motivation behind this study was to use the MI to express the amount of information that an output image contains about an input object (subject). The basic idea is that when the amount of the uncertainty associated with an object before and after imaging is reduced, the difference of the uncertainty is equal to the value of MI. The more the MI valu e provides, the better the image quality is. Therefore, we can quantitatively evaluate the overall quality of an image by measuring the MI. The present work is an extension of the afore- mentioned studies [8,9]. The focus of this paper is to investigate and characterize the combined effect of noise and blur on the images obtained from medical imaging systems using the proposed metric. The advantages of our proposed method are: 1) simplicity of computation, 2) simplicity of experimentation, and 3) combined as- sessment of image noise and resolution. In the present study, simulation studies were first car- ried out to investigate the relatio nship between noise and the MI, as well as that between spatial resolutio n and the MI. To validate the proposed method, two experiments were then performed. The first experiment was con- 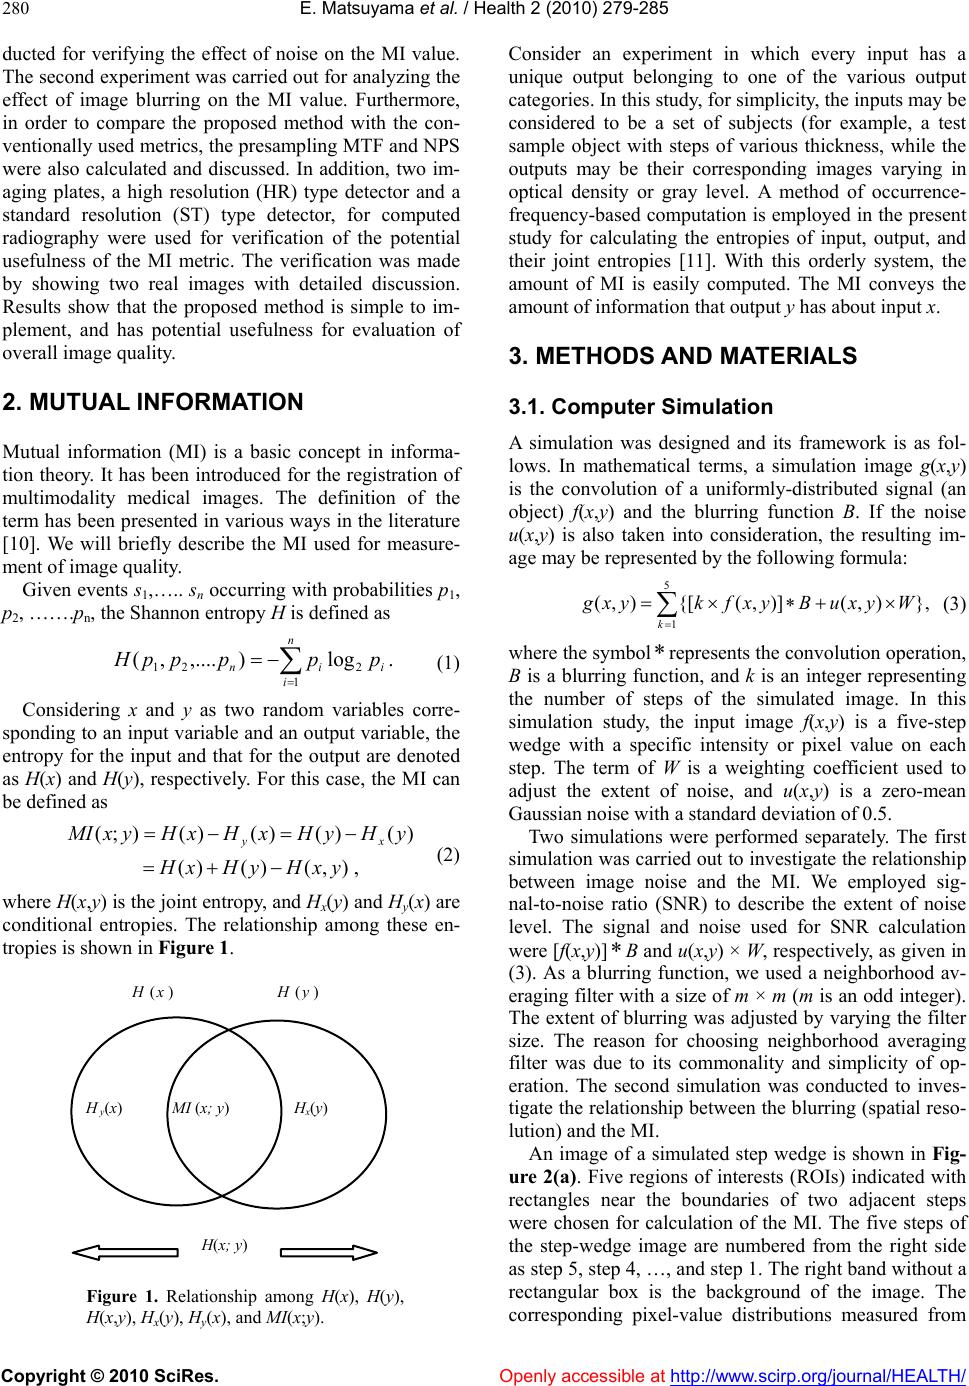 E. Matsuyama et al. / Health 2 (2010) 279-285 Copyright © 2010 SciRes. Openly accessible at http://www.scirp.org/journal/HEALTH/ 280 ducted for verifying the effect of noise on the MI value. The sec ond exper iment w as carri ed out for an alyzing th e effect of image blurring on the MI value. Furthermore, in order to compare the proposed method with the con- ventionally used metrics, the presampling MTF an d NPS were also calculated and discussed. In addition, two im- aging plates, a high resolution (HR) type detector and a standard resolution (ST) type detector, for computed radiography were used for verification of the potential usefulness of the MI metric. The verification was made by showing two real images with detailed discussion. Results show that the proposed method is simple to im- plement, and has potential usefulness for evaluation of overall image quality. 2. MUTUAL INFORMATION Mutual information (MI) is a basic concept in informa- tion theory. It has been introduced for the registration of multimodality medical images. The definition of the term has been presented in various ways in the literature [10]. We will briefly describe the MI used for measure- ment of image quality. Given events s1,….. sn occu rring with probabilities p1, p2, …….pn, the Shannon entropy H is defined as .log),....,( 2 1 21 i n iin pppppH (1) Considering x and y as two random variables corre- sponding to an in put variable and an output variab le, the entropy for the input and that for the output are denoted as H(x) and H(y), respectively. For this case, the MI can be defined as ,),()()( )()()()();( yxHyHxH yHyHxHxHyxMI xy (2) where H(x,y) is the joint entropy, and Hx(y) and Hy(x) are conditional entropies. The relationship among these en- tropies is shown in Figure 1. H y (x) H x (y) MI (x; y) H (x; y) H ( x ) H ( y ) Figure 1. Relationship among H(x), H(y), H(x,y), Hx(y), Hy(x), and MI(x;y). Consider an experiment in which every input has a unique output belonging to one of the various output categories. In this study, for simplicity, the inputs may be considered to be a set of subjects (for example, a test sample object with steps of various thickness, while the outputs may be their corresponding images varying in optical density or gray level. A method of occurrence- frequency-based computation is employed in the present study for calculating the entropies of input, output, and their joint entropies [11]. With this orderly system, the amount of MI is easily computed. The MI conveys the amount of information that output y has about input x. 3. METHODS AND MATERIALS 3.1. Computer Simulation A simulation was designed and its framework is as fol- lows. In mathematical terms, a simulation image g(x,y) is the convolution of a uniformly-distributed signal (an object) f(x,y) and the blurring function B. If the noise u(x,y) is also taken into consideration, the resulting im- age may be represented by the following formula: 5 1 },),()],({[),( k WyxuByxfkyxg (3) wher e th e s ymb ol represents the convo lution operatio n, B is a blurring function, and k is an integer representing the number of steps of the simulated image. In this simulation study, the input image f(x,y) is a five-step wedge with a specific intensity or pixel value on each step. The term of W is a weighting coefficient used to adjust the extent of noise, and u(x,y) is a zero-mean Gaussian noise with a standard deviati o n of 0.5. Two simulations were performed separately. The first simulation was carried out to investigate the relationship between image noise and the MI. We employed sig- nal-to-noise ratio (SNR) to describe the extent of noise level. The signal and noise used for SNR calculation were [f(x,y)] B and u(x,y) × W, respectively, as given in (3). As a blurring function, we used a neighborhood av- eraging filter with a size of m × m (m is an odd integer). The extent of blurring was adjusted by varying the filter size. The reason for choosing neighborhood averaging filter was due to its commonality and simplicity of op- eration. The second simulation was conducted to inves- tigate the relationship between the blurring (spatial reso- lution) and the MI. An image of a simulated step wedge is shown in Fig- ure 2(a). Five regions of interests (ROIs) indicated with rectangles near the boundaries of two adjacent steps were chosen for calculation of the MI. The five steps of the step-wedge image are numbered from the right side as step 5, step 4, …, and step 1. The right band without a rectangular box is the background of the image. The corresponding pixel-value distributions measured from 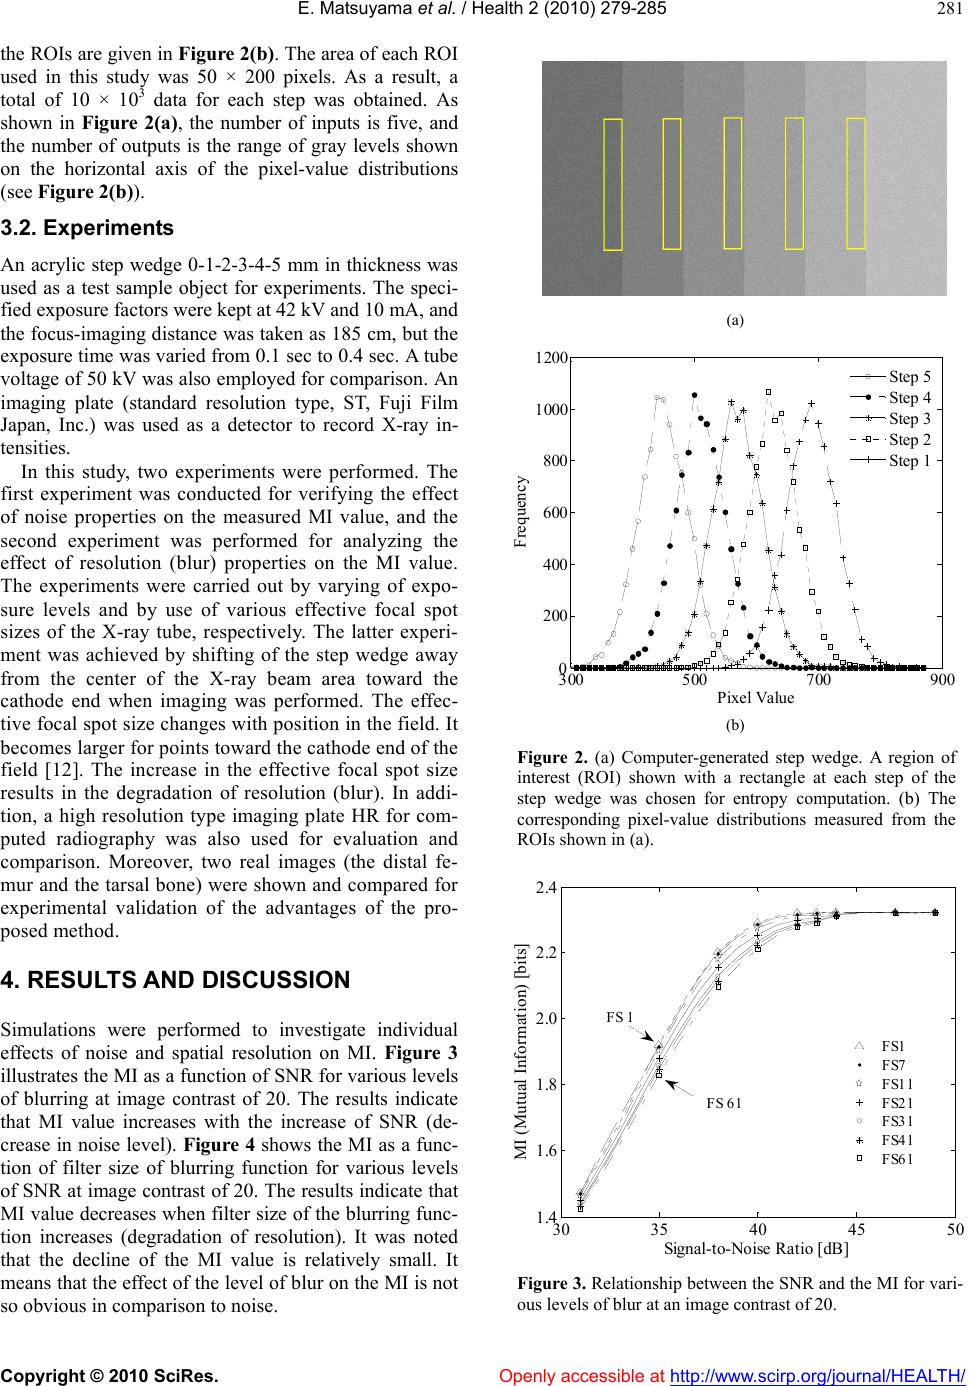 E. Matsuyama et al. / Health 2 (2010) 279-285 Copyright © 2010 SciRes. Openly accessible at http://www.scirp.org/journal/HEALTH/ 281 the ROIs are given in Figure 2(b). The area of each ROI used in this study was 50 × 200 pixels. As a result, a total of 10 × 103 data for each step was obtained. As shown in Figure 2(a), the number of inputs is five, and the number of outputs is the range of gray levels shown on the horizontal axis of the pixel-value distributions (see Figure 2(b)). 3.2. Experiments An acrylic step wedge 0-1-2-3-4-5 mm in thickness was used as a test sample object for experiments. The speci- fied exposure factors were kept at 42 kV and 10 mA, and the focus-imaging distance was taken as 185 cm, but the exposure time was varied from 0.1 sec to 0.4 sec. A tube voltage of 50 kV was also employed for comparison. An imaging plate (standard resolution type, ST, Fuji Film Japan, Inc.) was used as a detector to record X-ray in- tensities. In this study, two experiments were performed. The first experiment was conducted for verifying the effect of noise properties on the measured MI value, and the second experiment was performed for analyzing the effect of resolution (blur) properties on the MI value. The experiments were carried out by varying of expo- sure levels and by use of various effective focal spot sizes of the X-ray tube, respectively. The latter experi- ment was achieved by shifting of the step wedge away from the center of the X-ray beam area toward the cathode end when imaging was performed. The effec- tive foca l spot size ch anges with po sition in the field. I t becomes larger for points toward the cathode end of the field [12]. The increase in the effective focal spot size results in the degradation of resolution (blur). In addi- tion, a high resolution type imaging plate HR for com- puted radiography was also used for evaluation and comparison. Moreover, two real images (the distal fe- mur and the tarsal bone) were shown and compared for experimental validation of the advantages of the pro- posed method. 4. RESULTS AND DIS CUSSION Simulations were performed to investigate individual effects of noise and spatial resolution on MI. Figure 3 illustrates the MI as a function of SNR for various levels of blurring at image contrast of 20. The results indicate that MI value increases with the increase of SNR (de- crease in noise level). Figure 4 shows the MI as a func- tion of filter size of blurring function for various levels of SNR at image contrast of 20. The results indicate that MI value decreases when filter size of the blurring func- tion increases (degradation of resolution). It was noted that the decline of the MI value is relatively small. It means that the effect of the level of blur on the MI is not so obvious in comparison to noise. (a) 300500 700 900 0 200 400 600 800 1000 1200 Pixel Value Frequency Step 5 Step 4 Step 3 Step 2 Step 1 300500 700 900 0 200 400 600 800 1000 1200 Pixel Value Frequency Step 5 Step 4 Step 3 Step 2 Step 1 (b) Figure 2. (a) Computer-generated step wedge. A region of interest (ROI) shown with a rectangle at each step of the step wedge was chosen for entropy computation. (b) The corresponding pixel-value distributions measured from the ROIs shown in (a). 30 35 40 45 50 1.4 1.6 1.8 2.0 2.2 2.4 Signal -to-Noise Ratio [d B] MI (Mutual Inform atio n) [bi t s] FS1 FS7 FS11 FS21 FS31 FS41 FS61 FS 1 FS 61 Figure 3. Relationship between the SNR and the MI for vari- ous levels of blur at an image contrast of 20. 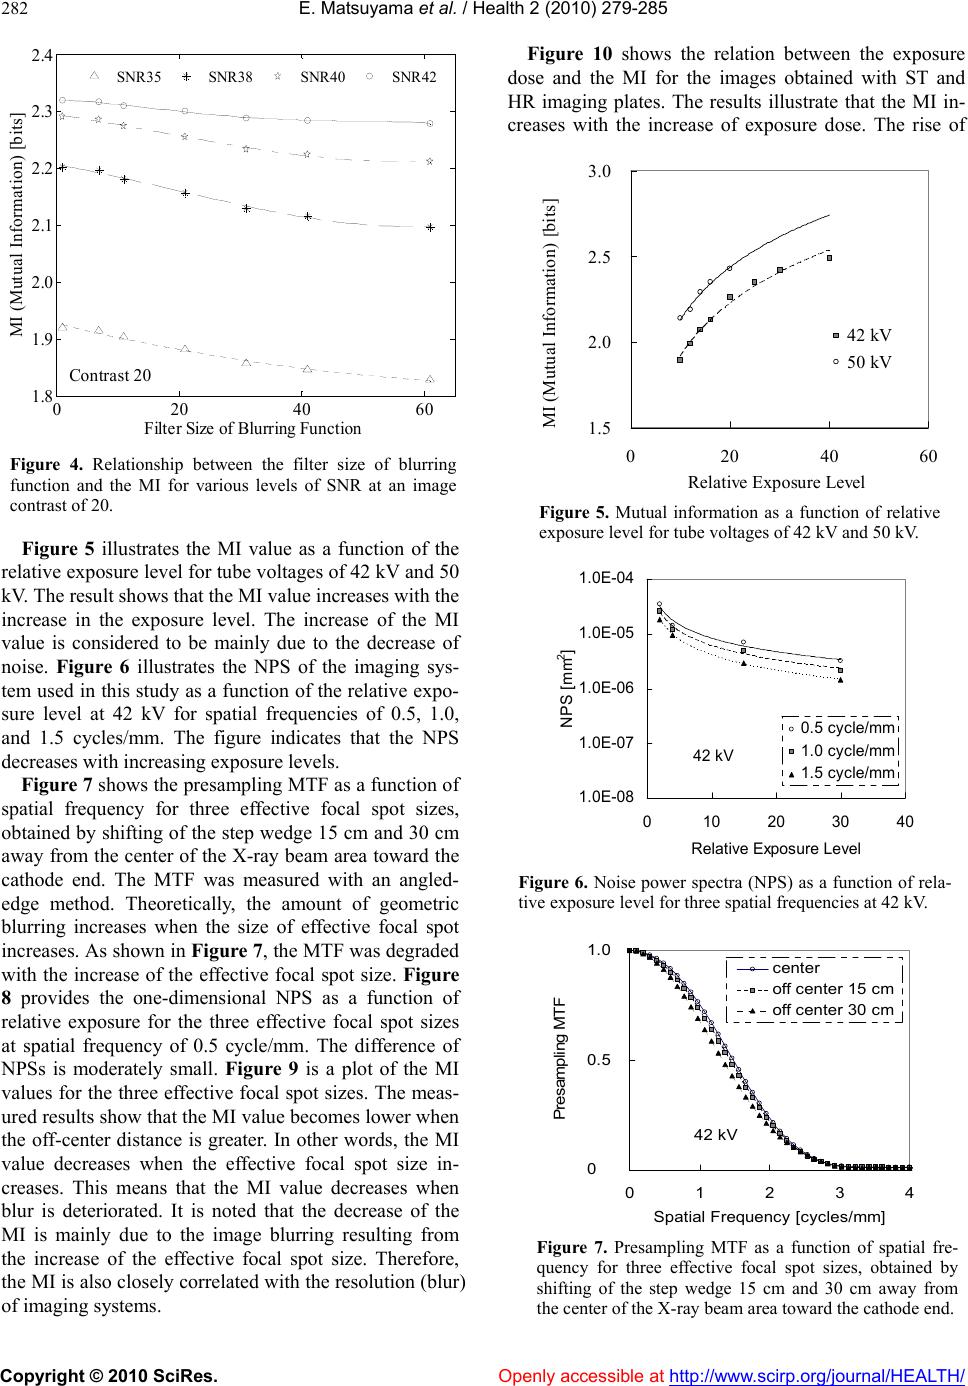 E. Matsuyama et al. / Health 2 (2010) 279-285 Copyright © 2010 SciRes. Openly accessible at http://www.scirp.org/journal/HEALTH/ 282 020 40 60 1.8 1.9 2.0 2.1 2.2 2.3 2.4 F ilt er Size of B lurring Function MI (Mutual Informati o n) [bi ts] SNR35 SNR38SNR40 SNR4 2 Co ntras t 20 Figure 4. Relationship between the filter size of blurring function and the MI for various levels of SNR at an image contrast of 20. Figure 5 illustrates the MI value as a function of the relative exposure level for tube vo ltages of 42 kV and 50 kV. The result shows that the MI value increases with the increase in the exposure level. The increase of the MI value is considered to be mainly due to the decrease of noise. Figure 6 illustrates the NPS of the imaging sys- tem used in this study as a fun ction of the relative expo- sure level at 42 kV for spatial frequencies of 0.5, 1.0, and 1.5 cycles/mm. The figure indicates that the NPS decreases with increasing exposure levels. Figure 7 shows the presampling MTF as a function of spatial frequency for three effective focal spot sizes, obtained by shifting of the step wedge 15 cm and 30 cm away from the center of the X-ray beam area toward the cathode end. The MTF was measured with an angled- edge method. Theoretically, the amount of geometric blurring increases when the size of effective focal spot increases. As shown in Figure 7, the MTF was degraded with the increase of the effective focal spot size. Figure 8 provides the one-dimensional NPS as a function of relative exposure for the three effective focal spot sizes at spatial frequency of 0.5 cycle/mm. The difference of NPSs is moderately small. Figure 9 is a plot of the MI values for the three effective focal spot sizes. The meas- ured results show th at the MI value beco mes lower when the off-center distance is greater. In other words, the MI value decreases when the effective focal spot size in- creases. This means that the MI value decreases when blur is deteriorated. It is noted that the decrease of the MI is mainly due to the image blurring resulting from the increase of the effective focal spot size. Therefore, the MI is also closely correlated with the resolution (blur) of imaging systems. Figure 10 shows the relation between the exposure dose and the MI for the images obtained with ST and HR imaging plates. The results illustrate that the MI in- creases with the increase of exposure dose. The rise of 1.5 2.0 2.5 3.0 0204060 Relative Ex p osure Level MI (Mutu a l Inf ormat io n) [ bits] 42 kV 50 kV Figure 5. Mutual information as a function of relative exposure level for tube voltages of 42 kV and 50 kV. 1.0E-08 1.0E-07 1.0E-06 1.0E-05 1.0E-04 0 10203040 Relat ive Exposure Level NPS [mm2] 0.5 cycle/mm 1.0 cycle/mm 1.5 cycle/mm 42 kV Figure 6. Noise power spectra (NPS) as a function of rela- tive exposure level for three spatial frequencies at 42 kV. 0.0 0.5 1.0 01234 Spatial Fr equency [ c y c les /mm] Presampling MTF center off center 15 c m off center 30 c m 42 kV Figure 7. Presampling MTF as a function of spatial fre- quency for three effective focal spot sizes, obtained by shifting of the step wedge 15 cm and 30 cm away from the center of the X-ray beam area toward the cathode end.  E. Matsuyama et al. / Health 2 (2010) 279-285 Copyright © 2010 SciRes. Openly accessible at http://www.scirp.org/journal/HEALTH/ 283 1.0E-08 1.0E-07 1.0E-06 1.0E-05 1.0E-04 0 10203040 Relat ive Exposure Level NPS [mm 2 ] cent e r off cen t er 15 c m off cen t er 30 c m 0.5 cycle/mm 42 kV Figure 8. Noise power spectra (NPS) as a function of relative exposure level for three effective focal spot sizes for 42 kV at the spatial frequency of 0.5 cy- cle/mm. 1.0 1.5 2.0 0 1020304050 Relative Exposure Level MI (Mutual Information) [bits] cen ter off center 15 cm off center 30 cm 42 kV Figure 9. Mutual information as a function of relative exposure level for three different exposure positions of the step wedge at 42 kV. 05 10 15 20 25 30 0 0.6 1.2 1.8 2.4 Exposure Dose [mAs] MI (Mutual Information) [bits] ST HR Figure 10. Mutual information as a function of rela- tive exposure level for ST and HR imaging plates. MI is considered due to the decrease of noise resulting from the increase of radiation dose. As shown in the fig- ure, the MI value for the ST plate is higher than that for the HR plate at the same exposure dose. This can be ex- plained by the fact that combined effects of the blur and noise lead to a higher MI value for the ST plate. Figure 11 shows the presampling MTFs of the ST and HR im- aging plates. The MTF of HR imaging plate is higher than that of ST imaging plate. This means that the spatial resolution (blur) of HR plate is higher than that of ST plate. Figure 12 illustrates the NPS of the ST and HR imaging plates used in this study. The results show that the NPS of the HR imaging plate is higher than that of the ST plate. This means that ST imaging plate has better noise proper ties. 0 1 23 45 0 0.2 0.4 0.6 0.8 1.0 Spatial Frequency [cycle s/mm] Presampling MT F HR ST Figure 11. Presampling MTF as a function of spatial frequency obtained with the ST and HR imaging plates. 0 1 23 45 10 -8 10 -7 10 -6 10 -5 10 -4 10 -3 Spatial Freq ue ncy [c ycles/mm] N PS [mm 2 ] HR ST Figure 12. NPS as a function of spatial frequency ob- tained with the ST (standard resolution) and HR (high resolution) imaging plates.  E. Matsuyama et al. / Health 2 (2010) 279-285 Copyright © 2010 SciRes. Openly accessible at http://www.scirp.org/journal/HEALTH/ 284 Figure 13. Real images of the distal femur acquired with ST (top row) and HR (bottom row) imaging plates. Figure 14. Real images of the tarsal bone acquired with ST (top row) and HR (bottom row) imaging plates. In Figures 13 and 14, we display the real images of the distal femur (Figure 13) and tarsal bone (Figure 14) acquired with ST and HR imaging plates under the same exposure conditions. In the two figures, the left column illustrates the original images; while on the right are the magnified images of the white rectangles indicated in the original images. It is seen from the magnified images (Figure 13) that the patellofemoral joint (with a white circle) obtained with the HR plate shows better resolu- tion as compared to ST plate. Similarly, the magnified images of Figure 14 (the cuneiform and navicular re- gions indicated by a white arrow) obtained with HR plate shows better resolution as compared to ST plate. The experimental validation provides confirming evi- dence for the MTF results presented in Figure 11. As regarding image noise, it can be seen from the magnified images of Figures 13 and 14 that the images acquired with HR plates show higher noise levels. The perceptual results correctly reflect the outcome of the NPS shown in Figure 12. 5. CONCLUSIONS In this study, we have presented a method for evaluating physical performance of medical imaging systems. In this method, mutual information was used to measure combined properties of image noise and resolution of an imaging system. To validate the proposed method, com- puter simulations were first performed to investigate the effects of noise and resolution degradation on mutual information. Then experiments were conducted to meas- ure the physical performance of an imaging plate in terms of the proposed metric. Our simulation and ex- perimental results confirmed that the combined effect of deteriorated blur and noise on the images can be meas- ured and analyzed using the mutual-information metric. The method is expected to be useful for evaluating over- all image quality of medical imaging systems. REFERENCES [1] Fujita, H., Doi, K. and Giger, M.L. (1985) Investigation of basic imaging properties in digital radiography. 6. MTFs of II-TV digital imaging systems. Medical Physics, 12, 713-720. [2] Giger, M.L., Doi, K. and Fujita, H. (1986) Investigation of basic imaging properties in digital radiography. 7. Noise Wiener spectra of II-TV digital imaging systems. Medical Physics, 13, 131-138. [3] Shannon, C.E. (1948) Mathematical theory of communi- cation. Bell System Technical Journal, 27, 379-423, 623- 656. [4] Shannon, C.E. and Weaver, W. (1949) The mathematical theory of communication. The University of Illinois Press, Urbana. [5] Skerl, D., Likar, B. and Pernus, F. (2006) A protocol for evaluation of similarity measures for rigid registration. IEEE Transactions on Medical Imaging, 25, 779-791. [6] Pluim, J.P.W., Maintz, J.B.A. and Viergever, M.A. (2003) Mutual-information-based registration of medical images: A survey. IEEE Transactions on Medical Imaging, 22, 986-1004. [7] Tourassi, G.D., Harrawood, B., Singh, S. and Lo, J.Y. (2007) Information-theoretic CAD system in mammog- raphy: Entropy-based indexing for computational effi- ciency and robust performance. Medical Physics, 34, 3193-3204.  E. Matsuyama et al. / Health 2 (2010) 279-285 Copyright © 2010 SciRes. Openly accessible at http://www.scirp.org/journal/HEALTH/ 285 [8] Lee, Y., Tsai, D.Y. and Matsuyama, E. (2007) A simula- tion study of radiographic image quality measurement based on transmitted information. Japanese Journal of Radiological Technology, 63, 341-344. [9] Tsai, D.Y., Lee, Y. and Matsuyama, E. (2008) Informa- tion-entropy measure for evaluation of image. Journal of Digital Imaging, 21, 338-347. [10] Cover, T.M. and Thomas, J.A. (1991) Elements of infor- mation theory. Wiley-Interscience, New York. [11] Attneave, F. (1967) Applications of information theory to psychology. Holt, Rinehart and Winston, New York. [12] Sprawls, P.Jr. (1995) Physical principles of medical im- aging. Medical Physics Publis hing, Wisconsin. |