Materials Sciences and Applicatio ns, 2011, 2, 1730-1740
doi:10.4236/msa.2011.212231 Published Online December 2011 (http://www.SciRP.org/journal/msa)
Copyright © 2011 SciRes. MSA
Fatigue Failure of Notched Specimen—A
Strain-Life Approach
Bikash Joadder, Jagabandhu Shit, Sanjib Acharyya*, Sankar Dhar
Department of Mechanical Engineering, Jadavpur University, Kolkata, India.
E-mail: *skacharyya@mech.jdvu.ac
Received July 22nd, 2011; revised September 9th, 2011; accepted November 15th, 2011.
ABSTRACT
Failure cycles of notched round specimens under strain controlled cyclic loading are predicted using strain—life rela-
tions obtained from experiment for plain fatigue round specimens. For notched specimens, maximum strain occurs at
notch root and is different from applied controlled strain. The maximum strain is computed by appropriate Finite ele-
ment analysis using the FE software ABAQUS. FE model and material parameters are validated by comparing the FE
results and experimental results of LCF tests of round specimens. This value of maximum strain is used for prediction of
failure cycles. Prediction is compared with the experimental results. The results show good matching.
Keywords: Strain-Life Equation, Failure Cycle, Notched Specimen, LCF, Cyclic Plasticity
1. Introduction
Fatigue has become progressively more relevant for tech-
nological development in automobiles, aircraft, com-
pressors, pumps, turbines, etc., subject to repeated load-
ing and vibration. Today it is often stated that fatigue
accounts for at least 90 percent of all service failures due
to mechanical causes [1]. A fatigue failure is particularly
insidious because it occurs without any obvious warning.
Therefore methodology for fatigue failure prediction is of
immense importance in industry and practice. One of the
popular age old stress based method for predicting fa-
tigue failure is based on S-N curve which was later on
modified to consider the effect of mean stress, effect of
low amplitude spikes in load spectra and statistical nature
of fatigue. Using Miner’s rule [2] the method can be ap-
plied for cumulative load cycles to assess the cumulative
damage. But all these application is valid for High cycle
fatigue where the stress and strain do not exceed the elas-
tic limit.
For low-cycle fatigue conditions where the stress is
high enough to create plastic deformation, fatigue failure
results from cyclic strain rather than from cyclic stress.
Low-cycle fatigue is usually characterised by the
Coffin-Manson relation [3-6], best described by the
material relation between plastic strain amplitude and life
which is known as strain life curve. An important use of
the strain-life curve is to predict the life for crack initia-
tion at notches in machine parts where the nominal
stresses are elastic but the local stresses and strains at the
root of a notch are inelastic. Neuber [7] proposed a sim-
ple function of nominal stress remotely measured from
the notch, which can be used to predict failure at the
notch. Basquin [8,9] observed that Stress-Life data could
be modeled using a power relationship, which results in a
straight line on a log-log plot. This observation corre-
sponds to elastic material behavior in the strain-life ap-
proach. Later the aproaches suggested by Basquin and
Coffin-Manson are combined together to develop the
strain life curve applicable over the whole regim (HCF
and LCF).
A. H. Noroozi, G. Glinka, S. Lambert [10] developed
unified two-parameter fatigue crack growth driving force
model to account for the residual stress and subsequently
the stress ratio effect on fatigue crack growth. Ostash,
Panasyuk and Kostyk [11] modelled fatigue fracture of
materials as a process of initiation of a macrocrack of a
particular length (material constant), which is success-
sively repeated (step-by-step) during its growth and the
‘local stress range vs. macrocrack initiation period rela-
tionship for notched specimens, might be applied to the
determination of the ‘macrocrack growth rate, da/dN, vs.
effective stress intensity factor range relationship.
A fatigue crack growth model under constant ampli-
tude loading has been developed by Pandey and Chand
[12] considering energy balance during crack growth.
Plastic energy dissipated during growth of a crack within
Fatigue Failure of Notched Specimen—A Strain-Life Approach1731
a small area, known as process zone at the tip of the
crack and the area below cyclic stress-strain curve was
used in the energy balance.
S. K. Visvanatha, P. V. Straznicky, R. L. Hewitt, 2000
[13] studied the influence of strain estimating techniques
on life predictions using the local strain approach. Knop,
Jones, Molent and Wang (2000) [14] focus on the devel-
opment of a simple method that combines modern con-
stitutive theory with either Neuber’s, or Glinka’s ap-
proach to calculate the localised notch strains to study the
effects of cyclic loading, mean stress relaxation and its
effect of fatigue damage. Jae-Yong Lim, Seong-Gu Hong,
Soon-Bok Lee, (2005) [15] proposed a methodology of
life prediction of fatigue crack initiation for the cyclically
non-stabilized and non-Masing steel. Modeling of fatigue
crack growth from a notch was attempted by Ding, Feng
and Jiang (2006) [16] to describe the crack growth at
notches quantitatively with a detailed consideration of
the cyclic plasticity of the material. Round compact
specimens made of 1070 steel were subjected to Mode I
cyclic loading with different R-ratios at room tempera-
ture. The approach developed was able to quantitatively
capture the crack growth behavior near the notch. An
implicit gradient application to fatigue of sharp notches
and weldments has been investigated by R. Tovo, P.
Livieri (2006) [17]. This paper addresses the problem of
stress singularities at the tip of sharp V-notches by means
of a non-local implicit gradient approach. Ku- jawski and
Stoychev (2006) [18] investigated the effects of the in-
ternal stresses on crack initiation at notches. Fatigue
strength assessment of welded joints from the integration
of Paris’ law to a synthesis based on the notch stress in-
tensity factors to the uncracked geometries has been
studied by B. Atzori, P. Lazzarin, G. Meneghett (2007)
[19]. The effect of notch plasticity on the behaviour of
fatigue cracks emanating from edge notches in high-
strength β-titanium alloys has been studied by M.
Benedetti, V. Fontanari , G. Lu tjering, J. Albrecht (2007)
[20]. Prediction of fatigue initiation lives in notched Ti
6246 specimens based on numerical models for predict-
ing LCF initiation is studied by M. T. Whittaker, S. J.
Williams and W. J. Evans, 2008, [21]. W. J. Evans, R.
Lancaster, A. Steele , M. Whittaker, N. Jones , 2009 [22]
explored the low cycle fatigue (LCF) characteristics of
three alloy variants and the assessment of methods for
predicting the observed lives. Fatigue life prediction of
notched components based on a new nonlinear Contin-
uum Damage Mechanics model has been studied by S.
Giancane, R. Nobile, F. W. Panella, V. Dattoma, 2010
[23]. A CDM (continuum damage mechanics) model for
damage evaluation is here considered and applied to the
study of two different typologies of notched and cylin-
drical specimens. Prediction of fatigue lifetime under
multiaxial cyclic loading using finite element analysis
studied by Guo-Qin Sun, De-Guang Shang, 2010 [24].
Here, Life prediction for GH4169 super-alloy thin tubu-
lar and notched specimens were investigated under pro-
portional and non-proportional loading with elastic-plas-
tic finite element analysis (FEA). Fatigue life prediction
of small notched Ti-6Al-4V specimens using critical dis-
tance is studied by Yoichi Yamashita, Yusuke Ueda,
Hiroshi Kuroki , Masaharu Shinozaki, 2010 [25]. Daniel
Leidermark, Johan Moverareab, Kjell Simonssona, Sören
Sjöström, Sten Johansson, 2010 [26] investigated the
fatigue crack initiation in notched single-crystal test
specimens of material MD2. A critical plane approach is
adopted, in which the total strain ranges on the discrete
slip planes are evaluated. Furthermore, a Coffin-Manson
type of expression is used to describe the number of cy-
cles to fatigue crack initiation. An investigation of fa-
tigue of a notched member, studied by Zengliang Gao,
Baoxiang Qiu, Xiaogui Wang, Y. Jiang 2010 [27] based
on the tension-compression, torsion, and axial-torsion
fatigue experiments conducted on notched shaft speci-
mens made of 16 MnR steel, local stress fatigue life pre-
diction approaches were evaluated.
The objective of this work is to predict the failure cy-
cle of notched round specimen of material SS316 under
strain controlled cyclic loading using combined form of
Coffin-Mansion relation and Basin’s equation. Strain-
life equation is derived from experimental results of plain
fatigue round specimen under strain controlled cyclic
loading. In case of plain fatigue round specimen the
strain remains uniform through out the cross section and
hence the maximum strain is easily known from the ap-
plied strain amplitude. But in the case of notched speci-
men maximum strain occurs at notch root and failure of
the specimen is governed by the value of this maximum
strain. Therefore computation of maximum strain in
notched specimen is highly important and the accuracy
of prediction mainly related to the accuracy in evaluation
of maximum strain. Finite element analysis with suitable
material model with the implementation of Armstrong
and Frederick’s (1966) kinematic hardening rule clubbed
with cyclic hardening is used to compute the maximum
strain in the notched specimen. Initially FE model to-
gether with material model are validated by comparing
the FE simulated results and experimental results of LCF
tests at different strain amplitudes. Then FE results for
notched specimen are generated using the same material
model. The maximum strain is evaluated from FE results
and is used to predict the failure cycle for notched
specimen from strain life relation already generated from
plain fatigue test data. Prediction is compared with the
experimental results.
Copyright © 2011 SciRes. MSA
Fatigue Failure of Notched Specimen—A Strain-Life Approach
Copyright © 2011 SciRes. MSA
1732
2. Material
316 Stainless steel (SS316) is selected as material for the
investigation. The chemical compositions of SS316 are
shown in Table 1. Grade 316 is the standard molybde-
num-bearing grade, second in importance to 304 amongst
the austenitic stainless steels. Grade 316 L, the low car-
bon version of 316 is immune from sensitisation (grain
boundary carbide precipitation). Thus it is extensively
used in heavy gauge welded components (over about 6
mm).
In the current investigation, cylindrical specimens
(notched specimens or specimens without notch) made
from the hot-rolled round bar are used to study the notch
effect on fatigue life of the material. Before machining,
the material was heat-treated (solution annealing, section)
at 1120˚C for 1 hour followed by water-cooling. After
machining, grinding is also done for better surface finish.
Three different types of specimens of different configu-
rations (plain tensile specimen, plain fatigue specimen,
notched fatigue specimens etc.) were made. Different
notches were made varying notch angle and notch depth.
3. Experiments
In this investigation all the experiments are performed
with an Instron-8801 load frame with 8800 electronics
and computer controller. An Extensometer of 12.5 mm
gauge length was used for the strain measurement. The
specimen matrix as shown in Table 2 is used to obtain
experimental data.
The type of test and material data obtained from these
tests are listed as
1) Tensile test with standard round specimens.
2) Low cycle fatigue test of round (without notch)
specimens are performed and failure cycles for different
strain amplitudes are determined. From the saturated
loop data, the coefficients of non-linear kinematic hard-
ening and of cyclic hardening parameters are obtained.
Coefficients for plastic strain-life equation and elastic
strain-life equation are evaluated from failure cycle
data.
3) Low cycle fatigue test for failure cycles of various
notched specimens (30˚, 45˚, 60˚) for different strain
amplitudes.
3.1. Tensile Test
Tensile tests are done in Instron-8800 machine at a fixed
displacement rate of 1 mm/min using Blue Hill software.
The Strain measurement was done by an extensometer.
The experiment was repeated with five specimens and
the values for yield stress, young’s modulus and stress-
strain data upto failure were obtained as statistical aver-
age. Output data of plain tensile test is shown in Tab le 3 .
These data are required as input for FE simulation.
Table 1. Chemical composition of SS316.
Fe (%) C (%) Cr (%) Ni (%) Mo (%) Mn (%) Si (%) P (%) S (%)
- <0.03 16 - 18.5 10 - 14 2 - 3 <2 <1 <0.045 <0.03
Table 2. Specimen matr ix.
Notch Angle
Name of
the Specimen
Quantity
Gauge Length
(mm) (GL)
Gauge Diameter
(mm) (GD) 300 450 600
Notch Diameter
(mm)
Notch Depth
(mm)
Grip Diameter
(mm)
Notch Fatigue 11 15 10 3 4 4 6 2 11.5
Plain Fatigue 6 15 7.5 X X X X X 10
Plain Tensile 5 30 6.5 X X X X X 10
Table 3. Table for out put data of plain tensile test.
Yield stress
(MPa)
Ultimate Stress
(MPa)
Tensile strain at Break
(%)
Tensile strain at maximum Load
(%)
Modulus (E-Modulus)
(Gpa)
267.27 700.78 82.03 78.86 165.68
Fatigue Failure of Notched Specimen—A Strain-Life Approach1733
3.2. Low Cycle Fatigue Test of Round Specimens
Strain controlled Low Cycle fatigue tests for plain round
specimens were done upto failure for six different strain
amplitudes (0.3%, 0.5%, 0.6%, 0.75%, 1.0% and 1.2%)
using SAX software as shown in Table 4. The stress-
strain data and the failure cycles were obtained for each
strain amplitude. The stress-strain curve for saturated
loop is shown in Figure 1 for strain amplitude of 0.5%.
All the tests are performed with the uniform strain rate of
10–2/s. The failure cycles were obtained from experi-
ments for each strain amplitude.
3.2.1. Extr action of Material Hardening
Parameters from Low Cycle Fatigue Test
Kinematic and Isotropic hardening parameters required
to model the stress-strain loop data for low cycle fatigue
loading were evaluated from the experimental loop stress-
strain data at saturated level. The values obtained are
tuned to match the loop stress-strain curve of different
strain amplitudes. The values were used to simulate load
vs. strain and stress vs. strain curve under cyclic loading
for plain fatigue specimens for different strain amplitudes.
The simulated and experimental results corresponding to
0.5% strain amplitude have been shown in Figures 2 and
3 respectively.
Coefficients of combined form of Coffin-Mansion re-
lation and Basin’s equation for Strain-life relation were
extracted from the failure cycles at different strain am-
plitudes.
FE Model of Low Cycle Fatigue Test:
Low cycle fatigue test for plain round and notched speci-
mens were simulated using the FE software ABAQUS.
Inputs for geometry, loading, material parameters and
boundary conditions were properly fed with combined
hardening material model. Then Load vs strain and stress
vs strain curves were generated from FE results. Peak
stresses were also evaluated at different cycles for each
strain amplitude.
Nonlinear Kinematic Hardening Model:
In FE simulation of LCF, Armstrong, Frederick (1966)
kinematic hardening model has been used. They intro-
duced a kinematic hardening rule containing a “recall”
term, which incorporates the fading memory effect of the
strain path and essentially makes the rule nonlinear in
nature. This kinematic hardening rule is given below:
Table 4. Failure cycles from low cycle plain fatigue test for
different strain amplitudes.
Specimen No. PF1 PF2 PF3 PF4 PF5 PF6
True strain (%) 0.3 0.5 0.6 0.75 1.0 1.2
Failure cycles 18837 1602 1224 562 247 210
Figure 1. Stress vs strain curve of 5% strain amplitude.
Figure 2. Load vs strain curve for the 1st cycle (0.5% strain
amplitude).
Figure 3. Stress vs strain curve for the 1st cycle (0.5% strain
amplitude).
Copyright © 2011 SciRes. MSA
Fatigue Failure of Notched Specimen—A Strain-Life Approach
1734
dd
pd
X
CX

p (1)
when
dd dd
p
pp
p

  (2)
here C and
are material constants.
Increase in the value of C would improve the simula-
tion during the initial nonlinear part, but the simulation
for the rest of the curve would suffer. Another limitation
of this model is its inability to produce constant plastic
modulus exhibited by experiments for a high strain range,
for which model always stabilizes to zero plastic modulus.
The isotropic hardening behavior of the model defines
the evolution of the size of the yield surface, 0
, as a
function of the equivalent plastic strain,
p
eq
. This evolu-
tion can be introduced by specifying 0
directly as a
function of
p
eq
. The simple exponential law is
0
01
p
eq
B
Qe

 
(3)
Initially all these material parameters (C, γ, Qά, B, 0
)
required to simulate cyclic loading were computed from
experimental results of LCF test of plain round speci-
mens at 0.5% strain amplitude and then, finally, tuned to
give optimum matching between experimental and FE
simulated results at various strain amplitudes. While
finding the optimum values of hardening parameters two
features have been considered. First, the predictability of
load vs strain curve for the first cycle and the second one
is the peak stresses at different cycles and both the fea-
tures at different strain amplitudes.
The FE results based on this optimum values of mate-
rial parameters are shown in Figures 2-7 and compared
with that of experimental results at different strain am-
plitudes and found to be satisfactory. From the results
Figure 4. Peak stress vs number of cycles (0.3% strain am-
plitude).
Figure 5. Peak Stress vs number of cycles (0.5% strain am-
plitude).
Figure 6. Peak Stress vs number of cycles (0.6% strain am-
plitude).
Figure 7. Peak Stress vs number of cycles (1.2% strain am-
plitude).
Copyright © 2011 SciRes. MSA
Fatigue Failure of Notched Specimen—A Strain-Life Approach
Copyright © 2011 SciRes. MSA
1735
The values of
f
and b are evaluated from the linear
fitting of Log (2
e
) vs Log (2N) that is shown in Fig-
it is accepted that this hardening parameters obtained can
be used to simulate the stress—strain behaveiour of no-
tched fatigue specimens under cyclic loading. The final
material parameters extracted from experimental fatigue
test are given in Table 5. ure 9.
b = –0.2092 and
f
E
= antilog(–2.0761) = 0.00856
3.2.2. Extraction of Strain-Life Equation from LCF
Test of Plain Round Specimens An equation valid for the entire range of fatigue can be
obtained by superposition of Equations (4) and (5) and
given as
Strain Life Curve: The plastic strain life curve is plotted
from LCF test of plain round specimens test data using
Coffin-Manson relation, which is best described by
 
22
222
b
c
pf
te
f
NN
E



  (6)

2
2
c
p
fN
(4)
The values of the coefficients
f
, b,
f
, c obtained
from LCF test data of plain round specimens with
different strain amplitudes are put in the Equation (6) and
the material strain-life curve for the entire range (LCF
and HCF) based on this equation is shown in Figure 10.
where, N = No. of Failure cycles,
f
=Fatigue ductility
coefficient, c = Fatigue ductility exponent.
The values of
f
and c are evaluated from the linear
fitting of log 2
p

vs Log (2N) that is shown in Fig-
ure 8. 4. FE Simulation of Notched Specimen
Notched fatigue specimens with different notch angles
and depths of notch are modeled and FE simulated re-
sults are generated for fatigue loading at different strain
amplitudes in ABAQUS. The material constants for
modeling kinematic hardening and cyclic hardening are
obtained from LCF test of plain round specimens. The
value of maximum plastic strain, elastic strain and total
strain at saturated loop are obtained as FE outputs. The
average strain at the notch tip element is also computed.
The contour plot for FE results for one specimen is
shown in Figure 11.
Hence c = –0.4503
f
= antilog(0.8674) = 0.1357
Elastic Strain Fatigue Life Curve:
The relation between elastic strain and fatigue life in
the high cycle fatigue can be described by the Basquin’s
reformulated equation. Basquin’s reformulated equation
is best described by

2
2
b
e
af
EN

 (5)
where,
f
= fatigue strength coefficient and b = Fatigue
strength exponent.
Table 5. Material parameters from experimental cyclic stress strain results.
Young Modulus Poisson’s Ratio (σ0) Knematic Hardening Parameter Cyclic Hardening Parameter
(E) (GPa) (ν) (MPa) (γ) (C) (Qα) (B)
200 0.3 220 430 35,000 142 11.7
Figure 8. Plast s tai n - life cu r ve. Figure 9. Elastic stain-life curve.
Fatigue Failure of Notched Specimen—A Strain-Life Approach
1736
Figure 10. Total stain-life curve.
Figure 11. Fe sim ulation of notched spec i m en in ABAQUS.
5. Computation of Failure Cycle for Notched
Fatigue Specimens
The failure cycles for different notched specimens are
found by following three steps.
1) Material strain-life equation for the whole range has
been developed from LCF test data of plain round
specimens. This strain life curve is also used for the fail-
ure prediction for notched specimen based on actual
strain developed at the notch tip at for different strain
amplitudes.
2) The maximum strain is evaluated at the notch tip
from FE simulation of LCF test of notched specimens.
3) On the basis of this maximum strain obtained from
FE analysis failure cycles for that notched specimen for a
given strain amplitude is computed from the material
total strain life—equation already developed from LCF
test data of plain round specimens.
4) Failure cycles for different notched specimens at
different strain amplitudes are found out from experiment
and compared with the predicted results.
Notched fatigue specimens are modeled and simulated
in FE software ABAQUS using the same material model
as used in simulating plain round specimens. The values
of different material hardening parameters are also kept
same as these are considered to be material constants.
The maximum strain for the notch tip element at satu-
rated level is obtained from FE outputs for a particular
notched specimen at the given strain amplitude. Putting
the value of the strain in the strain life equation devel-
oped from LCF test data of plain round specimens the
failure cycles N can be computed. The value of N thus
computed based on maximum strain gives the predicted
life of the notched specimen. In this way the predicted
lives are computed for 11 different notched specimens of
30˚, 45˚, 60˚ notch angles and each at different strain
amplitudes. Predicted results are compared with the lives
determined from experiment. The predicted results along
with experimental values for notched specimens of 30˚,
45˚, 60˚ notch angles are shown in Figures 12-14 respec-
tively. All the predicted results for all the notched speci-
mens along with experimental values are simultaneously
shown in Figure 15. Life cycles for notched specimens
are predicted on the basis of maximum strain at crack tip.
By joining the points of predicted life at different strain
amplitudes the predicted strain life curve can be gener-
ated. The actual life for the particular notched fatigue
specimens are determined from experiments and compared
with the predicted curves.
6. Results and Discussions
In this work it is attempted to predict the failure cycles of
notched fatigue specimen under strain controlled cyclic
loading using strain-life data of plain fatigue specimen
Figure 12. Strain-life curve 30˚ notch specimen.
Copyright © 2011 SciRes. MSA
Fatigue Failure of Notched Specimen—A Strain-Life Approach1737
Fi gur e 13 . Strain-life curve 45˚ notch specimen.
Fi gur e 14 . Strain-life curve for 60˚ Notch specimen.
Figur e 15. Common strain-life curve.
(without notch) on the basis of maximum strain devel-
oped obtained from finite element simulated results of
notched specimen under strain controlled cyclic loading.
The accuracy of prediction in this method depends on the
correctness of the material total strain-life curve gener-
ated from experimental results of LCF data of round
specimens and the accuracy of simulated value of maxi-
mum strain of notched specimens. The tensile properties
of the material have been determined from a large num-
ber of samples to minimize errors. Material total strain
life curve is generated from LCF tests of wide range of
strain amplitudes (0.3% to 1.2%). The failure of the
specimen is achieved at the point when the load drop is
60% of the maximum load. The strain rate and other pa-
rameters are maintained same to provide the uniform test
environment. The values of the coefficients are found to
be of the satisfactory in quality and the order of magni-
tude.
The accuracy in the prediction of failure cycles from
strain life equation highly depends on the accuracy of the
evaluation of maximum strain developed due to cyclic
loading corresponding to certain strain amplitude. For ir-
regular geometry like notched specimens the evaluation of
maximum strain corresponding to certain strain amplitude
is accomplished by finite element simulation of notched
fatigue specimens under cyclic loading. The accuracy of
the predicted strain by FE simulation depends on the se-
lection of appropriate material model and the accuracy of
the value of the material parameters used. In Figures 2
and 3 the load vs strain and stress vs strain for the LCF
test of round specimen at 0.5% strain amplitude are
shown along with the FE simulated results. The harden-
ing parameters used in FE simulation are extracted from
the experimental results of the same test. The predicted
results fairly match with the experimental results. Hence
the applicability of the Armstrong, Frederick (1966) ki-
nematic hardening model for the simulation of low cycle
fatigue test of round specimen is found to be acceptable.
Then using the same material model and material pa-
rameters the FE simulated results of LCF tests at differ-
ent strain amplitudes are generated and compared with
the experimental results and the values of hardening pa-
rameters are tuned. In the Figures 4-7 the peak stresses
vs no of cycles from FE simulated and experimental re-
sults are plotted and compared. It is appeared from the
figures that the predictability of peak stresses for LCF
test by this FE simulation is acceptable for different
strain amplitudes and also at different no of cycles.
Based on these observations this FE simulation method is
used to predict the actual maximum strain developed at
the notch tip for LCF test of notched specimen.
From the total strain-life curve the failure cycles for
any notched specimen is calculated using the maximum
total strain obtained from FE results for 30˚ notch angle
at different strain amplitudes and from these predictions
the total strain (max)—life curve for that notched speci-
Copyright © 2011 SciRes. MSA
Fatigue Failure of Notched Specimen—A Strain-Life Approach
Copyright © 2011 SciRes. MSA
1738
men is obtained. Now the actual failure cycles for that
notched specimen is found out from fatigue testing of
that notched specimen at that strain amplitude and is
compared with predicted results (Figure 11). In this way
the similar curves are generated also for specimens with
45˚ and 60˚ notch angles (Figures 12 and 13). The % of
error in predicted life is also calculated in each case and
tabulated in the Table 6. In most of the cases predicted
no of cycles are found to be less compared to experi-
mental values. The errors in prediction are found to have
no bias regarding strain range or notch angle. Predicted
Strain life curves are found to be almost similar for all
the three types of notches. The maximum % of error is
found to be 27.7 but the error is within 13% for most of
the cases. From the results it is apparent that the predict-
tion of failure cycles for notched specimens derived from
the strain life data of plain fatigue specimens based on
maximum strain developed in the specimen can be used
with a little approximation. The common strain life curve
generated from specimens of several notch angles gives a
better prediction, which is apparent from the Figure 14.
7. Conclusions
The final conclusion can be made from the results ob-
tained that the total strain-life curve generated from fa-
tigue test of round specimen can also be used for the pre-
diction of life for notched specimens based on actual
strain developed at notch tip. The actual strain obtained
from FE results based on the Armstrong, Frederick (1966)
kinematic hardening model and cyclic hardening material
model. Based on this material model the errors in life
prediction of notched specimens are found to be random
in nature of mean value of –3.90 and standard deviation
of 13.22. Hence it can be concluded that if the correct
values of actual maximum strain is compared with the
fatigue life, the same relationship will be obtained for the
same material for any geometry. The Advancement in FE
analysis for accurate prediction of strain at the notched
cross section can be used for life prediction of life of
components having complex geometry or discontinuity.
The strain life curve for a material can also be generated
using experimental results of notched specimens with
correction in strain value to be computed from FE analy-
sis. The method is straightforward and more generalized
compared to other methods. The degree of applicability
of this method is further to be tested for other type of
specimens and notch conditions. From the results it is
also observed that in most of the cases the predicted life
is found to be less compared to experimental values for
all the types of notched specimens. This may be due to
the fact that the life has been predicted based on maxi-
mum strain in notched section. The actual failure may be
Table 6. Computed and experimental results for failure cycles.
Sl No. Specimen Total strain (Exp) Total strain (max) N (predicted) N (exp.) Error (%)
(Computed)
1 NF230 0.002 0.006534 837 948 –11.7
2 NF330 0.0035 0.012538 180 205 –12.1
3 NF130 0.005 0.01519 102 117 –12.8
4 NF345 0.0015 0.005073 1652 1619 2.03
5 NF145 0.002 0.006965 715 746 –4.15
6 NF445 0.0025 0.008935 375 394 –5.06
7 NF245 0.003 0.010123 262 346 –24.2
8 NF260 0.0015 0.005257 1507 1660 3.2
9 NF160 0.002 0.007144 675 731 –7.6
10 NF360 0.0025 0.008109 487 397 27.7
11 NF460 0.003 0.099862 290 285 1.7
Fatigue Failure of Notched Specimen—A Strain-Life Approach1739
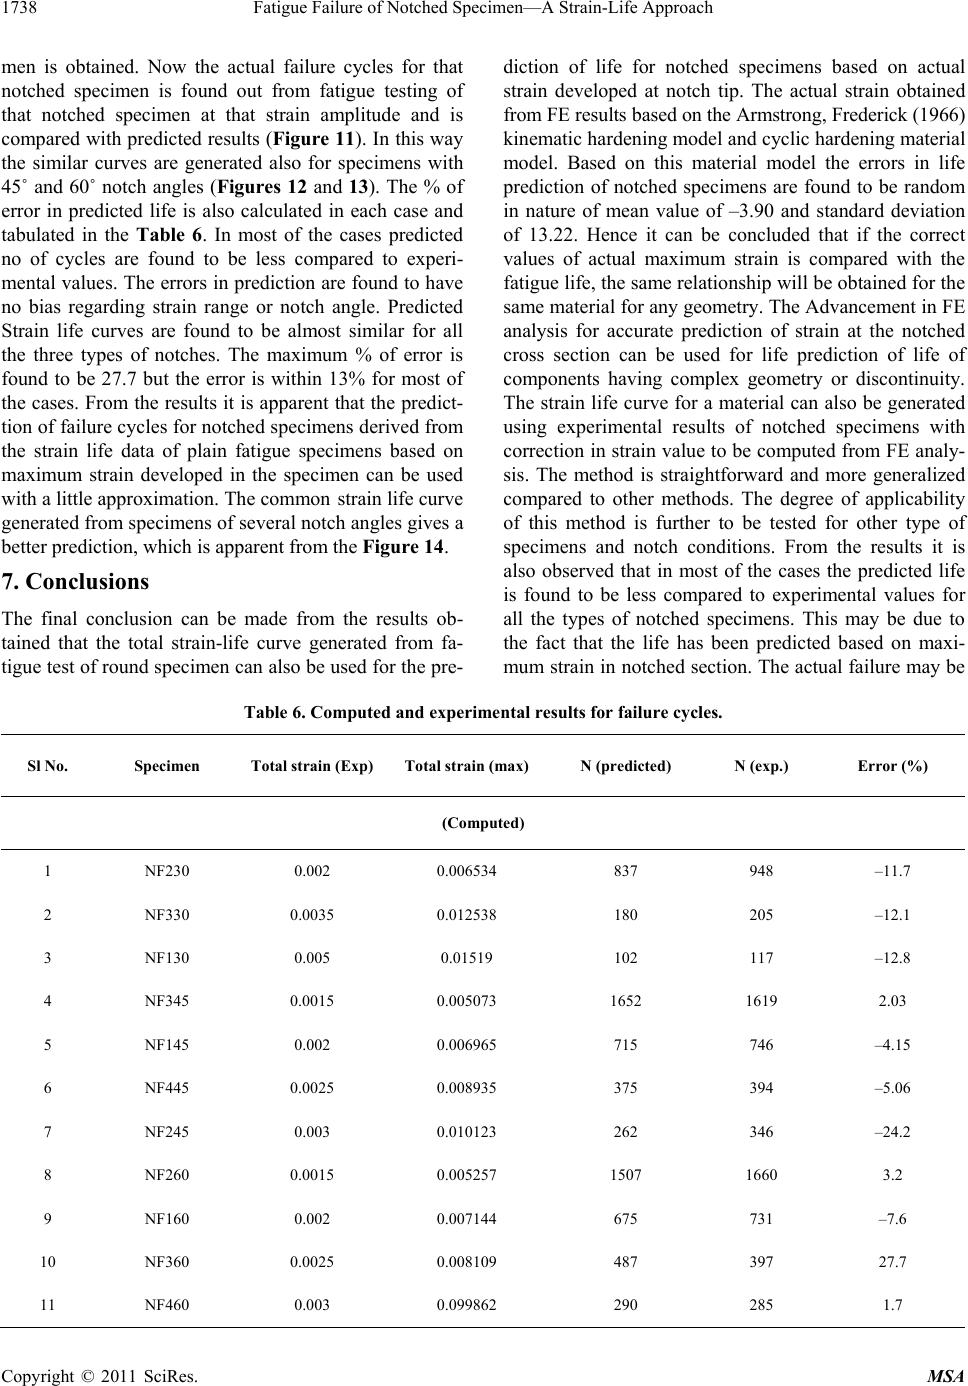
strain in notched section. The actual failure may be gov-
erned by the overall stress state in the cross section. Then
if the life is predicted on the basis of average strain in the
notched cross section a better match may be obtained.
REFERENCES
[1] Numerous Examples of Fatigue Failures Are Given in
Failure Analysis and Prevention, “Metals Handbook,”
Vol. 10, 8th Edition, American Society for Metals, Metals
Park, 1975.
[2] M. A. Miner, Journal of Applied Mechanics, Vol. 12, pp.
A159-A164, c1945.
[3] “Manual on Low-Cycle Fatigue Testing,” Constant Am-
plitude Low-Cycle Fatigue Testing, ASTM Standard
E606-80, ASTM Specical Technical Publication 465,
Philadelphia, 1969.
[4] J. D. Morrow, “Internal Friction, Damping and Cyclic
Plasticity,” ASTM Specical Technical Publication No.
378, Philadelphia, 1965, p.72.
[5] L. F. Jr. Coffin, “A Study of the Effects of Cyclic Ther-
mal Stresses on a Ductile Metal,” Transactions of the
ASME, Vol. 76, 1954, pp. 931-950.
[6] S. S. Manson and G. R. Halford, “Practical Implementation
of the Double Linear Damage Rule and Damage Curve
Approach for Treating Cumulative Fatigue Damage,” In-
ternational Journal of Fracture, Vol. 17, No. 2, 1981, pp.
169-192. doi:10.1007/BF00053519
[7] H. Neuber, “Theory of Stress Concentration for Shear-Str-
ained Prismatical Bodies with Arbitrary Nonlinear Stress-
Strain Law,” Journal of Applied Mechanics, Vol. 28, 1961,
pp. 544-550. doi:10.1115/1.3641780
[8] T. H. Topper, R. M. Wetzel and J. Morrow, Journal of
Materials, Vol. 4, 1969, pp. 200-209.
[9] O. H. Basquin, “The Exponential Law of Endurance
Tests,” American Society for Testing and Materials Pro-
ceedings, Vol. 10, 1910, pp. 625-630.
[10] A. H. Noroozi, G. Glinka and S. Lambert, “A Two Pa-
rameter Driving Force for Fatigue Crack Growth Analy-
sis,” International Journal of Fatigue, Vol. 27, No. 10-12,
2005, pp. 1277-1296.
doi:10.1016/j.ijfatigue.2005.07.002
[11] O. P. Ostash, V. V. Panasyuk and E. M. Kostyk, “A Uni-
fied Model of Initiation and Growth of Fatigue Macro-
cracks. Part 1. Use of Force Parameters of Fracture Me-
chanics of Materials at the Stage of Initiation of a Crack,”
Fiziko-Khimicheskaya Mekhanika Materialov, Vol. 34,
No. 1, 1998, pp. 7-21.
[12] K. N. Pandey and S. Chand, “Fatigue Crack Growth
Model for Constant Amplitude Loading,” Fatigue and
Fracture of Engineering Materials and Structures, Vol.
27, No. 1, 2004, pp. 459-472.
doi:10.1111/j.1460-2695.2004.00760.x
[13] S. K. Visvanatha, P. V. Straznicky and R. L. Hewit, “In-
fluence of Strain Estimation Methods on Life Predictions
Using the Local Strain Approach,” International Journal
of Fatigue, Vol. 22, No. 8, 2000, pp. 675-681.
doi:10.1016/S0142-1123(00)00042-6.
[14] M. Knop, R. Jones, L. Molent and C. Wang, “On the
Glinka and Neuber Methods for Calculating Notch Tip
Strains under Cyclic Load Spectra,” International Journal
of Fatigue, Vol. 22, No. 9, 2000, pp. 743-755.
doi:10.1016/S0142-1123(00)00061-X
[15] J.-Y. Lim, S.-G. Hong and S.-B. Lee, “Application of
Local Stress-Strain Approaches in the Prediction of Fa-
tigue Crack Initiation Life for Cyclically Non-Stabilized and
Non-Masing Steel,” International Journal of Fatigue, Vol.
27, No. 10-12, 2005, pp. 1653-1660.
doi:10.1016/j.ijfatigue.2005.07.014
[16] F. Ding, M. L. Feng and Y. Y. Jiang, “Modeling of Fa-
tigue Crack Growth from a Notch,” International Journal
of Plasticity, Vol. 23, No. 7, 2007, pp. 1167-1188.
doi:10.1016/j.ijplas.2006.10.010
[17] R. Tovo and P. Livieri, “An Implicit Gradient Application
to Fatigue of Sharp Notches and Weldments,” Engineering
Fracture Mechanics, Vol. 74, No. 4, 2007, pp. 515-526.
doi:10.1016/j.engfracmech.2006.06.009
[18] D. Kujawski and S. Stoychev, “Internal Stress Effects on
Fatigue Crack Initiation at Notches,” International Jour-
nal of Fatigue, Vol. 29, 2007, pp. 1744-1750.
doi:10.1016/j.ijfatigue.2006.12.004
[19] B. Atzori, P. Lazzarin and G. Meneghetti, “Fatigue
Strength Assessment of Welded Joints: From the Integra-
tion of Paris’ Law to a Synthesis Based on the Notch
Stress Intensity Factors of the Uncracked Geometries,”
Engineering Fracture Mechanics, Vol. 75, No. 3-4, 2008,
pp. 364-378.
doi:10.1016/j.engfracmech.2007.03.029
[20] M. Benedetti, V. Fontanari, G. Lutjering and J. Albrecht,
“The Effect of Notch Plasticity on the Behaviour of Fa-
tigue Cracks Emanating from Edge-Notches in High
Strength β-Titanium Alloys,” Engineering Fracture Me-
chanics, Vol. 75, No. 2, 2008, pp. 169-187.
doi:10.1016/j.engfracmech.2007.03.037
[21] M. T. Whittaker, S. J. Williams and W. J. Evans, “Predic-
tion of Fatigue Initiation Lives in Notched Ti 6246
Specimens,” International Journal of Fatigue, Vol. 30,
No. 4, 2008, pp. 623-634.
doi:10.1016/j.ijfatigue.2007.05.013
[22] W. J. Evans, R. Lancaster, A. Steele, M. Whittaker and N.
Jones, “Plain and Notched Fatigue in Nickel Single Crys-
tal Alloys,” International Journal of Fatigue, Vol. 31, No.
10, 2009, pp. 1709-1718.
doi:10.1016/j.ijfatigue.2009.03.010
[23] S. Giancane, R. Nobile, F. W. Panella and V. Dattoma,
“Fatigue Life Prediction of Notched Components Based
on a New Nonlinear Continuum Damage Mechanics
Model,” Procedia Engineering, Vol. 2, No. 1, 2010, pp.
1317-1325. doi:10.1016/j.proeng.2010.03.143
[24] G.-Q. Sun and D.-G. Shang, “Prediction of Fatigue Life-
time under Multiaxial Cyclic Loading Using Finiteele-
ment Analysis,” Materials & Design, Vol. 31, No. 1,
2010, pp. 126-133. doi:10.1016/j.matdes.2009.06.046
Copyright © 2011 SciRes. MSA
Fatigue Failure of Notched Specimen—A Strain-Life Approach
1740
[25] Y. Yamashita, Y. Ueda, H. Kuroki and M. Shinozaki, “Fa-
tigue Life Prediction of Small Notched Ti-6Al-4V Spe-
cimens Using Critical Distance,” Engineering Fracture
Mechanics, Vol. 77, 2010, pp. 1439-1453.
doi:10.1016/j.engfracmech.2010.04.001
[26] D. Leidermark, J. Moverareab, K. Simonssona, S. Sjöström
and S. Johansson, “Fatigue Crack Initiation in a Notched
Single-Crystal Superalloy Component,” Procedia Engi-
neering, Vol. 2, No. 1, 2010, pp. 1067-1075.
doi:10.1016/j.proeng.2010.03.115
[27] Z. L. Gao, B. X. Qiu, X. G. Wang and Y. Jiang, “An In-
vestigation of Fatigue of a Notched Member,” Interna-
tional Journal of Fatigue, Vol. 32, No. 12, 2010, pp.
1960-1969. doi:10.1016/j.ijfatigue.2010.07.005
List of Symbols
N = cycles to failure
έf = fatigue ductility coefficient
'
f
= fatigue strength coefficient
e = nominal strain range
εt = total strain
c = fatigue ductility exponent
γ = kinematics Hardening parameter
C = kinematics Hardening parameter
∆εp = plastic strain amplitude
εe = elastic component of the cyclic strain amplitude
b = fatigue strength exponent
ε = local strain range
0
= yield stress
Kt = stress Concentration Factor
p
eq
= equivalent plastic strain
X = back stress at any point
Copyright © 2011 SciRes. MSA