Paper Menu >>
Journal Menu >>
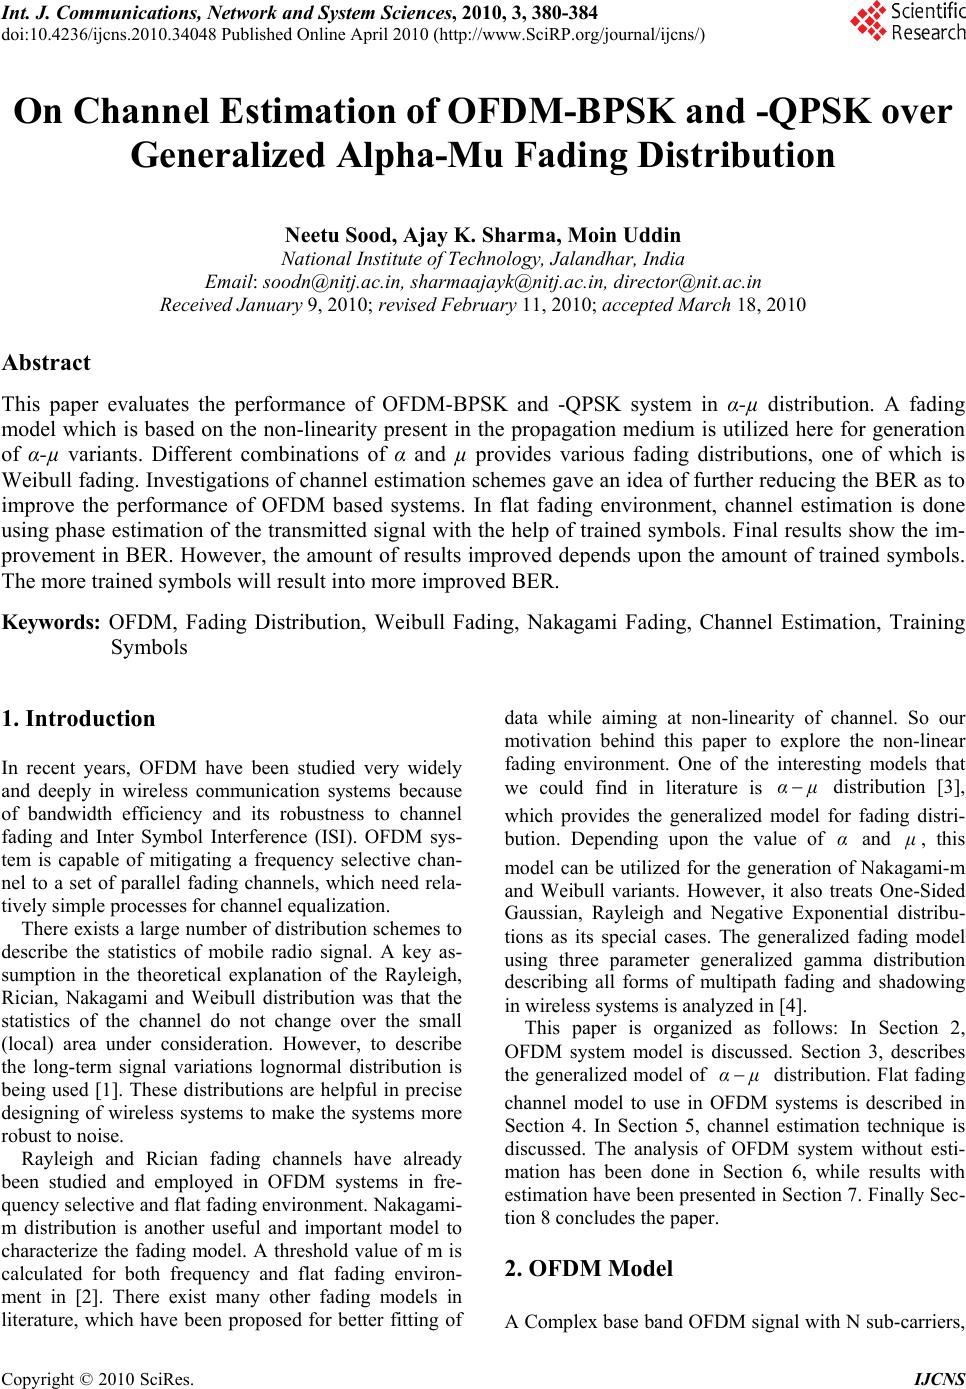 Int. J. Communications, Network and System Sciences, 2010, 3, 380-384 doi:10.4236/ijcns.2010.34048 blished Online April 2010 (http://www.SciRP.org/journal/ijcns/) Copyright © 2010 SciRes. IJCNS Pu On Channel Estimation of OFDM-BPSK and -QPSK over Generalized Alpha-Mu Fading Distribution Neetu Sood, Ajay K. Sharma, Moin Uddin National Institute of Technology, Jalandhar, India Email: soodn@nitj.ac.in, sharmaajayk@nitj.ac.in, director@nit.ac.in Received January 9, 2010; revised February 11, 2010; accepted March 18, 2010 Abstract This paper evaluates the performance of OFDM-BPSK and -QPSK system in α-µ distribution. A fading model which is based on the non-linearity present in the propagation medium is utilized here for generation of α-µ variants. Different combinations of α and µ provides various fading distributions, one of which is Weibull fading. Investigations of channel estimation schemes gave an idea of further reducing the BER as to improve the performance of OFDM based systems. In flat fading environment, channel estimation is done using phase estimation of the transmitted signal with the help of trained symbols. Final results show the im- provement in BER. However, the amount of results improved depends upon the amount of trained symbols. The more trained symbols will result into more improved BER. Keywords: OFDM, Fading Distribution, Weibull Fading, Nakagami Fading, Channel Estimation, Training Symbols 1. Introduction In recent years, OFDM have been studied very widely and deeply in wireless communication systems because of bandwidth efficiency and its robustness to channel fading and Inter Symbol Interference (ISI). OFDM sys- tem is capable of mitigating a frequency selective chan- nel to a set of parallel fading channels, which need rela- tively simple processes for channel equalization. There exists a large number of distribution schemes to describe the statistics of mobile radio signal. A key as- sumption in the theoretical explanation of the Rayleigh, Rician, Nakagami and Weibull distribution was that the statistics of the channel do not change over the small (local) area under consideration. However, to describe the long-term signal variations lognormal distribution is being used [1]. These distributions are helpful in precise designing of wireless systems to make the systems more robust to noise. Rayleigh and Rician fading channels have already been studied and employed in OFDM systems in fre- quency selective and flat fading environment. Nakagami- m distribution is another useful and important model to characterize the fading model. A threshold value of m is calculated for both frequency and flat fading environ- ment in [2]. There exist many other fading models in literature, which have been proposed for better fitting of data while aiming at non-linearity of channel. So our motivation behind this paper to explore the non-linear fading environment. One of the interesting models that we could find in literature is α μ distribution [3], which provides the generalized model for fading distri- bution. Depending upon the value of α and μ , this model can be utilized for the generation of Nakagami-m and Weibull variants. However, it also treats One-Sided Gaussian, Rayleigh and Negative Exponential distribu- tions as its special cases. The generalized fading model using three parameter generalized gamma distribution describing all forms of multipath fading and shadowing in wireless systems is analyzed in [4]. This paper is organized as follows: In Section 2, OFDM system model is discussed. Section 3, describes the generalized model of α μ distribution. Flat fading channel model to use in OFDM systems is described in Section 4. In Section 5, channel estimation technique is discussed. The analysis of OFDM system without esti- mation has been done in Section 6, while results with estimation have been presented in Section 7. Finally Sec- tion 8 concludes the paper. 2. OFDM Model A Complex base band OFDM signal with N sub-carriers, 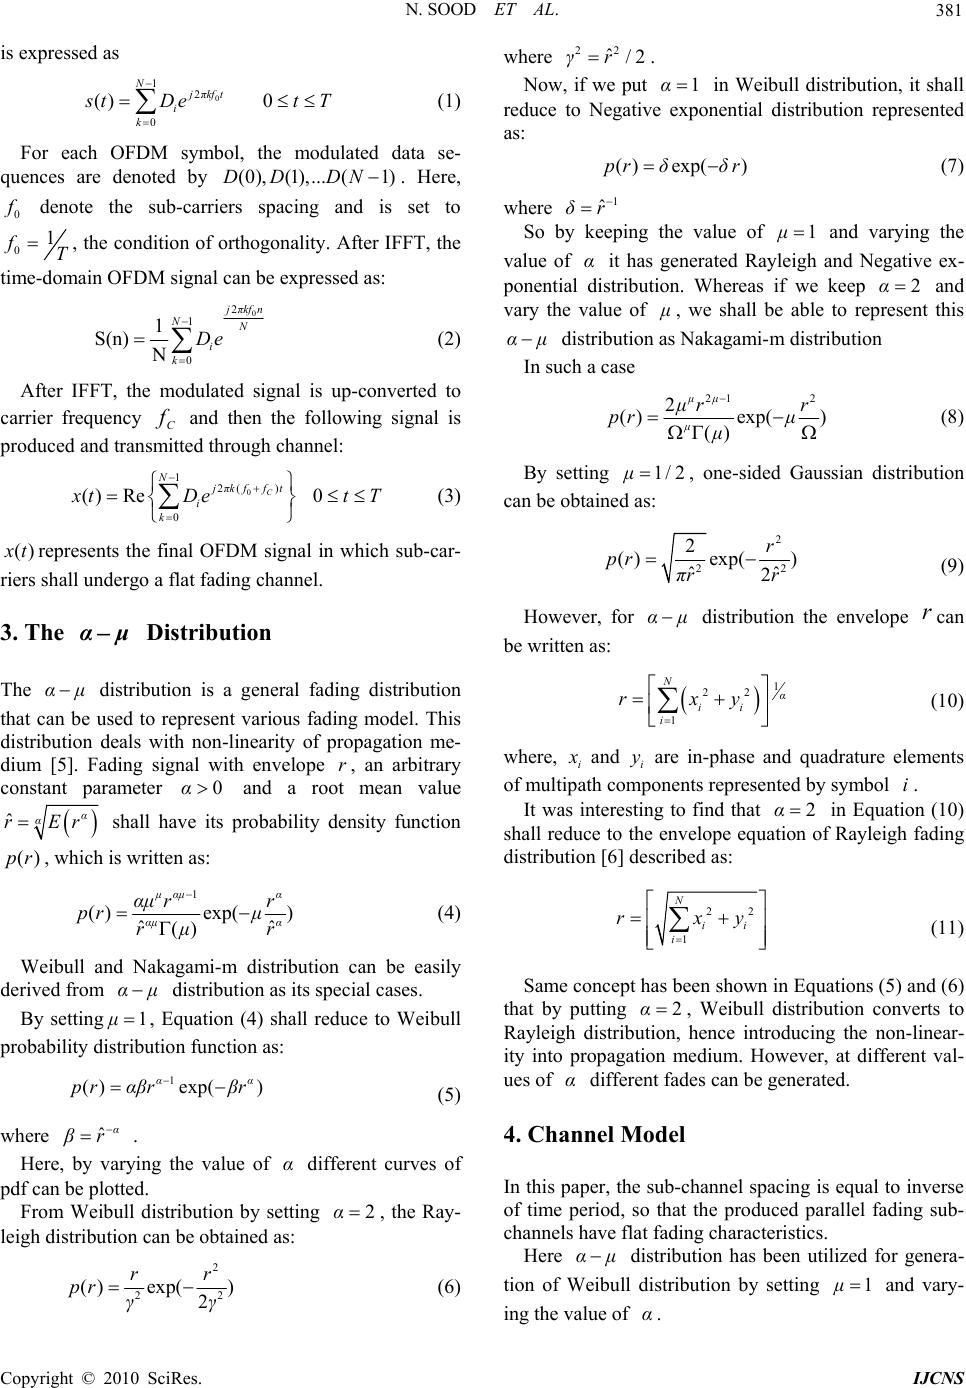 N. SOOD ET AL. 381 is expressed as 0 1 2 0 () Njπkf t i k stDe 0 (1) tT For each OFDM symbol, the modulated data se- quences are denoted by . Here, denote the sub-carriers spacing and is set to (0),(1),... (1)DD DN 0 f 0 f1 T, the condition of orthogonality. After IFFT, the time-domain OFDM signal can be expressed as: 0 2 1 0 1 S(n) N jπkf n NN i k De (2) After IFFT, the modulated signal is up-converted to carrier frequency and then the following signal is produced and transmitted through channel: C f 0 1 2( ) 0 () Re C Njπkff t i k xtDe 0tT (3) () x trepresents the final OFDM signal in which sub-car- riers shall undergo a flat fading channel. 3. The μ α Distribution The α μ distribution is a general fading distribution that can be used to represent various fading model. This distribution deals with non-linearity of propagation me- dium [5]. Fading signal with envelope , an arbitrary constant parameter and a root mean value r 0α ˆα α rEr ) shall have its probability density function , which is written as: (pr 1 ( )exp() ˆ () μαμ α αμ α αμ rr pr μ rμr ˆ (4) Weibull and Nakagami-m distribution can be easily derived from α μ distribution as its special cases. By setting, Equation (4) shall reduce to Weibull probability distribution function as: 1μ 1 ( )exp() αα pr αβrβr (5) where . ˆ α βr Here, by varying the value of different curves of pdf can be plotted. α From Weibull distribution by setting , the Ray- leigh distribution can be obtained as: 2α 2 2 () exp() 2 rr pr γ where . 22 ˆ/2γr Now, if we put 1 α in Weibull distribution, it shall reduce to Negative exponential distribution represented as: () exp() pr δδr (7) where 1 ˆ δr So by keeping the value of and varying the value of it has generated Rayleigh and Negative ex- ponential distribution. Whereas if we keep 1μ α 2 α and vary the value of μ , we shall be able to represent this α μ distribution as Nakagami-m distribution In such a case 21 2 2 ()exp( ) () μμ μ μrr pr μ μ (8) By setting 1/2 μ, one-sided Gaussian distribution can be obtained as: 2 2 2 ()exp( ) ˆ 2 r pr πr2 ˆ r (9) However, for α μ distribution the envelope r can be written as: 1 22 1 N α ii i rxy (10) where, i x and are in-phase and quadrature elements of multipath components represented by symbol . i y i It was interesting to find that in Equation (10) shall reduce to the envelope equation of Rayleigh fading distribution [6] described as: 2α 22 1 N ii i rxy (11) Same concept has been shown in Equations (5) and (6) that by putting 2 α, Weibull distribution converts to Rayleigh distribution, hence introducing the non-linear- ity into propagation medium. However, at different val- ues of different fades can be generated. α 4. Channel Model In this paper, the sub-channel spacing is equal to inverse of time period, so that the produced parallel fading sub- channels have flat fading characteristics. Here α μ distribution has been utilized for genera- tion of Weibull distribution by setting and vary- ing the value of . 1μ α 2 γ (6) C opyright © 2010 SciRes. IJCNS 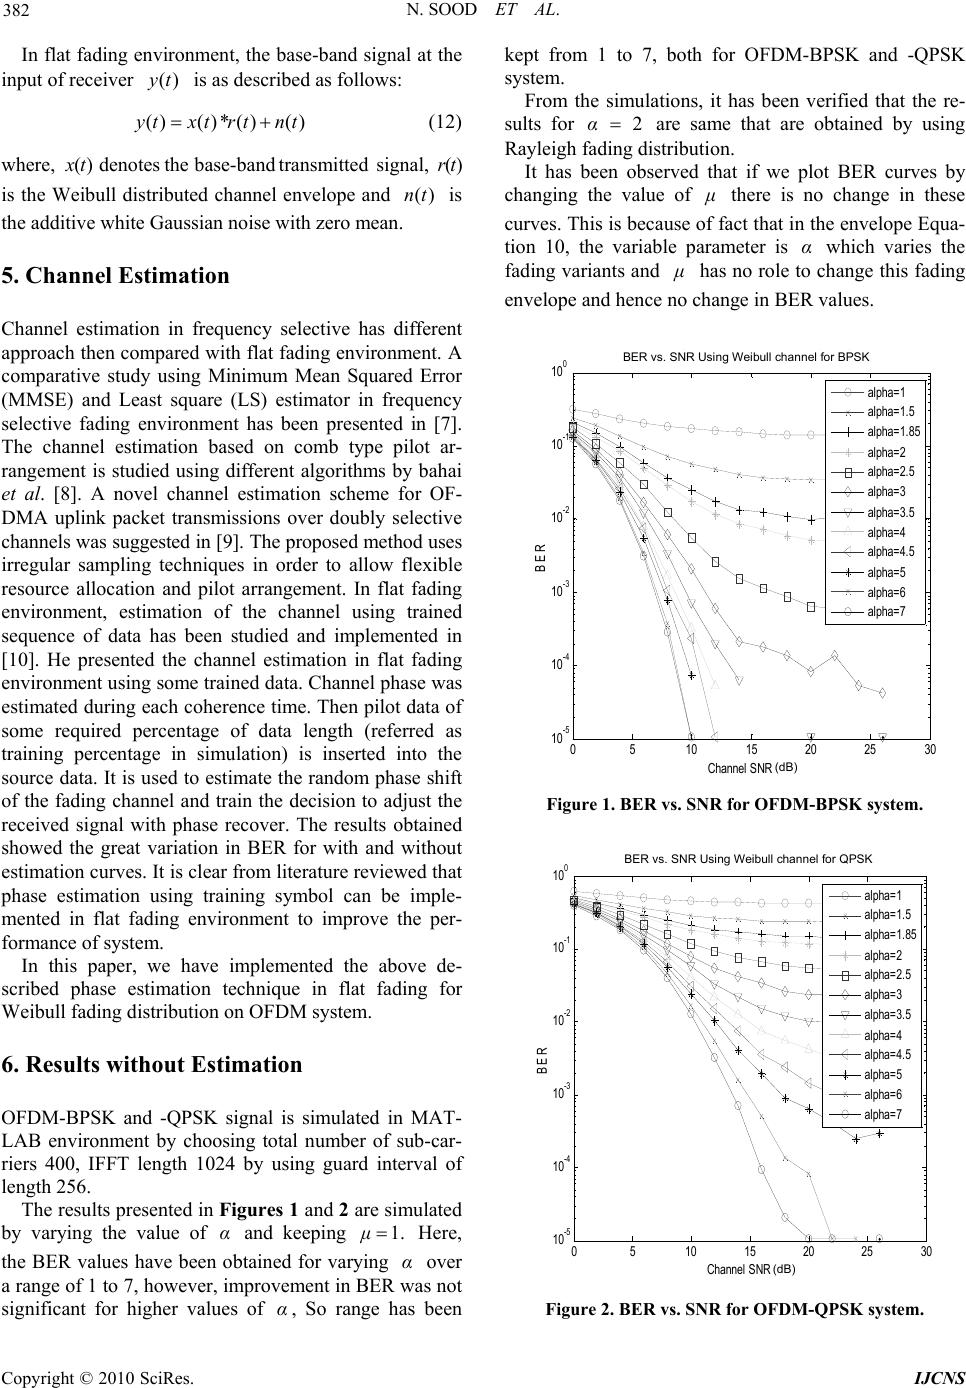 N. SOOD ET AL. 382 In flat fading environment, the base-band signal at the input of receiver is as described as follows: ()yt ()()*() ()yt xtrtnt (12) where, () x t denotes the base-band transmitted signal, is the Weibull distributed channel envelope and is the additive white Gaussian noise with zero mean. ()rt ()nt 5. Channel Estimation Channel estimation in frequency selective has different approach then compared with flat fading environment. A comparative study using Minimum Mean Squared Error (MMSE) and Least square (LS) estimator in frequency selective fading environment has been presented in [7]. The channel estimation based on comb type pilot ar- rangement is studied using different algorithms by bahai et al. [8]. A novel channel estimation scheme for OF- DMA uplink packet transmissions over doubly selective channels was suggested in [9]. The proposed method uses irregular sampling techniques in order to allow flexible resource allocation and pilot arrangement. In flat fading environment, estimation of the channel using trained sequence of data has been studied and implemented in [10]. He presented the channel estimation in flat fading environment using some trained data. Channel phase was estimated during each coherence time. Then pilot data of some required percentage of data length (referred as training percentage in simulation) is inserted into the source data. It is used to estimate the random phase shift of the fading channel and train the decision to adjust the received signal with phase recover. The results obtained showed the great variation in BER for with and without estimation curves. It is clear from literature reviewed that phase estimation using training symbol can be imple- mented in flat fading environment to improve the per- formance of system. In this paper, we have implemented the above de- scribed phase estimation technique in flat fading for Weibull fading distribution on OFDM system. 6. Results without Estimation OFDM-BPSK and -QPSK signal is simulated in MAT- LAB environment by choosing total number of sub-car- riers 400, IFFT length 1024 by using guard interval of length 256. The results presented in Figures 1 and 2 are simulated by varying the value of and keeping Here, the BER values have been obtained for varying over a range of 1 to 7, however, improvement in BER was not significant for higher values of , So range has been kept from 1 to 7, both for OFDM-BPSK and -QPSK system. α1.μ α α From the simulations, it has been verified that the re- sults for 2α are same that are obtained by using Rayleigh fading distribution. It has been observed that if we plot BER curves by changing the value of μ there is no change in these curves. This is because of fact that in the envelope Equa- tion 10, the variable parameter is which varies the fading variants and α μ has no role to change this fading envelope and hence no change in BER values. 05 1015 20 2530 10 -5 10 -4 10 -3 10 -2 10 -1 10 0 Channel SNR (db) BER BER Vs.SNR Using Weibull channel for BPSK alpha=1 alpha=1.5 alpha=1.85 alpha=2 alpha=2.5 alpha=3 alpha=3.5 alpha=4 alpha=4.5 alpha=5 alpha=6 alpha=7 (dB) BER vs. SNR Using Weibull channel for BPSK Figure 1. BER vs. SNR for OFDM-BPSK system. 05 10 1520 25 30 10 -5 10 -4 10 -3 10 -2 10 -1 10 0 Channel SNR (db) BER BER Vs.SNR Using Weibull channel for QPSK alpha=1 alpha=1.5 alpha=1.85 alpha=2 alpha=2.5 alpha=3 alpha=3.5 alpha=4 alpha=4.5 alpha=5 alpha=6 alpha=7 (dB) BER vs. SNR Using Weibull channel for QPSK Figure 2. BER vs. SNR for OFDM-QPSK system. Copyright © 2010 SciRes. IJCNS 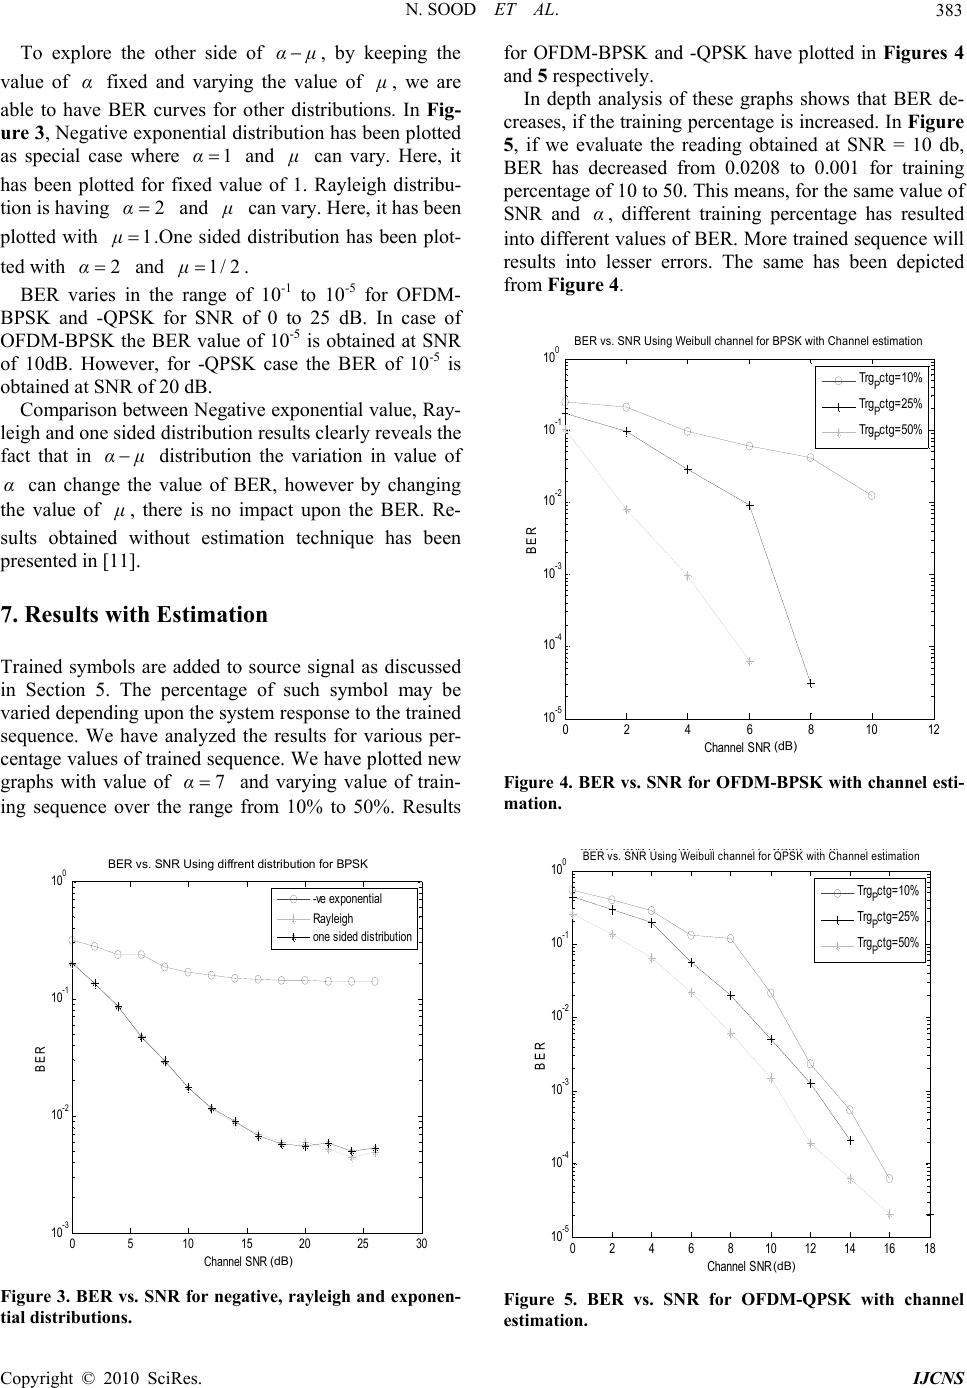 N. SOOD ET AL. 383 To explore the other side of α μ , by keeping the value of fixed and varying the value of α μ , we are able to have BER curves for other distributions. In Fig- ure 3, Negative exponential distribution has been plotted as special case where and 1α μ can vary. Here, it has been plotted for fixed value of 1. Rayleigh distribu- tion is having and 2α μ can vary. Here, it has been plotted with .One sided distribution has been plot- ted with and . 1μ 2 α1/2μ BER varies in the range of 10-1 to 10-5 for OFDM- BPSK and -QPSK for SNR of 0 to 25 dB. In case of OFDM-BPSK the BER value of 10-5 is obtained at SNR of 10dB. However, for -QPSK case the BER of 10-5 is obtained at SNR of 20 dB. Comparison between Negative exponential value, Ray- leigh and one sided distribution results clearly reveals the fact that in α μ distribution the variation in value of can change the value of BER, however by changing the value of α μ , there is no impact upon the BER. Re- sults obtained without estimation technique has been presented in [11]. 7. Results with Estimation Trained symbols are added to source signal as discussed in Section 5. The percentage of such symbol may be varied depending upon the system response to the trained sequence. We have analyzed the results for various per- centage values of trained sequence. We have plotted new graphs with value of and varying value of train- ing sequence over the range from 10% to 50%. Results 7α 05 10152025 30 10 -3 10 -2 10 -1 10 0 Channel SNR (db) BER BER Vs.SNR Using diffrent distribution for BPSK -ve exponential Rayleigh one sided distribution (dB) BER vs. SNR Using diffrent distribution for BPSK Figure 3. BER vs. SNR for negative, rayleigh and exponen- tial distributions. for OFDM-BPSK and -QPSK have plotted in Figures 4 and 5 respectively. In depth analysis of these graphs shows that BER de- creases, if the training percentage is increased. In Figure 5, if we evaluate the reading obtained at SNR = 10 db, BER has decreased from 0.0208 to 0.001 for training percentage of 10 to 50. This means, for the same value of SNR and , different training percentage has resulted into different values of BER. More trained sequence will results into lesser errors. The same has been depicted from Figure 4. α 0 2 46 810 12 10 -5 10 -4 10 -3 10 -2 10 -1 10 0 Channel SNR (db) BER BER Vs.SNR Using Weibull channel for BPSK with Channel estimation Trg P ctg=10% Trg P ctg=25% Trg P ctg=50% (dB) BER vs. SNR Using Weibull channel for BPSK with Channel estimation Figure 4. BER vs. SNR for OFDM-BPSK with channel esti- mation. 024681012 14 1618 10 -5 10 -4 10 -3 10 -2 10 -1 10 0 Channel SNR ( db ) BER BER V s. SNR U s i ng W e ib u ll c h anne l f or QPSK w ith Ch anne l es ti ma ti on TrgP ctg=10% TrgP ctg=25% TrgP ctg=50% (dB) BER vs. SNR Using Weibull channel for QPSK with Channel estimation Figure 5. BER vs. SNR for OFDM-QPSK with channel estimation. C opyright © 2010 SciRes. IJCNS  N. SOOD ET AL. Copyright © 2010 SciRes. IJCNS 384 8. Conclusions This paper, presents performance analysis of OFDM system with generalized fading model of α μ distri- bution with and without estimation. The non-linearity added in propagation medium has been clearly shown in simulated results, since the BER has significantly re- duced by varying from 1 to 7. However, higher val- ues of can be used for further reductions in BER. It is clear from the simulations that the result shows signifi- cant improvement by applying the phase estimation us- ing trained symbols. α α 9. References [1] H. Hashemi, “The Indoor Radio Propagation,” pro- ceedings of IEEE, Vol. 81, No. 7, July 1993, pp. 943-968. [2] D. Zheng, J. L. Cheng and N. C. Beaulieu, “Accurate Error Rate Performance Analysis of OFDM on Frequency Selective Nakagami-m Fadiing Channels,” IEEE Tran- saction on Communications, Vol. 54, No. 2, February 2006, pp. 319-328. [3] Miechel Daoud Yacoub, “The α-µ Distribution: A General Fading Distribution,” 2002, pp. 629-633. [4] J. Malhotra, A. K. Sharma and R. S. Kaler, “On the Performance Analysis of Wireless Receiver Using Gene- Ralized-Gamma Fading Model,” Annals of Telecom- munication Annals Des Telecommunications, Interna- tional Journal, Springer, Vol. 64, No. 1-2, November 2008, pp. 147-153. [5] M. D. Yacoub, “The α-µ Distribution: A Physical Fading Model for the Stacy Distribution,” IEEE Transactions on Vehicular Technology, Vol. 56, No. 1, Janurary 2007, pp 27-34. [6] G. S. Prabhu and P. M. Shankar, “Simulation of Flat Fading Using MATLAB for Classroom Instruction,” IEEE Transaction on Education, Vol. 45, No. 1, February 2002, pp. 19-25. [7] J.-J. van de Beek, O. Edfors, M. Sandell, S. K. Wilson and P. O. B. Rjesson, “On Channel Estimation in OFDM Systems,” Proceedings of Vehicular Technology Confer- ence (VTC Ô95), Chicago, USA, Vol. 2, September 1995, pp. 815-819. [8] S. Coleri, M. Ergen, A. Puri and A. Bahai, “A Study of Channel Estimation in OFDM Systems,” IEEE VTC, Vancouver, Canada, September 2002. [9] P. Fertl and G. Matz, “Multi-User Channel Estimation in OFDMA Uplink Systems Based on Irregular Sampling and Reduced Pilot Overhead,” IEEE ICASSP, Vol. 3, 2007. [10] Z. F. Chen, “Performance Analysis of Channel Esti- mation and Adaptive Equalization in Slow Fading Chan- nel,” University of Florida. http://users.ecel.ufl.edu/~zhi- feng [11] N. Sood, A. K. Sharma and M. uddin, “BER Performance of OFDM-BPSK and -QPSK over Generalized Alpha-Mu Fading Distribution,” IEEE International Advance Com- puting Conference (IACC-2009), Patiala, India, 6-7 March 2009, pp. 1197-1199. |