Paper Menu >>
Journal Menu >>
 Psychology, 2010, 1: 1-8 doi:10.4236/psych.2010.11001 Published Online April 2010 (http://www.SciRP.org/journal/psych) Copyright © 2010 SciRes. PSYCH 1 Psychometric Evaluation of the Perceived Stress Scale in Early Postmenopausal Chinese Women* Ruby Yu, Suzanne C. Ho School of Public Health and Primary Care, the Chinese University of Hong Kong, Hong Kong, China. Email: suzanneho@cuhk.edu.hk Received January 22nd, 2010; revised March 18th, 2010; accepted March 19th, 2010. ABSTRACT Objective: The objective of this study was to examine the psychometric properties of the Perceived Stress Scale (PSS) in a population-based sample of early postmenopausal Chinese women in Hong Kong. Methods: 509 postmenopausal women, 50 to 64 years, recruited from the community through random telephone dialing were interviewed. The inter- view included the PSS, the Center of the Epidemiological Study of Depression Scale (CES-D), the State Trait Anxiety Inventory (STAI), the menopausal symptom checklist, and questions on sociodemographic characteristics and health behaviors. Principle component analysis was used to determine the component structure of the PSS items. The reliabil- ity related to internal consistency was measured by Cronbach’s alpha coefficient and test-retest by intra-class correla- tion coefficients. Construct validity was investigated with subgroup comparisons on the basis of sociodemographic characteristics, and through correlations with the CES-D, the STAI, menopausal symptoms, and health behaviors. Results: Principle component analysis of the PSS showed that the scale consisted of 2 factors, which explained 52% of variance. Internal consistency was adequate (Cronbach’s α = 0.81) and the test-retest reliability after an interval of 2 weeks was 0.86. The PSS distinguished well, and in the expected manner, between subgroups on the basis of age, work status, and marital status, providing evidence of construct validity. The PSS was also correlated with CES-D, STAI, menopausal symptoms, and health behaviors; hence the construct validity was further supported. Conclusions: The PSS appears to be a psychometrically sound instrument for measuring psychological perceived stress for Chinese women in midlife. Keywords: Perceived Stress Scale, Validity, Reliability, Postmenopausal Women, Chinese 1. Introduction Symptoms of psychological stress appear to be increased in midlife women [1] due to life-stage, hormonal, and metabolic changes [2,3]. A number of studies have pro- vided evidence that psychological stress is associated with a broad array of health outcomes, including cardio- vascular morbidity and mortality [4,5], and respiratory infection [6]. Recent studies have also demonstrated that perceived stress is associated with premature death [7] and adversely affects quality of life [8]. As midlife women confront many stressors, particularly during the period soon after menopausal, accurate measurement of psychological perceived stress is essential for better un- derstanding of the susceptibility and treatment of psy- chological distress. The Perceived Stress Scale (PSS) is one of the most widely used instruments for measuring psychological perceived stress. Studies have supported the validity and reliability of the PSS in a variety of samples [9-11]. The PSS has also been shown to relate to a number of physiological responses [12,13]. Nevertheless, the psy- chometric properties of the PSS have yet to be examined in early postmenopausal Chinese women. We addressed this need by examining the factor structure, reliability, and validity of the PSS in a population-based sample of early postmenopausal Chinese women in Hong Kong. 2. Methods 2.1 Subjects The current study was conducted at baseline from 2002 to 2004 as part of a study of subclinical atherosclerosis in early postmenopausal Chinese women in Hong Kong. A detailed description of the sample for the study has been published elsewhere [14]. 518 women aged between 50 to *This work was supported by Direct Grant (2005.1.073) of the Chinese University of Hong Kong and Research Funds from the Centre of Re- search and Promotion of Women’s Health, School of Public Health and Primary care, the Chinese University of Hong Kong.  Psychometric Evaluation of the Perceived Stress Scale in Early Postmenopausal Chinese Women Copyright © 2010 SciRes. PSYCH 2 64 years, and within 10 years since menopause (defined as 12 months since the cessation of the last menses) were recruited through random telephone dialing based on the most recent residential telephone directory. At least 6 at- tempts at different times of the day and week were made for each number before it was considered a non-contact. If more than one postmenopausal woman within the house- hold fell into the targeted age range of 50 to 64 years, the member with the most recent birthday was selected. Women with surgical menopause, cardiovascular disease and severe disease conditions such as cancer and renal failure were excluded. Eligible subjects were invited for a face-to-face interview, clinical assessments, and carotid ultrasound measurements. A response rate of 62.5% was obtained. Seven women who reported taking psychotropic medication within the last 3 months from the date of inter- view, one woman without psychotropic medication data, and another woman without PSS score were excluded, thus leaving 509 subjects for analysis. Furthermore, a ran- dom sub-sample of 25 women were re-interviewed over the telephone for a reliability test with an intervening 2-week interval. All women gave written, informed con- sent and the study was approved by the Ethics Committee of the Chinese University of Hong Kong. 2.2 Measures Standardized interviews assessed sociodemographic characteristics, medical history, use of medications, psy- chological factors, menopausal symptoms, and health behaviors. In the analyses presented below, we focus on sociodemographic characteristics, psychological factors, menopausal symptoms, and health behaviors. Sociodemographic characteristics Several questions were administered to elicit informa- tion about the sociodemographic data including age, household income, education, work status and occupa- tion, as well as marital status. Women actively looking for a job or temporarily not employed because of any reasons were classified as ‘non-working’. Information was also gathered about the year since menopause. Psychological factors Perceived stress was assessed using the PSS which was developed by Cohen [15]. This scale is a self-report meas- ure and the version having used had 10 items [9]. The PSS measures the degree to which individuals perceived their daily life as being stressful during the last month with a 5-point Likert scale (0 = never and 4 = very often). Total scores can range from 0 to 40. Higher scores on the PSS represent higher levels of perceived stress. Depression symptoms were assessed using the Center of the Epidemiological Study of Depression Scale (CES-D) which was developed by Radloff [16] and was locally translated and validated by Cheung et al. [17]. The CES-D is a self-report measure consisting of 20 items, with response options for each item reflecting varying degrees of depression symptoms. Respondents were told that the items constitute a list of ways they may have felt or behaved during the last week, and they indicated the frequency of occurrence of each symptom on a 4-point Likert scale (0 = rarely or none of the time: less than 1 day and 3 = most or all of the time: 5 to 7 days). Total scores can range from 0 to 60. Subjects with scores of 16 or more on the CES-D scale were considered ‘mild depression’. Anxiety was assessed using the State Trait Anxiety Inventory—Form Y (STAI) which was developed by Spielberger et al. [18]. This scale was translated into Chinese by Tsoi et al. [19] and has been successfully employed in measuring anxiety in the Chinese population [20-22]. The STAI comprises of two 20-item self-report scales for which subjects were asked to indicate the temporary condition of state anxiety and the more gen- eral and long-standing quality of trait anxiety on a 4-point Likert scale (1 = not at all and 4 = very much so). Because half of the items reflect the absence of anxiety, the scoring of these items were reversed and responses on all items summed to give a total score ranging from 20 to 80. Scores on the STAI have a direct interpretation: high scores on their respective scales mean more state or trait anxiety and low scores mean less. Menopausal symptoms Menopausal symptoms were assessed using the 20-item symptom checklist adapted from Avis et al. [23] and locally translated by Ho et al. [1]. A binary response was adopted and each woman was asked to respond ‘yes’ or ‘no’ to having had experienced any of the symptom in the past 2 weeks. The symptom checklists comprised of five symptom clusters, namely psychological, muscu- loskeletal and gastrointestinal, non-specific somatic complaints, respiratory, as well as vasomotor. Health behaviors Women were asked to rate their cigarette smoking habits on a scale of never smoked, once smoked but did not anymore, or currently smoke if they smoked 1 or more cigarette per day. Also they were asked about their alcohol intake habits on a scale of never drinkers, infre- quent drinkers, or frequent drinkers (at least once per week). Women were also asked to give information about the usual level of participation in occupational, leisure-time physical activity, sport and exercise, and household activity over the previous 12 months with the modified and locally translated Baecke questionnaire [24,25]. Total hours of sleep per day were extracted from the translated Baecke questionnaire. In addition, women who reported that she had frequently engaged in a given sporting activity / exercise were defined as physically active, and those who infrequently / never engaged were physically inactive. 2.3 Data Analysis Continuous variables were reported as mean and standard deviation. Factor structure was assessed using principle 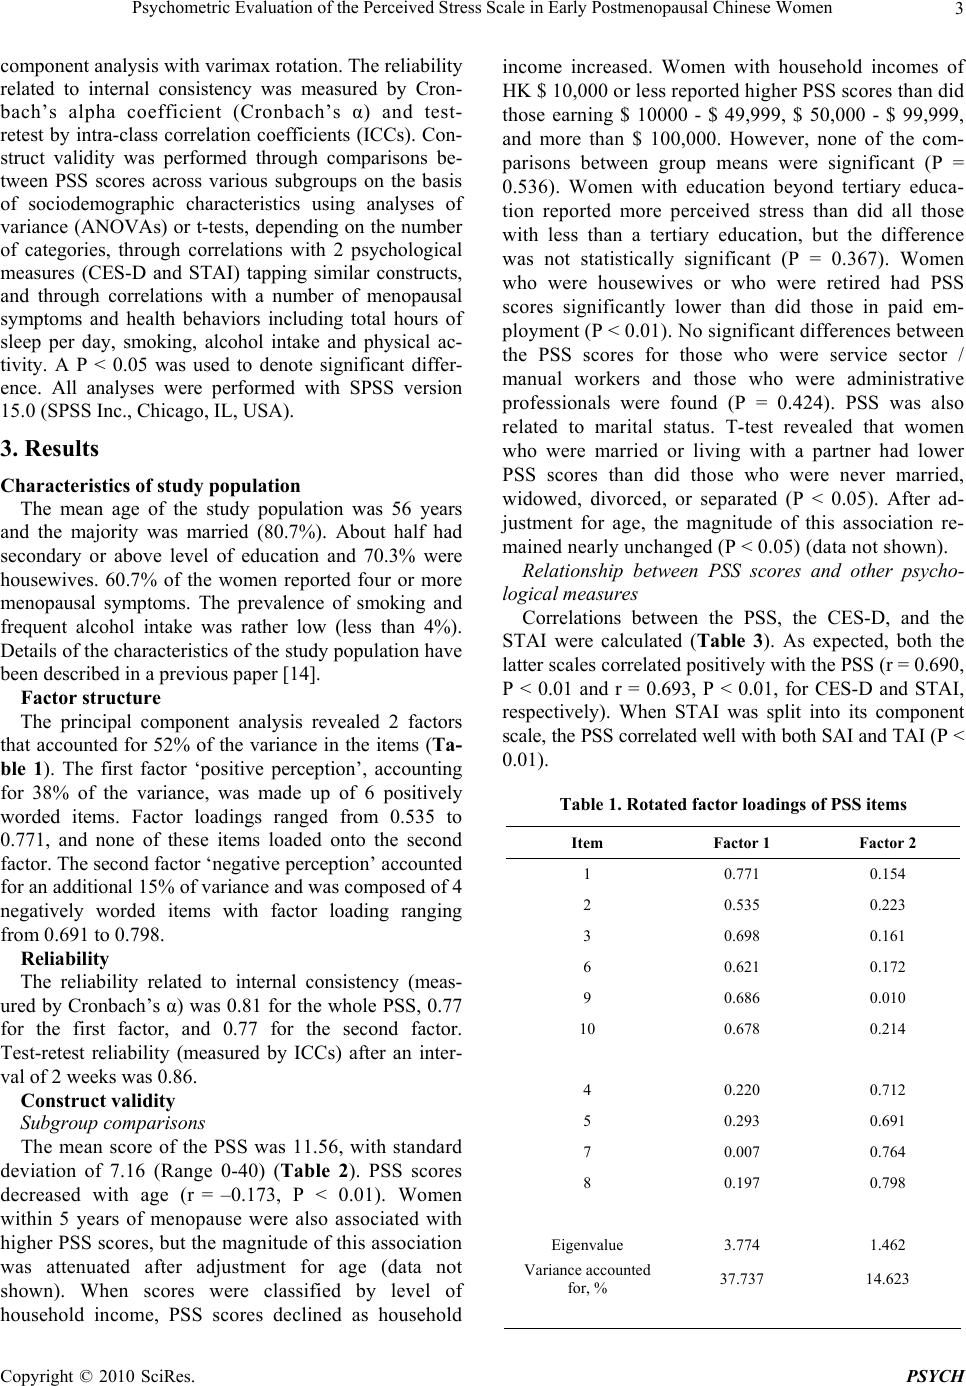 Psychometric Evaluation of the Perceived Stress Scale in Early Postmenopausal Chinese Women Copyright © 2010 SciRes. PSYCH 3 component analysis with varimax rotation. The reliability related to internal consistency was measured by Cron- bach’s alpha coefficient (Cronbach’s α) and test- retest by intra-class correlation coefficients (ICCs). Con- struct validity was performed through comparisons be- tween PSS scores across various subgroups on the basis of sociodemographic characteristics using analyses of variance (ANOVAs) or t-tests, depending on the number of categories, through correlations with 2 psychological measures (CES-D and STAI) tapping similar constructs, and through correlations with a number of menopausal symptoms and health behaviors including total hours of sleep per day, smoking, alcohol intake and physical ac- tivity. A P < 0.05 was used to denote significant differ- ence. All analyses were performed with SPSS version 15.0 (SPSS Inc., Chicago, IL, USA). 3. Results Characteristics of study population The mean age of the study population was 56 years and the majority was married (80.7%). About half had secondary or above level of education and 70.3% were housewives. 60.7% of the women reported four or more menopausal symptoms. The prevalence of smoking and frequent alcohol intake was rather low (less than 4%). Details of the characteristics of the study population have been described in a previous paper [14]. Factor structure The principal component analysis revealed 2 factors that accounted for 52% of the variance in the items (Ta- ble 1). The first factor ‘positive perception’, accounting for 38% of the variance, was made up of 6 positively worded items. Factor loadings ranged from 0.535 to 0.771, and none of these items loaded onto the second factor. The second factor ‘negative perception’ accounted for an additional 15% of variance and was composed of 4 negatively worded items with factor loading ranging from 0.691 to 0.798. Reliability The reliability related to internal consistency (meas- ured by Cronbach’s α) was 0.81 for the whole PSS, 0.77 for the first factor, and 0.77 for the second factor. Test-retest reliability (measured by ICCs) after an inter- val of 2 weeks was 0.86. Construct validity Subgroup comparisons The mean score of the PSS was 11.56, with standard deviation of 7.16 (Range 0-40) (Table 2). PSS scores decreased with age (r = –0.173, P < 0.01). Women within 5 years of menopause were also associated with higher PSS scores, but the magnitude of this association was attenuated after adjustment for age (data not shown). When scores were classified by level of household income, PSS scores declined as household income increased. Women with household incomes of HK $ 10,000 or less reported higher PSS scores than did those earning $ 10000 - $ 49,999, $ 50,000 - $ 99,999, and more than $ 100,000. However, none of the com- parisons between group means were significant (P = 0.536). Women with education beyond tertiary educa- tion reported more perceived stress than did all those with less than a tertiary education, but the difference was not statistically significant (P = 0.367). Women who were housewives or who were retired had PSS scores significantly lower than did those in paid em- ployment (P < 0.01). No significant differences between the PSS scores for those who were service sector / manual workers and those who were administrative professionals were found (P = 0.424). PSS was also related to marital status. T-test revealed that women who were married or living with a partner had lower PSS scores than did those who were never married, widowed, divorced, or separated (P < 0.05). After ad- justment for age, the magnitude of this association re- mained nearly unchanged (P < 0.05) (data not shown). Relationship between PSS scores and other psycho- logical measures Correlations between the PSS, the CES-D, and the STAI were calculated (Table 3). As expected, both the latter scales correlated positively with the PSS (r = 0.690, P < 0.01 and r = 0.693, P < 0.01, for CES-D and STAI, respectively). When STAI was split into its component scale, the PSS correlated well with both SAI and TAI (P < 0.01). Table 1. Rotated factor loadings of PSS items Item Factor 1 Factor 2 1 0.771 0.154 2 0.535 0.223 3 0.698 0.161 6 0.621 0.172 9 0.686 0.010 10 0.678 0.214 4 0.220 0.712 5 0.293 0.691 7 0.007 0.764 8 0.197 0.798 Eigenvalue 3.774 1.462 Variance accounted for, % 37.737 14.623 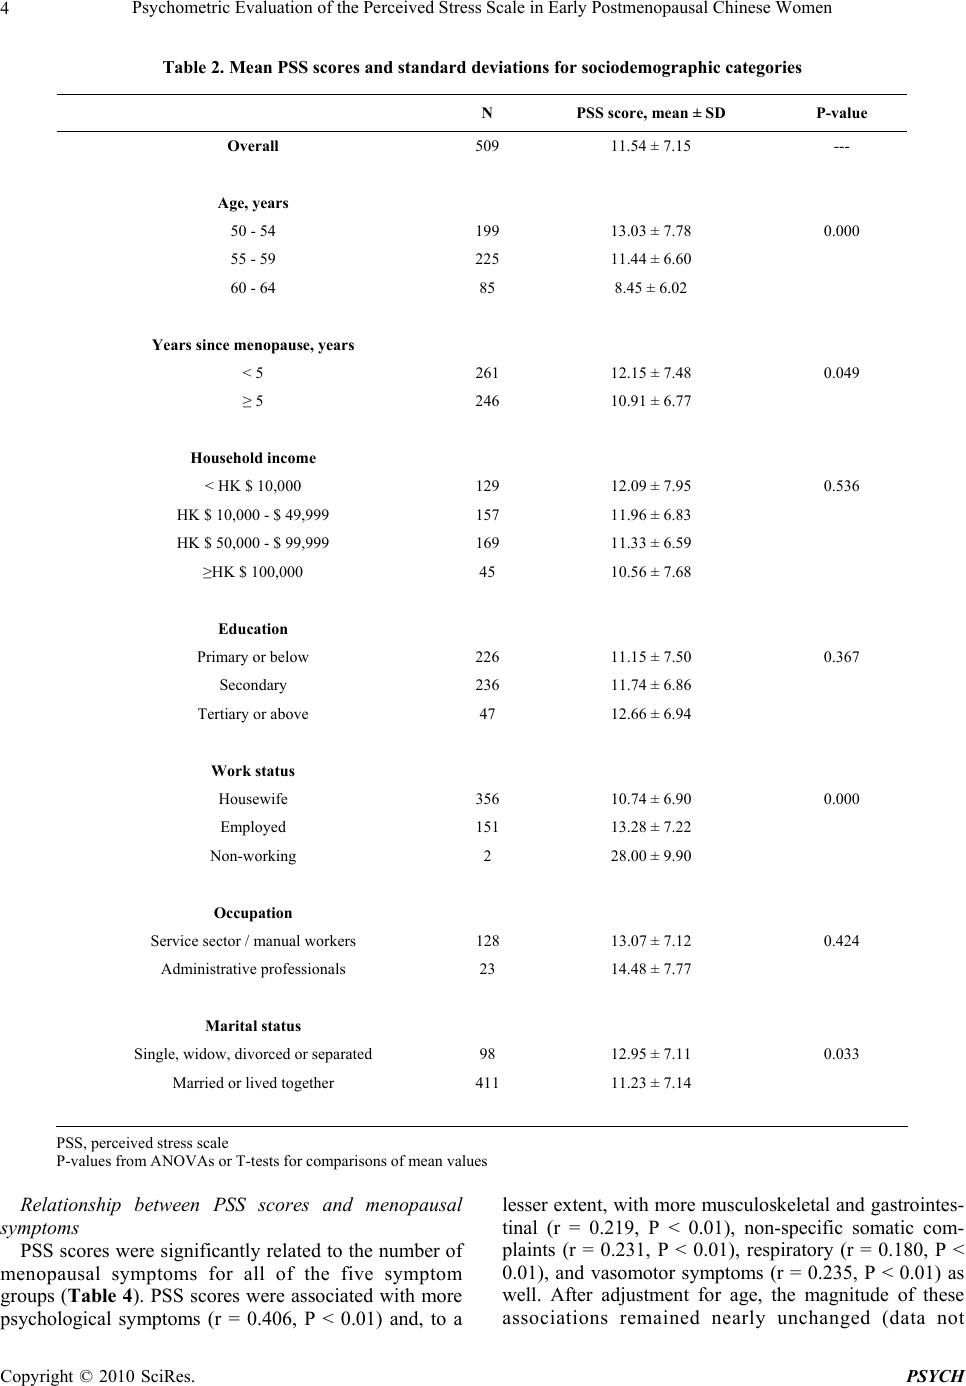 Psychometric Evaluation of the Perceived Stress Scale in Early Postmenopausal Chinese Women Copyright © 2010 SciRes. PSYCH 4 Table 2. Mean PSS scores and standard deviations for sociodemographic categories N PSS score, mean ± SD P-value Overall 509 11.54 ± 7.15 --- Age, years 50 - 54 199 13.03 ± 7.78 0.000 55 - 59 225 11.44 ± 6.60 60 - 64 85 8.45 ± 6.02 Years since menopause, years < 5 261 12.15 ± 7.48 0.049 ≥ 5 246 10.91 ± 6.77 Household income < HK $ 10,000 129 12.09 ± 7.95 0.536 HK $ 10,000 - $ 49,999 157 11.96 ± 6.83 HK $ 50,000 - $ 99,999 169 11.33 ± 6.59 ≥HK $ 100,000 45 10.56 ± 7.68 Education Primary or below 226 11.15 ± 7.50 0.367 Secondary 236 11.74 ± 6.86 Tertiary or above 47 12.66 ± 6.94 Work status Housewife 356 10.74 ± 6.90 0.000 Employed 151 13.28 ± 7.22 Non-working 2 28.00 ± 9.90 Occupation Service sector / manual workers 128 13.07 ± 7.12 0.424 Administrative professionals 23 14.48 ± 7.77 Marital status Single, widow, divorced or separated 98 12.95 ± 7.11 0.033 Married or lived together 411 11.23 ± 7.14 PSS, perceived stress scale P-values from ANOVAs or T-tests for comparisons of mean values Relationship between PSS scores and menopausal symptoms PSS scores were significantly related to the number of menopausal symptoms for all of the five symptom groups (Table 4). PSS scores were associated with more psychological symptoms (r = 0.406, P < 0.01) and, to a lesser extent, with more musculoskeletal and gastrointes- tinal (r = 0.219, P < 0.01), non-specific somatic com- plaints (r = 0.231, P < 0.01), respiratory (r = 0.180, P < 0.01), and vasomotor symptoms (r = 0.235, P < 0.01) as well. After adjustment for age, the magnitude of these associations remained nearly unchanged (data not 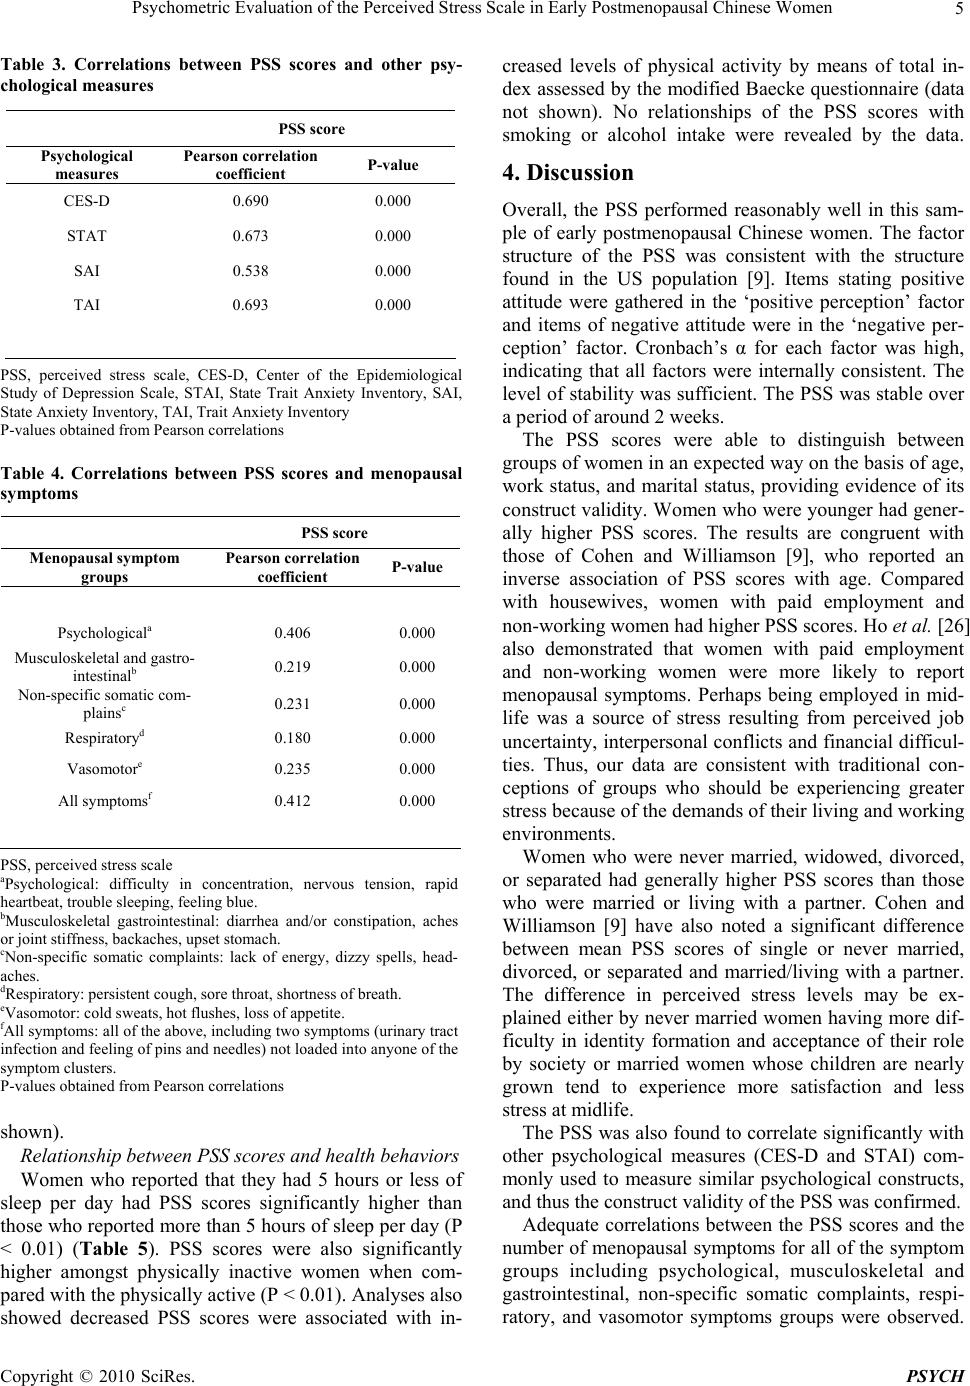 Psychometric Evaluation of the Perceived Stress Scale in Early Postmenopausal Chinese Women Copyright © 2010 SciRes. PSYCH 5 Table 3. Correlations between PSS scores and other psy- chological measures PSS score Psychological measures Pearson correlation coefficient P-value CES-D 0.690 0.000 STAT 0.673 0.000 SAI 0.538 0.000 TAI 0.693 0.000 PSS, perceived stress scale, CES-D, Center of the Epidemiological Study of Depression Scale, STAI, State Trait Anxiety Inventory, SAI, State Anxiety Inventory, TAI, Trait Anxiety Inventory P-values obtained from Pearson correlations Table 4. Correlations between PSS scores and menopausal symptoms PSS score Menopausal symptom groups Pearson correlation coefficient P-value Psychologicala 0.406 0.000 Musculoskeletal and gastro- intestinalb 0.219 0.000 Non-specific somatic com- plainsc 0.231 0.000 Respiratoryd 0.180 0.000 Vasomotore 0.235 0.000 All symptomsf 0.412 0.000 PSS, perceived stress scale aPsychological: difficulty in concentration, nervous tension, rapid heartbeat, trouble sleeping, feeling blue. bMusculoskeletal gastrointestinal: diarrhea and/or constipation, aches or joint stiffness, backaches, upset stomach. cNon-specific somatic complaints: lack of energy, dizzy spells, head- aches. dRespiratory: persistent cough, sore throat, shortness of breath. eVasomotor: cold sweats, hot flushes, loss of appetite. fAll symptoms: all of the above, including two symptoms (urinary tract infection and feeling of pins and needles) not loaded into anyone of the symptom clusters. P-values obtained from Pearson correlations shown). Relationship between PSS scores and health behaviors Women who reported that they had 5 hours or less of sleep per day had PSS scores significantly higher than those who reported more than 5 hours of sleep per day (P < 0.01) (Table 5). PSS scores were also significantly higher amongst physically inactive women when com- pared with the physically active (P < 0.01). Analyses also showed decreased PSS scores were associated with in- creased levels of physical activity by means of total in- dex assessed by the modified Baecke questionnaire (data not shown). No relationships of the PSS scores with smoking or alcohol intake were revealed by the data. 4. Discussion Overall, the PSS performed reasonably well in this sam- ple of early postmenopausal Chinese women. The factor structure of the PSS was consistent with the structure found in the US population [9]. Items stating positive attitude were gathered in the ‘positive perception’ factor and items of negative attitude were in the ‘negative per- ception’ factor. Cronbach’s α for each factor was high, indicating that all factors were internally consistent. The level of stability was sufficient. The PSS was stable over a period of around 2 weeks. The PSS scores were able to distinguish between groups of women in an expected way on the basis of age, work status, and marital status, providing evidence of its construct validity. Women who were younger had gener- ally higher PSS scores. The results are congruent with those of Cohen and Williamson [9], who reported an inverse association of PSS scores with age. Compared with housewives, women with paid employment and non-working women had higher PSS scores. Ho et al. [26] also demonstrated that women with paid employment and non-working women were more likely to report menopausal symptoms. Perhaps being employed in mid- life was a source of stress resulting from perceived job uncertainty, interpersonal conflicts and financial difficul- ties. Thus, our data are consistent with traditional con- ceptions of groups who should be experiencing greater stress because of the demands of their living and working environments. Women who were never married, widowed, divorced, or separated had generally higher PSS scores than those who were married or living with a partner. Cohen and Williamson [9] have also noted a significant difference between mean PSS scores of single or never married, divorced, or separated and married/living with a partner. The difference in perceived stress levels may be ex- plained either by never married women having more dif- ficulty in identity formation and acceptance of their role by society or married women whose children are nearly grown tend to experience more satisfaction and less stress at midlife. The PSS was also found to correlate significantly with other psychological measures (CES-D and STAI) com- monly used to measure similar psychological constructs, and thus the construct validity of the PSS was confirmed. Adequate correlations between the PSS scores and the number of menopausal symptoms for all of the symptom groups including psychological, musculoskeletal and gastrointestinal, non-specific somatic complaints, respi- ratory, and vasomotor symptoms groups were observed. 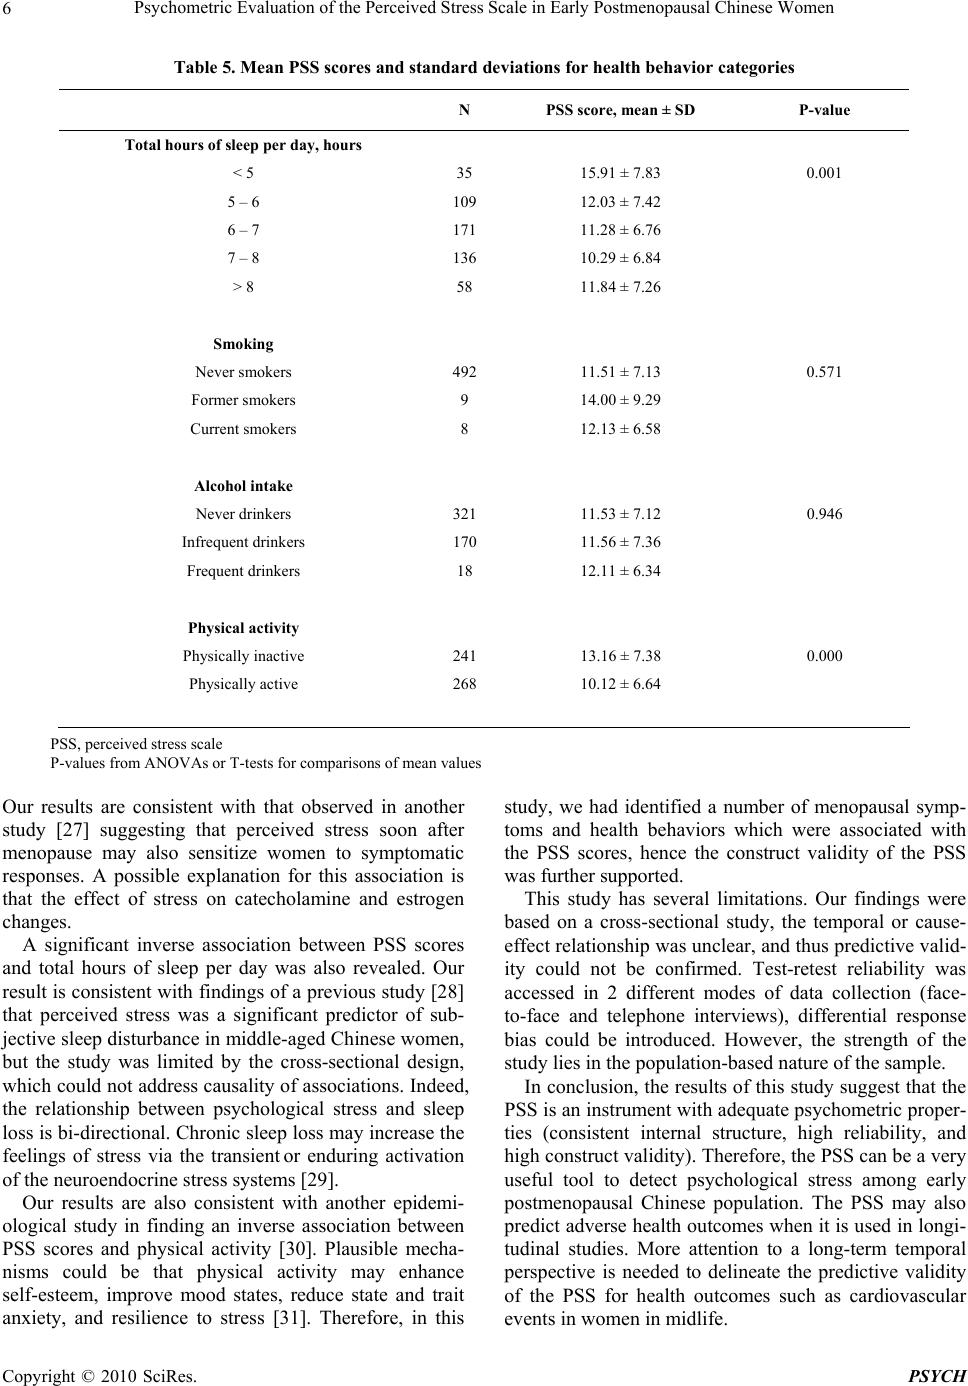 Psychometric Evaluation of the Perceived Stress Scale in Early Postmenopausal Chinese Women Copyright © 2010 SciRes. PSYCH 6 Table 5. Mean PSS scores and standard de viations for health behavior categories N PSS score, mean ± SD P-value Total hours of sleep per day, hours < 5 35 15.91 ± 7.83 0.001 5 – 6 109 12.03 ± 7.42 6 – 7 171 11.28 ± 6.76 7 – 8 136 10.29 ± 6.84 > 8 58 11.84 ± 7.26 Smoking Never smokers 492 11.51 ± 7.13 0.571 Former smokers 9 14.00 ± 9.29 Current smokers 8 12.13 ± 6.58 Alcohol intake Never drinkers 321 11.53 ± 7.12 0.946 Infrequent drinkers 170 11.56 ± 7.36 Frequent drinkers 18 12.11 ± 6.34 Physical activity Physically inactive 241 13.16 ± 7.38 0.000 Physically active 268 10.12 ± 6.64 PSS, perceived stress scale P-values from ANOVAs or T-tests for comparisons of mean values Our results are consistent with that observed in another study [27] suggesting that perceived stress soon after menopause may also sensitize women to symptomatic responses. A possible explanation for this association is that the effect of stress on catecholamine and estrogen changes. A significant inverse association between PSS scores and total hours of sleep per day was also revealed. Our result is consistent with findings of a previous study [28] that perceived stress was a significant predictor of sub- jective sleep disturbance in middle-aged Chinese women, but the study was limited by the cross-sectional design, which could not address causality of associations. Indeed, the relationship between psychological stress and sleep loss is bi-directional. Chronic sleep loss may increase the feelings of stress via the transient or enduring activation of the neuroendocrine stress systems [29]. Our results are also consistent with another epidemi- ological study in finding an inverse association between PSS scores and physical activity [30]. Plausible mecha- nisms could be that physical activity may enhance self-esteem, improve mood states, reduce state and trait anxiety, and resilience to stress [31]. Therefore, in this study, we had identified a number of menopausal symp- toms and health behaviors which were associated with the PSS scores, hence the construct validity of the PSS was further supported. This study has several limitations. Our findings were based on a cross-sectional study, the temporal or cause- effect relationship was unclear, and thus predictive valid- ity could not be confirmed. Test-retest reliability was accessed in 2 different modes of data collection (face- to-face and telephone interviews), differential response bias could be introduced. However, the strength of the study lies in the population-based nature of the sample. In conclusion, the results of this study suggest that the PSS is an instrument with adequate psychometric proper- ties (consistent internal structure, high reliability, and high construct validity). Therefore, the PSS can be a very useful tool to detect psychological stress among early postmenopausal Chinese population. The PSS may also predict adverse health outcomes when it is used in longi- tudinal studies. More attention to a long-term temporal perspective is needed to delineate the predictive validity of the PSS for health outcomes such as cardiovascular events in women in midlife.  Psychometric Evaluation of the Perceived Stress Scale in Early Postmenopausal Chinese Women Copyright © 2010 SciRes. PSYCH 7 5. Acknowledgment We wish to thank all subjects for their participation. REFERENCES [1] S. C. Ho, S. G. Chan, Y. B. Yip, A. Cheng, Q. Yi and C. Chan, “Menopausal Symptoms and Symptom Clustering in Chinese Women,” Maturitas, Vol. 33, No. 3, Decem- ber 1999, pp. 219-227. [2] S. M. McKinlay, D. J. Brambilla and J. G. Posner, “The Normal Menopause Transition,” Maturitas, Vol. 14, No. 2, January 1992, pp. 103-115. [3] J. W. Eckert and S. C. Shulman, “Daughters Caring for their Aging Mothers a Midlife Developmental Process,” Journal of Gerontological Social Work, Vol. 25, 1996, pp. 17-32. [4] H. Iso, C. Date, A. Yamamoto, H. Toyoshima, N. Tanabe, S. Kikuchi, et al., “Perceived Mental Stress and Mortality from Cardiovascular Disease among Japanese Men and Women: The Japan Collaborative Cohort Study for Evaluation of Cancer Risk Sponsored by Monbusho (JACC Study),” Circulation, Vol. 106, No. 10, September 2002, pp. 1229-1236. [5] M. Hamer, G. J. Molloy and E. Stamatakis, “Psychologi- cal Distress as a Risk Factor for Cardiovascular Events: Pathophysiological and Behavioral Mechanisms,” Jour- nal of the American College of Cardiology, Vol. 52, No. 25, December 2008, pp. 2156-2162. [6] S. Cohen, D. A. Tyrrell and A. P. Smith, “Psychological Stress and Susceptibility to the Common Cold,” New England Journal of Medicine, Vol. 325, No. 9, August 1991, pp. 606-612. [7] N. R. Nielsen, T. S. Kristensen, P. Schnohr and M. Gron- baek, “Perceived Stress and Cause-Specific Mortality among Men and Women: Results from a Prospective Cohort Study,” American Journal of Epidemiology, Vol. 168, No. 5, September 2008, pp. 481-491. [8] A. Steptoe and M. Marmot, “Burden of Psychosocial Adversity and Vulnerability in Middle Age: Associations with Biobehavioral Risk Factors and Quality of Life,” Psy- chosomatic Medicine, Vol. 65, No. 6, November-December 2003, pp. 1029-1037. [9] S. Cohen and G. M. Williamson, “Perceived Stress in a Probability Sample of the United States,” In S. Spacapan and S. Oskamp, Eds., The Social Psychology of Health, Newbury Park, Sage, California, 1988, pp. 31-67. [10] C. Mimura and P. Griffiths, “A Japanese Version of the Perceived Stress Scale: Translation and Preliminary Test,” International Journal of Nursing Studies, Vol. 41, No. 4, May 2004, pp. 379-385. [11] E. Remor, “Psychometric Properties of a European Span- ish Version of the Perceived Stress Scale (PSS),” Spanish Journal of Psychology, Vol. 9, No. 1, May 2006, pp. 86-93. [12] C. Song, G. Kenis, A. van Gastel, E. Bosmans, A. Lin, R. de Jong, et al., “Influence of Psychological Stress on Immune-Inflammatory Variables in Normal Humans. Part II. Altered Serum Concentrations of Natural Anti-In- flammatory Agents and Soluble Membrane Antigens of Monocytes and T Lymphocytes,” Psychiatry Research, Vol. 85, No. 3, March 1999, pp. 293-303. [13] V. E. Burns, M. Drayson, C. Ring and D. Carroll, “Per- ceived Stress and Psychological Well-Being are Associ- ated with Antibody Status after Meningitis C Conjugate Vaccination,” Psychosomatic Medicine, Vol. 64, No. 6, November-December 2002, pp. 963-970. [14] H. Y. Yu, S. C. Ho, S. Y. Ho, S. G. Chan, J. Woo and A. T. Ahuja, “Carotid Atherosclerosis and the Risk Factors in Early Postmenopausal Chinese Women,” Maturitas, Vol. 63, No. 3, July 2009, pp. 233-239. [15] S. Cohen, T. Kamarck and R. Mermelstein, “A Global Measure of Perceived Stress,” Journal of Health and Social Behavior, Vol. 24, No. 4, December 1983, pp. 385-396. [16] L. S. Radloff, “The CES-D Scale: A Self-Report Depres- sion Scale for Research in the General Population,” Ap- plied Psyhological Measurement, Vol. 1, 1977, pp. 385-401. [17] C. K. Cheung and C. Bagley, “Validating an American Scale in Hong Kong: The Center for Epidemiological Studies Depression Scale (CES-D),” Journal of Psychol- ogy, Vol. 132, No. 2, March 1998, pp. 169-186. [18] C. D. Spielberger, R. L. Gorsuch and R. E. Luschene, “State Trait Anxiety Inventory: A Test Manual/Test Form,” Consulting Psychologists Press, Palo Alto, CA, 1970. [19] M. Tsoi, E. Ho and K. Mak, “Becoming Pregnant Again after Stillbirth or the Birth of a Handicapped Child,” In: L. Dennerstein and I. Fraser, Eds., Hormone and Behavior, Elsevier Science, 1986, pp. 310-316. [20] D. T. Shek, “Reliability and Factorial Structure of the Chinese Version of the Purpose in Life Questionnaire,” Journal of Clinical Psychology, Vol. 44, No. 3, May 1988, pp. 384-392. [21] D. T. Shek, “The Factorial Structure of the Chinese Ver- sion of the State Trait Anxiety Inventory: A Confirmatory Factor Analysis,” Educational and Psychological Meas- urement, Vol. 51, 1991, pp. 985-999. [22] D. T. Shek, “The Chinese Version of the State-Trait Anxiety Inventory: Its Relationship to Different Measures of Psychological Well-Being,” Journal of Clinical Psy- chology, Vol. 49, No. 3, May 1993, pp. 349-358. [23] N. E. Avis, P. A. Kaufert, M. Lock, S. M. McKinlay and K. Vass, “The Evolution of Menopausal Symptoms,” Baillieres Clinical Endocrinology and Metabolism, Vol. 7, No. 1, January 1993, pp. 17-32. [24] J. A. Baecke, J. Burema and J. E. Frijters, “A Short Ques- tionnaire for the Measurement of Habitual Physical Ac- tivity in Epidemiological Studies,” American Journal of Clinical Nutrition, Vol. 36, No. 5, November 1982, pp. 936-942. [25] S. C. Ho and S. G. Chan, “Habitual Physical Activity, Health Fitness and Behavior in Hong Kong Adults,” Health Services Research Committee Report 216102, Hos-  Psychometric Evaluation of the Perceived Stress Scale in Early Postmenopausal Chinese Women Copyright © 2010 SciRes. PSYCH 8 pital Authority, Hong Kong, 2002. [26] S. C. Ho, S. G. Chan, Y. B. Yip, S. Y. Chan and A. Sham, “Factors Associated with Menopausal Symptom Report- ing in Chinese Midlife Women,” Maturitas, Vol. 44, No. 2, February 2003, pp. 149-156. [27] M. S, Hunter, “Predictors of Menopausal Symptoms: Psychosocial Aspects,” Baillieres Clinical Endocrinology and Metabolism, Vol. 7, No. 1, January 1993, pp. 33-45. [28] K. F. Chung and M. K. Tang, “Subjective Sleep Distur- bance and Its Correlates in Middle-Aged Hong Kong Chinese Women,” Maturitas, Vol. 53, No. 4, March 2006, pp. 396-404. [29] P. Meerlo, A. Sgoifo and D. Suchecki, “Restricted and Disrupted Sleep: Effects on Autonomic Function, Neuro- endocrine Stress Systems and Stress Responsivity,” Sleep Medicine Reviews, Vol. 12, No. 3, June 2008, pp. 197-210. [30] P. Schnohr, T. S. Kristensen, E. Prescott and H. Scharling, “Stress and Life Dissatisfaction are Inversely Associated with Jogging and Other Types of Physical Activity in Leisure Time––The Copenhagen City Heart Study,” Scandinavian Journal of Medicine and Science in Sports, Vol. 15, No. 2, April 2005, pp. 107-112. [31] K. R. Fox, “The Influence of Physical Activity on Mental Well-Being,” Public Health Nutrition, Vol. 2, No. 3A, September 1999, pp. 411-418. |