Paper Menu >>
Journal Menu >>
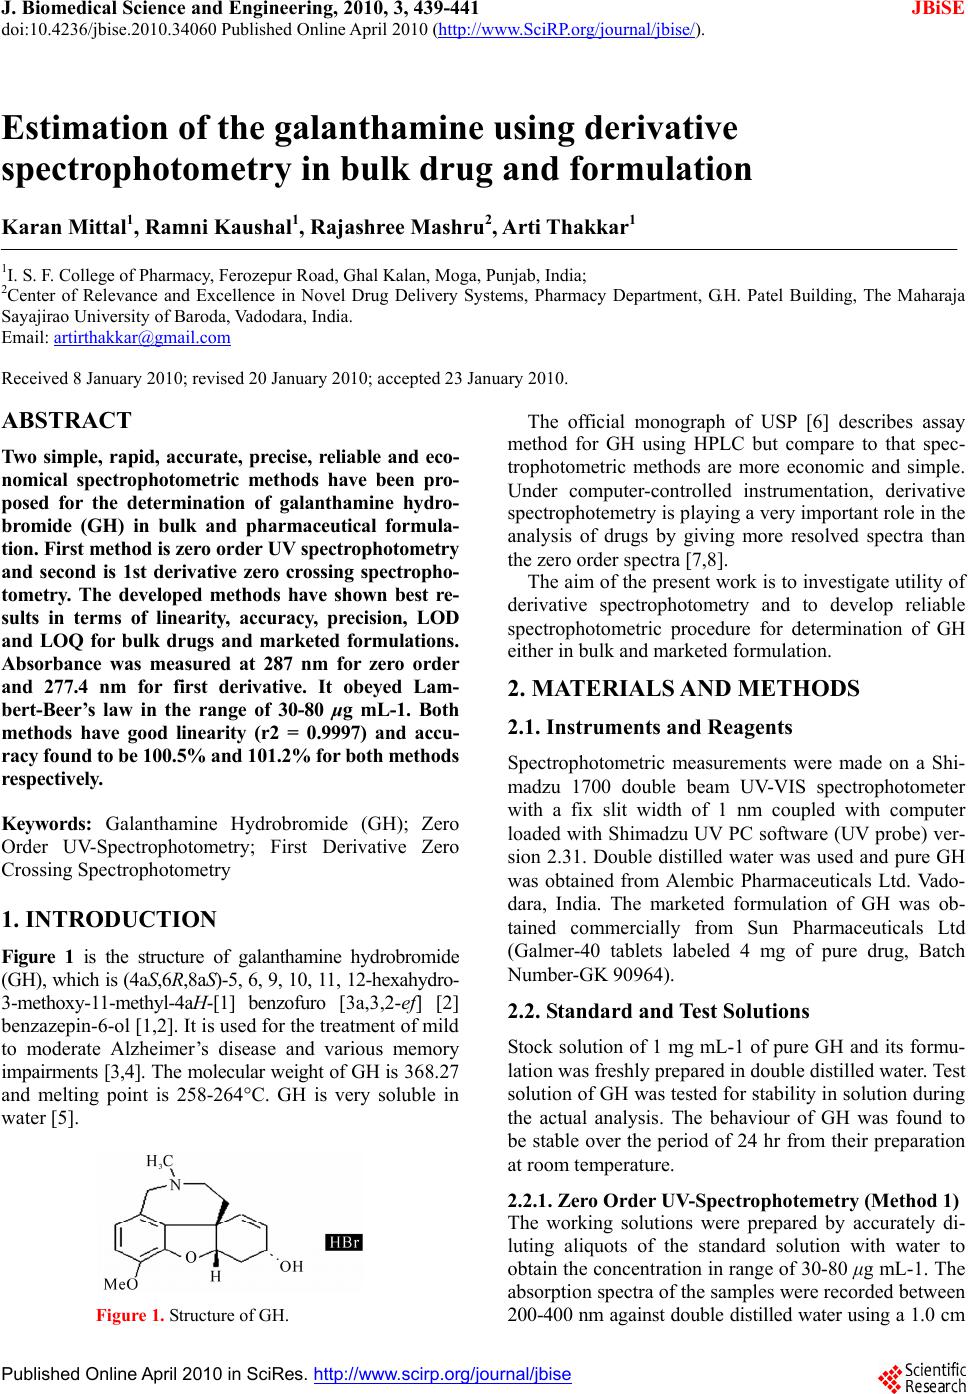 J. Biomedical Science and Engineering, 2010, 3, 439-441 JBiSE doi:10.4236/jbise.2010.34060 Published Online April 2010 (http://www.SciRP.org/journal/jbise/). Published Online April 2010 in SciRes. http://www.scirp.org/journal/jbise Estimation of the galanthamine using derivative spectrophotometry in bulk drug and formulation Karan Mittal1, Ramni Kaushal1, Rajashree Mashru2, Arti Thakkar1 1I. S. F. College of Pharmacy, Ferozepur Road, Ghal Kalan, Moga, Punjab, India; 2Center of Relevance and Excellence in Novel Drug Delivery Systems, Pharmacy Department, G.H. Patel Building, The Maharaja Sayajirao University of Baroda, Vadodara, India. Email: artirthakkar@gmail.com Received 8 January 2010; revised 20 January 2010; accepted 23 January 2010. ABSTRACT Two simple, rapid, accurate, precise, reliable and eco- nomical spectrophotometric methods have been pro- posed for the determination of galanthamine hydro- bromide (GH) in bulk and pharmaceutical formula- tion. First method is zero order UV spectrophotometry and second is 1st derivative zero crossing spectropho- tometry. The developed methods have shown best re- sults in terms of linearity, accuracy, precision, LOD and LOQ for bulk drugs and marketed formulations. Absorbance was measured at 287 nm for zero order and 277.4 nm for first derivative. It obeyed Lam- bert-Beer’s law in the range of 30-80 μg mL-1. Both methods have good linearity (r2 = 0.9997) and accu- racy found to be 100.5% and 101.2% for both methods respectively. Keywords: Galanthamine Hydrobromide (GH); Zero Order UV-Spectrophotometry; First Derivative Zero Crossing Spectrophotometry 1. INTRODUCTION Figure 1 is the structure of galanthamine hydrobromide (GH), which is (4 aS,6R,8aS)-5, 6, 9, 10, 11, 12-hexahydro- 3-methoxy-11-methyl-4aH-[1] benzofuro [3a,3,2-ef] [2] benzazepin-6-ol [1,2]. It is used for the treatment of mild to moderate Alzheimer’s disease and various memory impairmen ts [3,4]. The mo lecular weight of GH is 3 68. 27 and melting point is 258-264°C. GH is very soluble in water [5]. Figure 1. Structure of GH. The official monograph of USP [6] describes assay method for GH using HPLC but compare to that spec- trophotometric methods are more economic and simple. Under computer-controlled instrumentation, derivative spectrophotemetry is playing a very importan t role in the analysis of drugs by giving more resolved spectra than the zero or der spect ra [7,8]. The aim of the present work is to investigate u tility of derivative spectrophotometry and to develop reliable spectrophotometric procedure for determination of GH either in bulk and marketed formulation. 2. MATERIALS AND METHODS 2.1. Instruments and Reagents Spectrophotometric measurements were made on a Shi- madzu 1700 double beam UV-VIS spectrophotometer with a fix slit width of 1 nm coupled with computer loaded with Shimadzu UV PC software (UV probe) ver- sion 2.31. Double distilled water was used and pure GH was obtained from Alembic Pharmaceuticals Ltd. Vado- dara, India. The marketed formulation of GH was ob- tained commercially from Sun Pharmaceuticals Ltd (Galmer-40 tablets labeled 4 mg of pure drug, Batch Number-GK 90964). 2.2. Standard and Test Solutions Stock solution of 1 mg mL-1 of pure GH and its formu- lation was freshly prepared in double distilled water. Test solution of GH was tested for stability in solution during the actual analysis. The behaviour of GH was found to be stable over the period of 24 hr from their preparation at room temperature. 2.2.1. Zero Order UV-Spectrophotemetry (M ethod 1) The working solutions were prepared by accurately di- luting aliquots of the standard solution with water to obtain the concen tration in range of 30-80 μg mL-1. The absorption spectra of the samples were recorded between 200-400 nm against double distilled water using a 1.0 cm 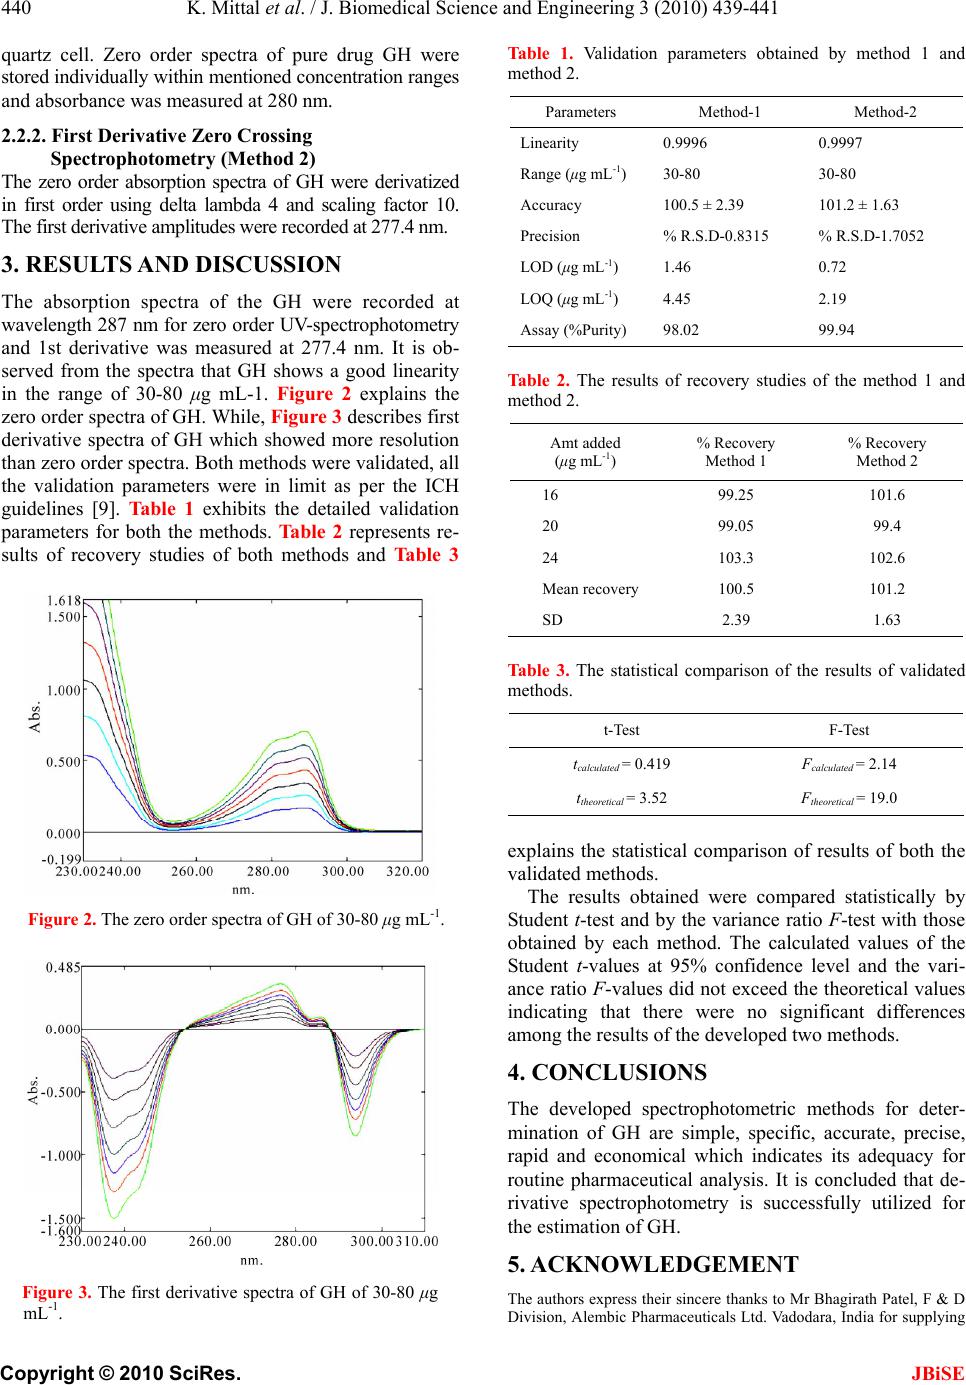 K. Mittal et al. / J. Biomedical Science and Engineering 3 (2010) 439-441 Copyright © 2010 SciRes. JBiSE 440 quartz cell. Zero order spectra of pure drug GH were stored individually within mentioned concentration ranges and absorbance was measured at 280 nm. 2.2.2. First Derivative Zero Crossing Spectrophotometry (Method 2) The zero order absorption spectra of GH were derivatized in first order using delta lambda 4 and scaling factor 10. The first derivative amplitudes were recorded at 277.4 nm. 3. RESULTS AND DISCUSSION The absorption spectra of the GH were recorded at wavelength 287 nm for zero order UV-spectrophotometry and 1st derivative was measured at 277.4 nm. It is ob- served from the spectra that GH shows a good linearity in the range of 30-80 μg mL-1. Figure 2 explains the zero order spectra of GH. While, Figure 3 describes first derivative spectra of GH which showed more resolution than zero order spectra. Both methods were validated, all the validation parameters were in limit as per the ICH guidelines [9]. Table 1 exhibits the detailed validation parameters for both the methods. Tabl e 2 represents re- sults of recovery studies of both methods and Table 3 Figure 2. The zero order spectra of GH of 30-80 μg mL-1. Figure 3. The first derivative spectra of GH of 30-80 μg mL-1. Table 1. Validation parameters obtained by method 1 and method 2. Parameters Method-1 Method-2 Linearity 0.9996 0.9997 Range (μg mL-1) 30-80 30-80 Accuracy 100.5 ± 2.39 101.2 ± 1.63 Precision % R.S.D-0.831 5 % R.S.D-1.705 2 LOD (μg mL-1) 1.46 0.72 LOQ (μg mL-1) 4.45 2.19 Assay (%Purity) 98.02 99.94 Tabl e 2. The results of recovery studies of the method 1 and method 2. Amt added (μg mL-1) % Recovery Method 1 % Recovery Method 2 16 99.25 101.6 20 99.05 99.4 24 103.3 102.6 Mean recovery 100.5 101.2 SD 2.39 1.63 Ta ble 3. The statistical comparison of the results of validated methods. t-Test F-Test tcalculated = 0.419 Fcalculated = 2.14 ttheoretical = 3.52 Ftheoretical = 19.0 explains the statistical comparison of results of both the validated methods. The results obtained were compared statistically by Student t-test and by the variance ratio F-test with those obtained by each method. The calculated values of the Student t-values at 95% confidence level and the vari- ance ratio F-values did not exceed the theoretical values indicating that there were no significant differences among the results of the developed two methods. 4. CONCLUSIONS The developed spectrophotometric methods for deter- mination of GH are simple, specific, accurate, precise, rapid and economical which indicates its adequacy for routine pharmaceutical analysis. It is concluded that de- rivative spectrophotometry is successfully utilized for the estimation of GH. 5. ACKNOWLEDGEMENT The authors express their sincere thanks to Mr Bhagirath Patel, F & D Division, Alembic Pharmaceuticals Ltd. Vadodara, India for supplying 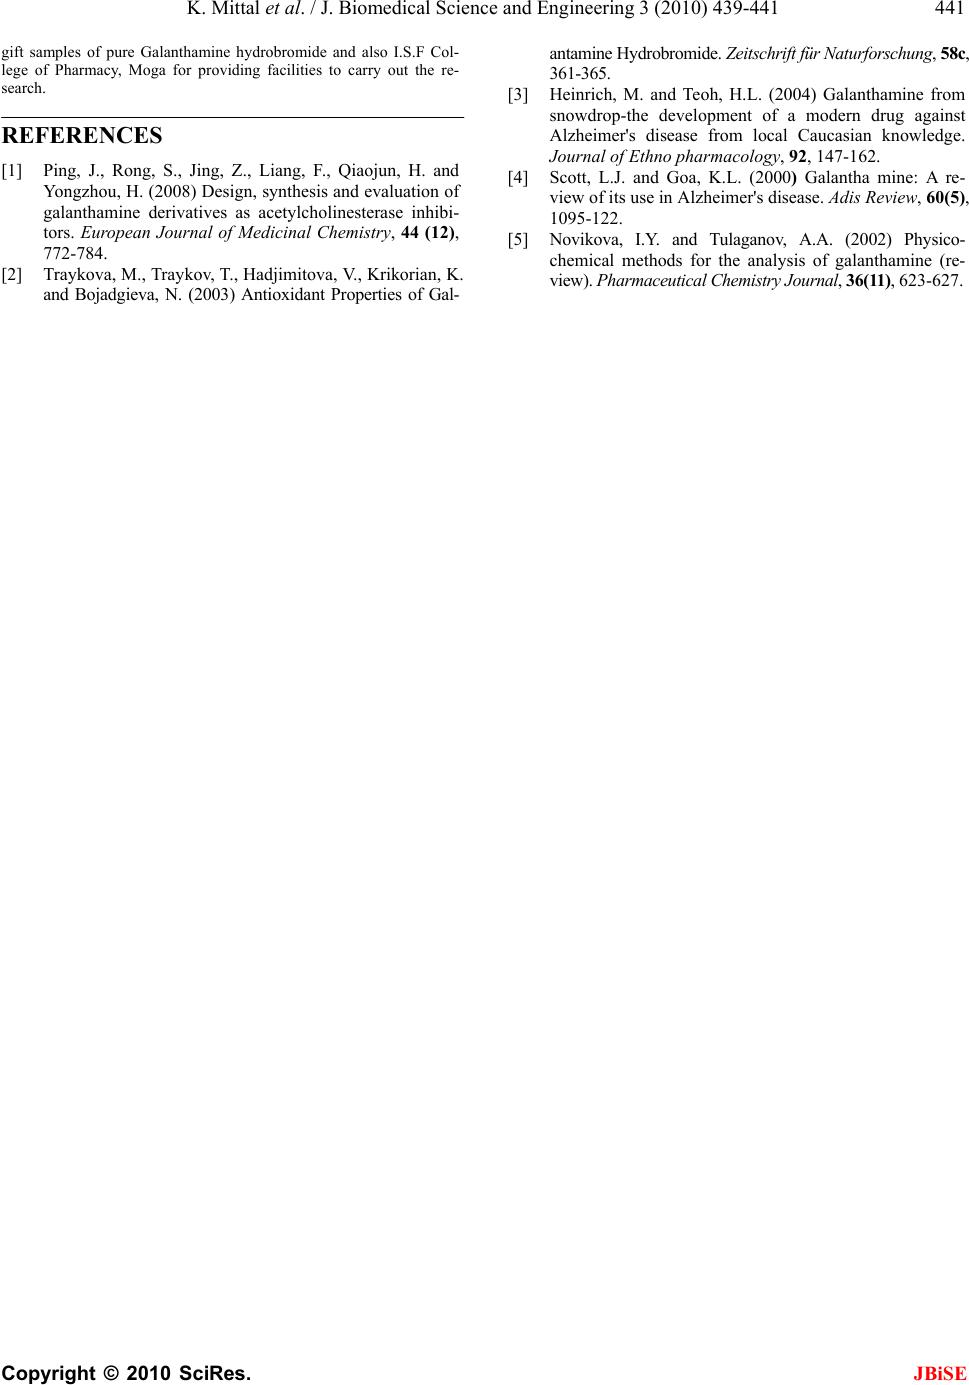 K. Mittal et al. / J. Biomedical Science and Engineering 3 (2010) 439-441 Copyright © 2010 SciRes. JBiSE 441 gift samples of pure Galanthamine hydrobromide and also I.S.F Col- lege of Pharmacy, Moga for providing facilities to carry out the re- search. REFERENCES [1] Ping, J., Rong, S., Jing, Z., Liang, F., Qiaojun, H. and Yongzhou, H. (2008) Design, synthesis and evaluation of galanthamine derivatives as acetylcholinesterase inhibi- tors. European Journal of Medicinal Chemistry, 44 (12), 772-784. [2] Traykova, M., Traykov, T., Hadjimitova, V., Krikorian, K. and Bojadgieva, N. (2003) Antioxidant Properties of Gal- antamine Hydrobromide. Zeitschrift für Naturforschung, 58c, 361-365. [3] Heinrich, M. and Teoh, H.L. (2004) Galanthamine from snowdrop-the development of a modern drug against Alzheimer's disease from local Caucasian knowledge. Journal of Ethno pharmacology, 92, 147-162. [4] Scott, L.J. and Goa, K.L. (2000) Galantha mine: A re- view of its use in Alzheimer's disease. Adis Review, 60(5), 1095-122. [5] Novikova, I.Y. and Tulaganov, A.A. (2002) Physico- chemical methods for the analysis of galanthamine (re- view). Pharmaceutical Chemistry Journal, 36(11), 623-627 . |