Paper Menu >>
Journal Menu >>
 J. Biomedical Science and Engineering, 2010, 3, 390-396 JBiSE doi:10.4236/jbise.2010.34054 Published Online April 2010 (http://www.SciRP.org/journal/jbise/). Published Online April 2010 in SciRes. http://www.scirp.org/journal/jbise Classification of human emotion from EEG using discrete wavelet transform Murugappan Murugappan, Nagarajan Ramachandran, Yaacob Sazali School of Mechatronic Engineering, Universiti Malaysia Perlis (UniMAP), Perlis, Malaysia. Email: murugappan@unimap.edu.my Received 21 November 2009; revised 28 December 2009; accepted 4 February 2010. ABSTRACT In this paper, we summarize the human emotion rec- ognition using different set of electroencephalogram (EEG) channels using discrete wavelet transform. An audio-visual induction based protocol has been de- signed with more dynamic emotional content for in- ducing discrete emotions (disgust, happy, surprise, fear and neutral). EEG signals are collected using 64 electrodes from 20 subjects and are placed over the entire scalp using International 10-10 system. The raw EEG signals are preprocessed using Surface Laplacian (SL) filtering method and decomposed into three different frequency bands (alpha, beta and gamma) using Discrete Wavelet Transform (DWT). We have used “db4” wavelet function for deriving a set of conventional and modified energy based fea- tures from the EEG signals for classifying emotions. Two simple pattern classification methods, K Nearest Neighbor (KNN) and Linear Discriminant Analysis (LDA) methods are used and their performances are compared for emotional states classification. The ex- perimental results indicate that, one of the proposed features (ALREE) gives the maximum average classi- fication rate of 83.26% using KNN and 75.21% using LDA compared to those of conventional features. Fi- nally, we present the average classification rate and subsets of emotions classification rate of these two different classifiers for justifying the performance of our emotion recognition system. Keywords: EEG; Human Emotions; Discrete Wavelet Transform; KNN; LDA 1. INTRODUCTION Emotion is one of the most important features of humans. Without the ability of emotions processing, computers and robots cannot communicate with human in natural way. It is therefore expected that computers and robots should process emotion and interact with human users in a natural way. In recent years, research efforts in Human Computer Interaction (HCI) are focused on the means to empower computers to understand human emotions. Al- though limited in number compared with the efforts be- ing made towards intention-translation means, some re- searchers are trying to realize man-machine interfaces with an emotion understanding capability. Most of them are focused on facial expression recognition and speech signal analysis [1,2]. In these works, the emotions of the subjects are purposefully expressed and it can be more easily concealed by those of other subjects [3]. Another possible approach for emotion recognition is physio- logical signal analysis. We believe that this is a more natural means of emotions recognition, in that the influ- ence of emotion on facial expression or speech can be suppressed relatively easily, and emotional status is in- herently reflected in the activity of nervous system. The traditional tools for the investigation of human emo- tional status are based on the recording and statistical analysis of physiological signals from the both central and autonomic nervous systems. Some of the main physiological signals highly adopted for human emotion assessment are: Electromyogram (EMG), Electrocardio- gram (ECG), Skin Conductive Resistance (SCR), and Blood Volume Pressure (BVP) [4,5]. Several approaches have been reported by different researchers on finding the correlation between the emotional changes and EEG signals [6-8]. The past works on emotion recognition using EEG signals are reported in [9]. One of the difficulties of categorizing emotion names is that the distinction between the emotion categories is not clear. All people express their emotions differently: it is not an easy task to judge or to model emotions. Re- searchers often use two different methods to model emo- tions [10,11]. One approach is word labels, for example, happy, sad, surprise, anger, fear, disgust, etc. Another ways is to have multiple dimensions or scales to catego- rize emotions. Instead of choosing discrete labels, ob- servers can indicate their impressions of each stimulus on several continuous scales: for example, pleasant-unpleasant, attention-rejection, simple-complicated, etc. Many re- searchers have attempted to utilize the two dimensional 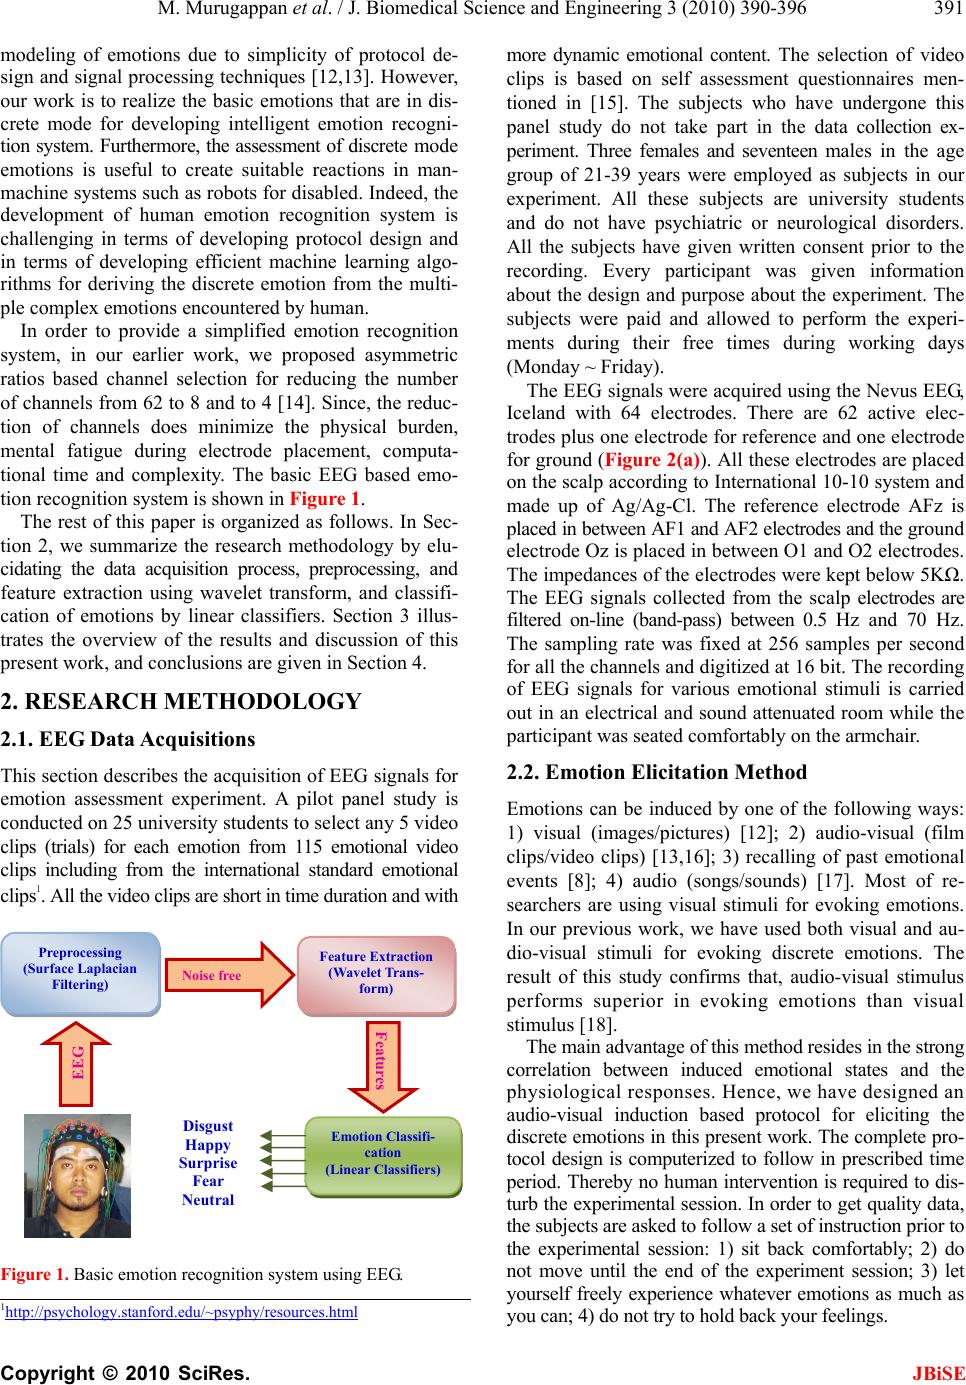 M. Murugappan et al. / J. Biomedical Science and Engineering 3 (2010) 390-396 Copyright © 2010 SciRes. JBiSE 391 modeling of emotions due to simplicity of protocol de- sign and signal processing techniques [12,13]. However, our work is to realize the basic emotions that are in dis- crete mode for developing intelligent emotion recogni- tion system. Furthermore, the assessment of discrete mode emotions is useful to create suitable reactions in man- machine systems such as robots for disabled. Indeed, the development of human emotion recognition system is challenging in terms of developing protocol design and in terms of developing efficient machine learning algo- rithms for deriving the discrete emotion from the multi- ple complex emotions encountered by human. In order to provide a simplified emotion recognition system, in our earlier work, we proposed asymmetric ratios based channel selection for reducing the number of channels from 62 to 8 and to 4 [14]. Since, the reduc- tion of channels does minimize the physical burden, mental fatigue during electrode placement, computa- tional time and complexity. The basic EEG based emo- tion recognition system is shown in Figure 1. The rest of this paper is organized as follows. In Sec- tion 2, we summarize the research methodology by elu- cidating the data acquisition process, preprocessing, and feature extraction using wavelet transform, and classifi- cation of emotions by linear classifiers. Section 3 illus- trates the overview of the results and discussion of this present work, and conclusions are given in Section 4. 2. RESEARCH METHODOLOGY 2.1. EEG Data Acquisitions This section describes the acquisition of EEG signals for emotion assessment experiment. A pilot panel study is conducted on 25 university students to select any 5 video clips (trials) for each emotion from 115 emotional video clips including from the international standard emotional clips1. All the video clips are short in time duration and with Figure 1. Basic emotion recognition system using EEG. more dynamic emotional content. The selection of video clips is based on self assessment questionnaires men- tioned in [15]. The subjects who have undergone this panel study do not take part in the data collection ex- periment. Three females and seventeen males in the age group of 21-39 years were employed as subjects in our experiment. All these subjects are university students and do not have psychiatric or neurological disorders. All the subjects have given written consent prior to the recording. Every participant was given information about the design and purpose about the experiment. The subjects were paid and allowed to perform the experi- ments during their free times during working days (Monday ~ Friday). The EEG signals were acquired using the Nevus EEG, Iceland with 64 electrodes. There are 62 active elec- trodes plus one electrode for reference and one electrode for ground (Figure 2(a)). All these electrodes are placed on the scalp according to International 10-10 system and made up of Ag/Ag-Cl. The reference electrode AFz is placed in between AF1 and AF2 electrodes and the ground electrode Oz is placed in between O1 and O2 electrodes. The impedances of the electrodes were kept below 5KΩ. The EEG signals collected from the scalp electrodes are filtered on-line (band-pass) between 0.5 Hz and 70 Hz. The sampling rate was fixed at 256 samples per second for all the channels and digitized at 16 bit. The recording of EEG signals for various emotional stimuli is carried out in an electrical and sound attenuated room while the participant was seated comfortably on the armchair. 2.2. Emotion Elicitation Method Emotions can be induced by one of the following ways: 1) visual (images/pictures) [12]; 2) audio-visual (film clips/video clips) [13,16]; 3) recalling of past emotional events [8]; 4) audio (songs/sounds) [17]. Most of re- searchers are using visual stimuli for evoking emotions. In our previous work, we have used both visual and au- dio-visual stimuli for evoking discrete emotions. The result of this study confirms that, audio-visual stimulus performs superior in evoking emotions than visual stimulus [18]. The main advantage of this method resides in the strong correlation between induced emotional states and the physiological responses. Hence, we have designed an audio-visual induction based protocol for eliciting the discrete emotions in this present work. The complete pro- tocol design is computerized to follow in prescribed time period. Thereby no human intervention is required to dis- turb the experimental session. In order to get quality data, the subjects are asked to follow a set of instruction prior to the experimental session: 1) sit back comfortably; 2) do not move until the end of the experiment session; 3) let yourself freely experience whatever emotions as much as you can; 4) do not try to hold back your feelings. 1http://psychology.stanford.edu/~psyphy/resources.html Disgust Happy Surprise Fear Neutral EEG Noise free Features Preprocessing (Surface Laplacian Filtering) Feature E xtraction (Wave let Trans- form) Emotion Classifi- cation (Linear Classifiers) 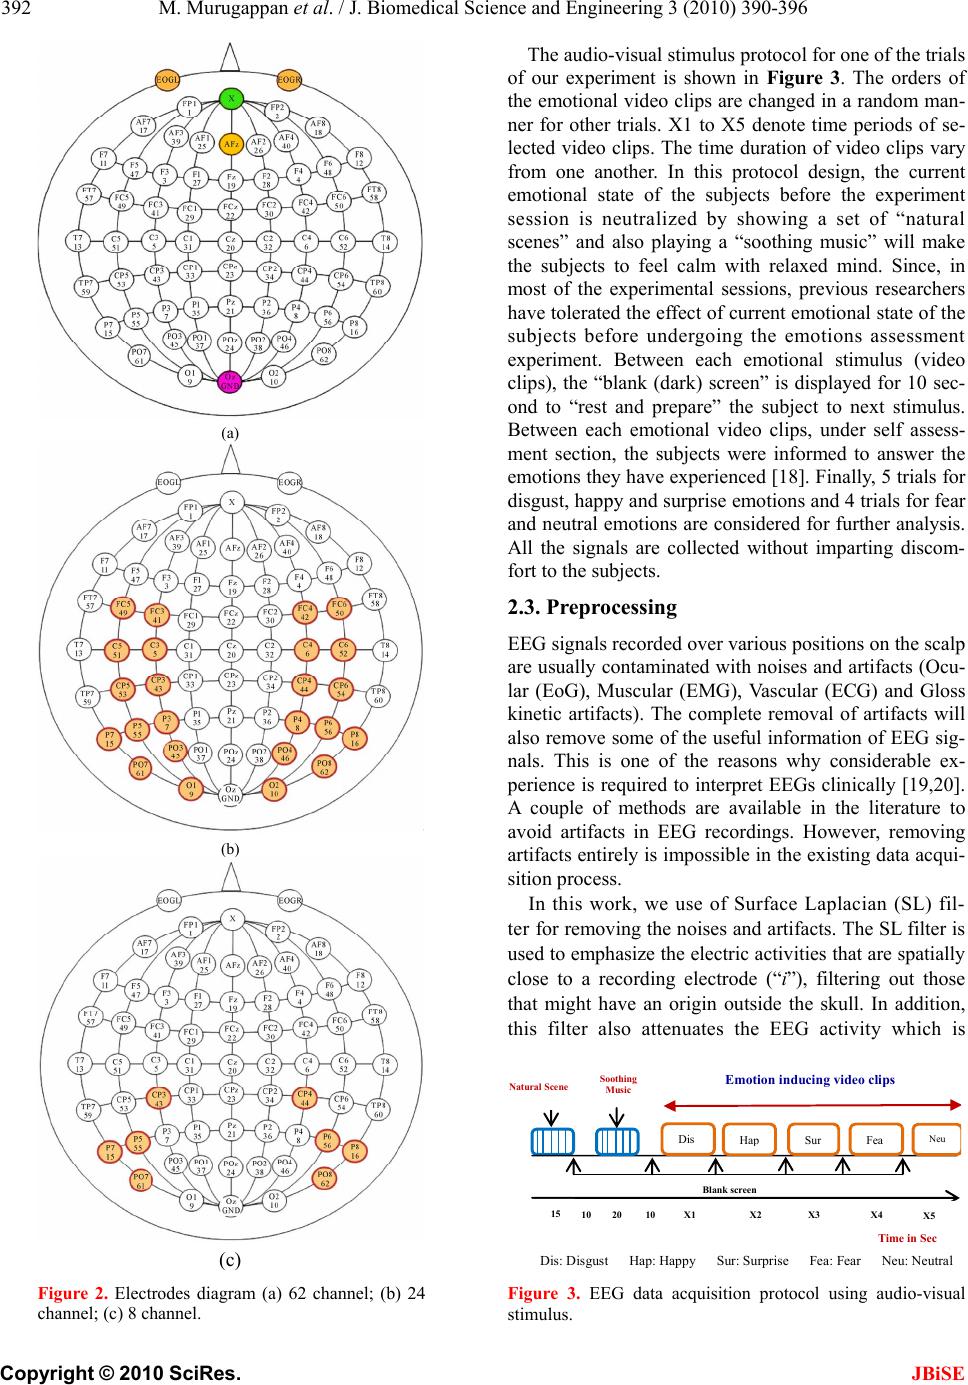 M. Murugappan et al. / J. Biomedical Science and Engineering 3 (2010) 390-396 Copyright © 2010 SciRes. JBiSE 392 (a) (b) (c) Figure 2. Electrodes diagram (a) 62 channel; (b) 24 channel; (c) 8 channel. The audio-visual stimulus protocol for one of the trials of our experiment is shown in Figure 3. The orders of the emotional video clips are changed in a random man- ner for other trials. X1 to X5 denote time periods of se- lected video clips. The time duration of video clips vary from one another. In this protocol design, the current emotional state of the subjects before the experiment session is neutralized by showing a set of “natural scenes” and also playing a “soothing music” will make the subjects to feel calm with relaxed mind. Since, in most of the experimental sessions, previous researchers have tolerated the effect of current emotional state of the subjects before undergoing the emotions assessment experiment. Between each emotional stimulus (video clips), the “blank (dark) screen” is displayed for 10 sec- ond to “rest and prepare” the subject to next stimulus. Between each emotional video clips, under self assess- ment section, the subjects were informed to answer the emotions they have experienced [18]. Finally, 5 trials for disgust, happy and surprise emotions and 4 trials for fear and neutral emotions are considered for further analysis. All the signals are collected without imparting discom- fort to the subjects. 2.3. Preprocessing EEG signals recorded over various positions on the scalp are usually contaminated with noises and artifacts (Ocu- lar (EoG), Muscular (EMG), Vascular (ECG) and Gloss kinetic artifacts). The complete removal of artifacts will also remove some of the useful information of EEG sig- nals. This is one of the reasons why considerable ex- perience is required to interpret EEGs clinically [19,20]. A couple of methods are available in the literature to avoid artifacts in EEG recordings. However, removing artifacts entirely is impossible in the existing data acqui- sition process. In this work, we use of Surface Laplacian (SL) fil- ter for removing the noises and artifacts. The SL filter is used to emphasize the electric activities that are spatially close to a recording electrode (“i”), filtering out those that might have an origin outside the skull. In addition, this filter also attenuates the EEG activity which is Emotion ind ucing video clips Time in Sec Soothing Music Blank scree n Dis Ha p Sur Fea N eu 15 10 20 10 X1 X 2 X3 X4X5 Dis: Disgust Hap: Happy Sur: Surprise Fea: Fear Neu: Neutral Natural Scene Figure 3. EEG data acquisition protocol using audio-visual stimulus. 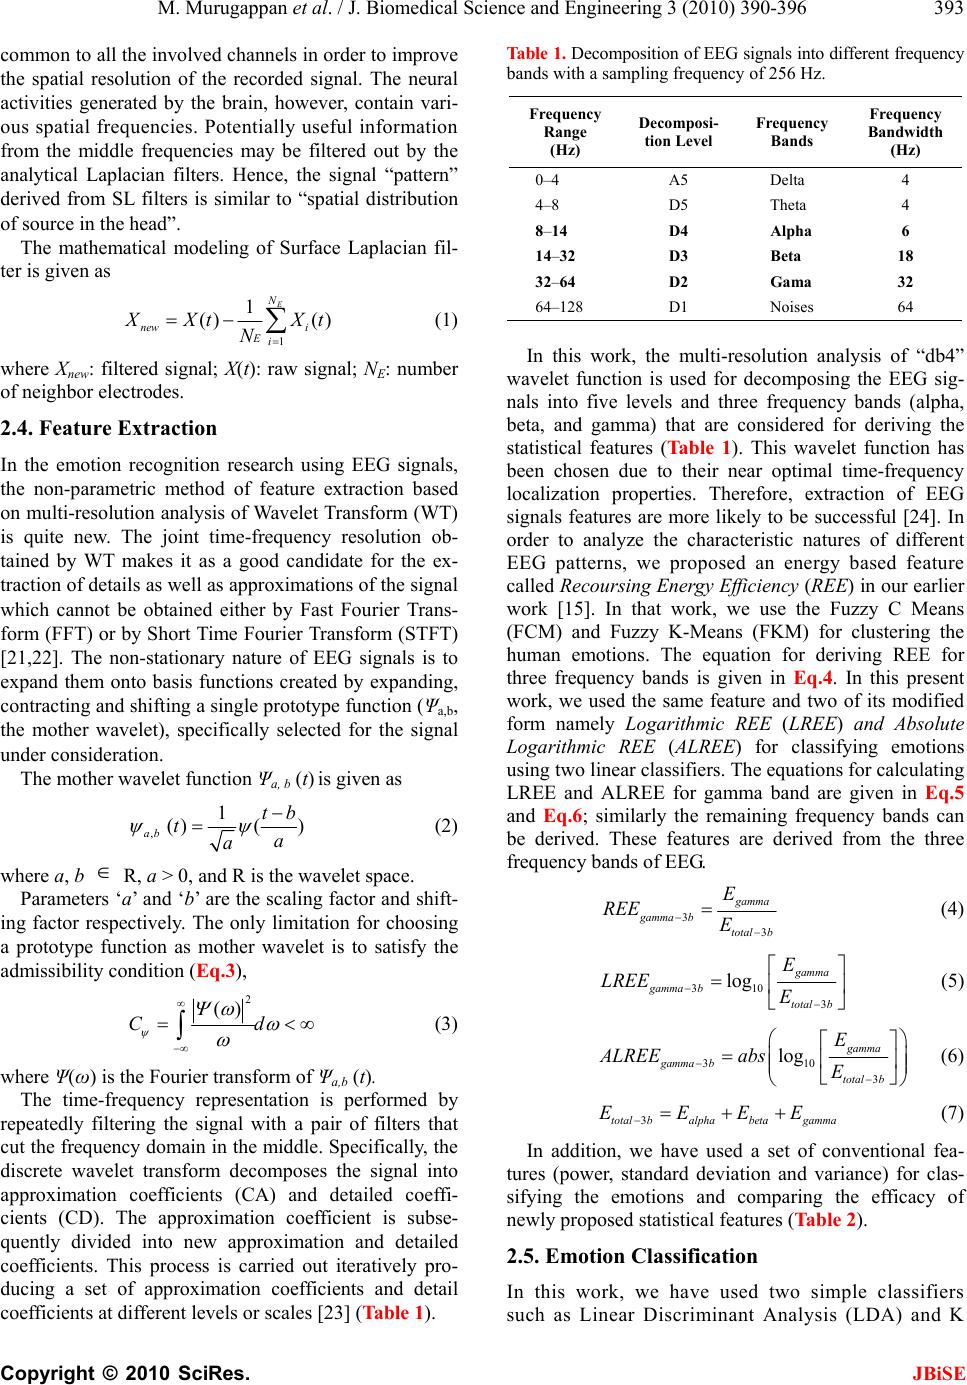 M. Murugappan et al. / J. Biomedical Science and Engineering 3 (2010) 390-396 Copyright © 2010 SciRes. JBiSE 393 common to all the involved channels in order to improve the spatial resolution of the recorded signal. The neural activities generated by the brain, however, contain vari- ous spatial frequencies. Potentially useful information from the middle frequencies may be filtered out by the analytical Laplacian filters. Hence, the signal “pattern” derived from SL filters is similar to “spatial distribution of source in the head”. The mathematical modeling of Surface Laplacian fil- ter is given as 1 1 () () E N new i Ei X XtX t N (1) where Xnew: filtered signal; X(t): raw signal; NE: number of neighbor electrodes. 2.4. Feature Extraction In the emotion recognition research using EEG signals, the non-parametric method of feature extraction based on multi-resolution analysis of Wavelet Transform (WT) is quite new. The joint time-frequency resolution ob- tained by WT makes it as a good candidate for the ex- traction of details as well as approximations of the signal which cannot be obtained either by Fast Fourier Trans- form (FFT) or by Short Time Fourier Transform (STFT) [21,22]. The non-stationary nature of EEG signals is to expand them onto basis functions created by expanding, contracting and shifting a single prototype function (Ψa,b, the mother wavelet), specifically selected for the signal under consideration. The mother wavelet function Ψa, b (t) is given as , 1 ()( ) ab tb ta a (2) where a, b R, a > 0, and R is the wavelet space. Parameters ‘a’ and ‘b’ are the scaling factor and shift- ing factor respectively. The only limitation for choosing a prototype function as mother wavelet is to satisfy the admissibility condition (Eq.3), 2 () Cd (3) where Ψ(ω) is the Fourier transform of Ψa,b (t). The time-frequency representation is performed by repeatedly filtering the signal with a pair of filters that cut the frequency domain in the middle. Specifically, the discrete wavelet transform decomposes the signal into approximation coefficients (CA) and detailed coeffi- cients (CD). The approximation coefficient is subse- quently divided into new approximation and detailed coefficients. This process is carried out iteratively pro- ducing a set of approximation coefficients and detail coefficients at different levels or scales [23] (Table 1). Table 1. Decomposition of EEG signals into different frequency bands with a sampling frequency of 256 Hz. Frequency Range (Hz) Decomposi- tion Level Frequency Bands Frequency Bandwidth (Hz) 0–4 A5 Delta 4 4–8 D5 Theta 4 8–14 D4 Alpha 6 14–32 D3 Beta 18 32–64 D2 Gama 32 64–128 D1 Noises 64 In this work, the multi-resolution analysis of “db4” wavelet function is used for decomposing the EEG sig- nals into five levels and three frequency bands (alpha, beta, and gamma) that are considered for deriving the statistical features (Ta bl e 1 ). This wavelet function has been chosen due to their near optimal time-frequency localization properties. Therefore, extraction of EEG signals features are more likely to be successful [24]. In order to analyze the characteristic natures of different EEG patterns, we proposed an energy based feature called Recoursing Energy Efficiency (REE) in our earlier work [15]. In that work, we use the Fuzzy C Means (FCM) and Fuzzy K-Means (FKM) for clustering the human emotions. The equation for deriving REE for three frequency bands is given in Eq.4. In this present work, we used the same feature and two of its modified form namely Logarithmic REE (LREE) and Absolute Logarithmic REE (ALREE) for classifying emotions using two linear classifiers. The equations for calculating LREE and ALREE for gamma band are given in Eq.5 and Eq .6 ; similarly the remaining frequency bands can be derived. These features are derived from the three frequency bands of EEG. 3 3 g amma gamma b total b E REE E (4) 310 3 log gamma gamma b total b E LREE E (5) 310 3 log gamma gamma b total b E ALREEabs E (6) 3total balphabetagamma EEEE (7) In addition, we have used a set of conventional fea- tures (power, standard deviation and variance) for clas- sifying the emotions and comparing the efficacy of newly proposed statistical features (Table 2). 2.5. Emotion Classification In this work, we have used two simple classifiers such as Linear Discriminant Analysis (LDA) and K 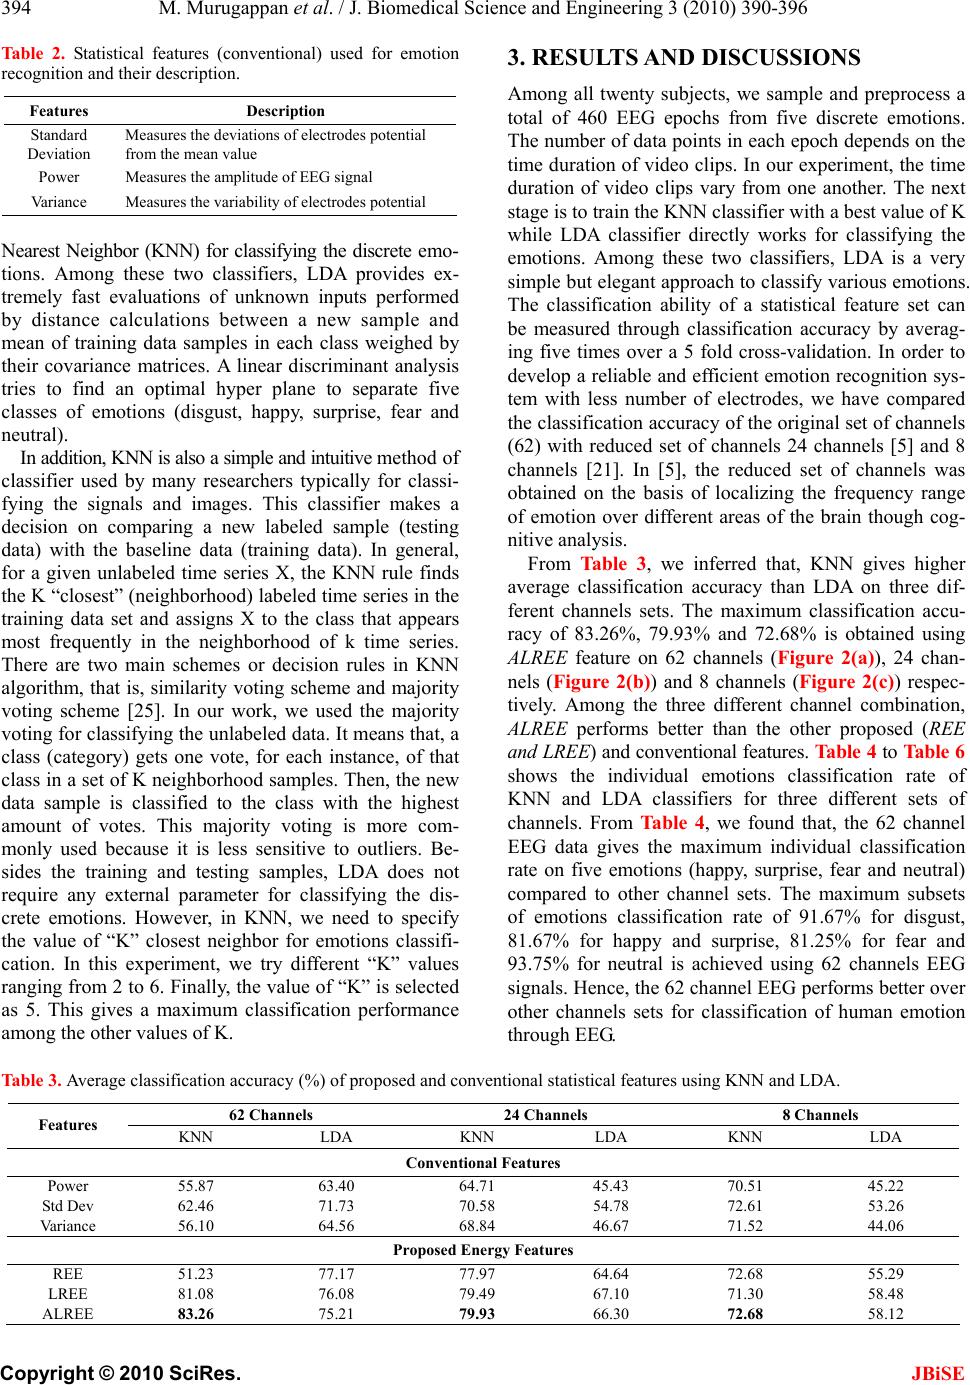 M. Murugappan et al. / J. Biomedical Science and Engineering 3 (2010) 390-396 Copyright © 2010 SciRes. JBiSE 394 Table 2. Statistical features (conventional) used for emotion recognition and their description. Features Description Standard Deviation Measures the deviations of electrodes potential from the mean value Power Measures the amplitude of EEG signal Variance Measures the variability of electrodes potential Nearest Neighbor (KNN) for classifying the discrete emo- tions. Among these two classifiers, LDA provides ex- tremely fast evaluations of unknown inputs performed by distance calculations between a new sample and mean of training data samples in each class weighed by their covariance matrices. A linear discriminant analysis tries to find an optimal hyper plane to separate five classes of emotions (disgust, happy, surprise, fear and neutral). In addition, KNN is also a simple and intuitive method of classifier used by many researchers typically for classi- fying the signals and images. This classifier makes a decision on comparing a new labeled sample (testing data) with the baseline data (training data). In general, for a given unlabeled time series X, the KNN rule finds the K “closest” (neighborhood) labeled time series in the training data set and assigns X to the class that appears most frequently in the neighborhood of k time series. There are two main schemes or decision rules in KNN algorithm, that is, similarity voting scheme and majority voting scheme [25]. In our work, we used the majority voting for classifying the unlabeled data. It means that, a class (category) gets one vote, for each instance, of that class in a set of K neighborhood samples. Then, the new data sample is classified to the class with the highest amount of votes. This majority voting is more com- monly used because it is less sensitive to outliers. Be- sides the training and testing samples, LDA does not require any external parameter for classifying the dis- crete emotions. However, in KNN, we need to specify the value of “K” closest neighbor for emotions classifi- cation. In this experiment, we try different “K” values ranging from 2 to 6. Finally, the value of “K” is selected as 5. This gives a maximum classification performance among the other values of K. 3. RESULTS AND DISCUSSIONS Among all twenty subjects, we sample and preprocess a total of 460 EEG epochs from five discrete emotions. The number of data points in each epoch depends on the time duration of video clips. In our experiment, the time duration of video clips vary from one another. The next stage is to train the KNN classifier with a best value of K while LDA classifier directly works for classifying the emotions. Among these two classifiers, LDA is a very simple but elegant approach to classify various emotions. The classification ability of a statistical feature set can be measured through classification accuracy by averag- ing five times over a 5 fold cross-validation. In order to develop a reliable and efficient emotion recognition sys- tem with less number of electrodes, we have compared the classification accuracy of the original set of channels (62) with reduced set of channels 24 channels [5] and 8 channels [21]. In [5], the reduced set of channels was obtained on the basis of localizing the frequency range of emotion over different areas of the brain though cog- nitive analysis. From Table 3, we inferred that, KNN gives higher average classification accuracy than LDA on three dif- ferent channels sets. The maximum classification accu- racy of 83.26%, 79.93% and 72.68% is obtained using ALREE feature on 62 channels (Figure 2(a)), 24 chan- nels (Figure 2(b)) and 8 channels (Figure 2(c)) respec- tively. Among the three different channel combination, ALREE performs better than the other proposed (REE and LREE) and conventional features. Ta ble 4 to Table 6 shows the individual emotions classification rate of KNN and LDA classifiers for three different sets of channels. From Ta bl e 4 , we found that, the 62 channel EEG data gives the maximum individual classification rate on five emotions (happy, surprise, fear and neutral) compared to other channel sets. The maximum subsets of emotions classification rate of 91.67% for disgust, 81.67% for happy and surprise, 81.25% for fear and 93.75% for neutral is achieved using 62 channels EEG signals. Hence, the 62 channel EEG performs better over other channels sets for classification of human emotion through EEG. Table 3. Average classification accuracy (%) of proposed and conventional statistical features using KNN and LDA. 62 Channels 24 Channels 8 Channels Features KNN LDA KNN LDA KNN LDA Conventional Features Power 55.87 63.40 64.71 45.43 70.51 45.22 Std Dev 62.46 71.73 70.58 54.78 72.61 53.26 Variance 56.10 64.56 68.84 46.67 71.52 44.06 Proposed Energy Features REE 51.23 77.17 77.97 64.64 72.68 55.29 LREE 81.08 76.08 79.49 67.10 71.30 58.48 ALREE 83.26 75.21 79.93 66.30 72.68 58.12 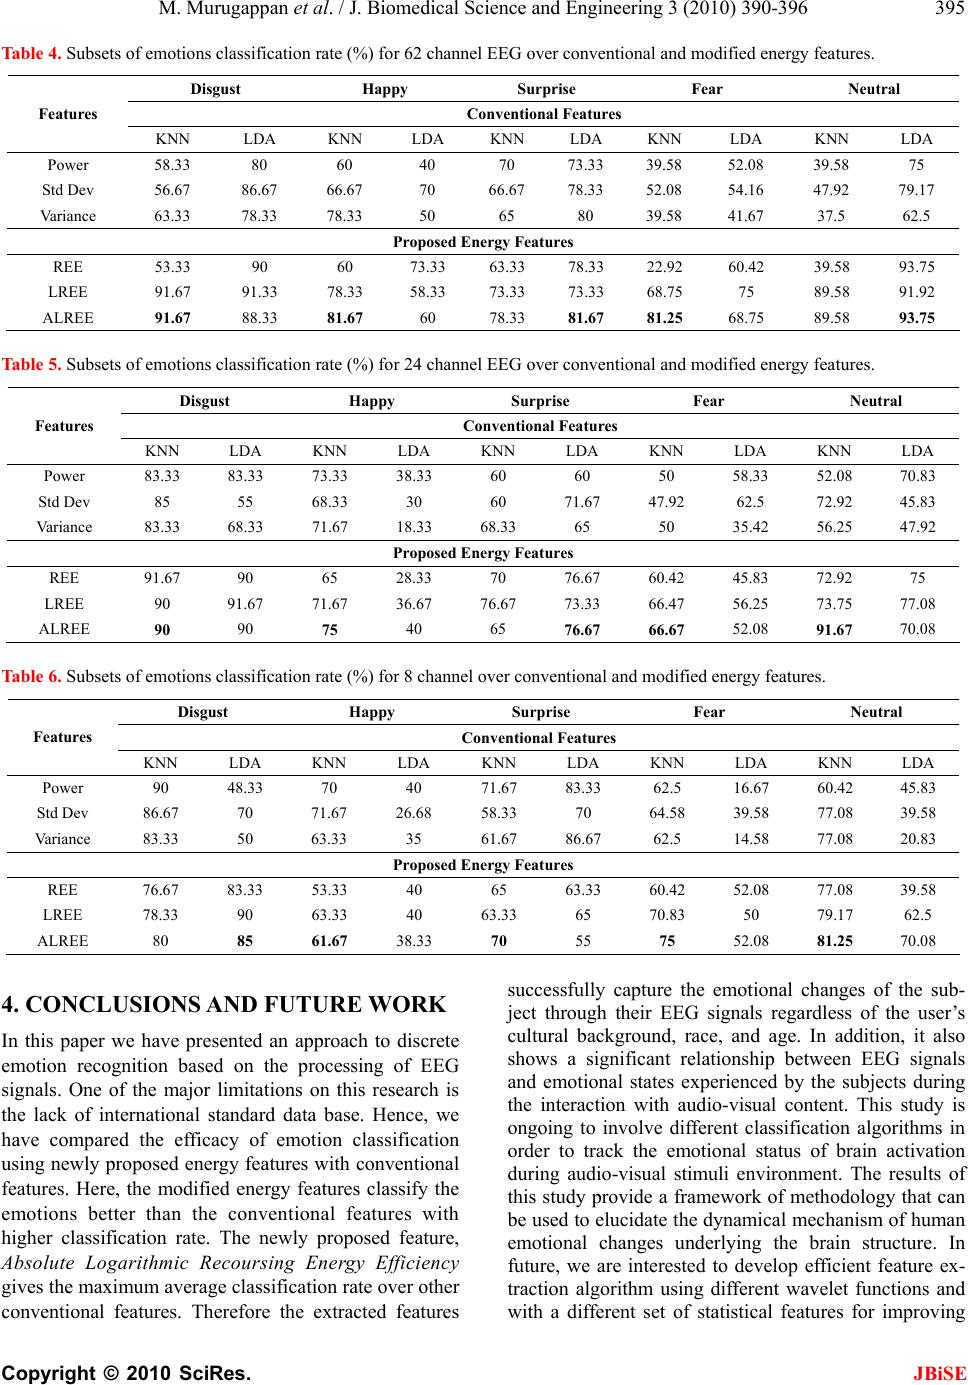 M. Murugappan et al. / J. Biomedical Science and Engineering 3 (2010) 390-396 Copyright © 2010 SciRes. JBiSE 395 Table 4. Subsets of emotions classification rate (%) for 62 channel EEG over conventional and modified energy features. Disgust Happy Surprise Fear Neutral Conventional Features Features KNN LDA KNN LDA KNN LDA KNN LDA KNN LDA Power 58.33 80 60 40 70 73.33 39.58 52.08 39.58 75 Std Dev 56.67 86.67 66.67 70 66.67 78.33 52.08 54.16 47.92 79.17 Variance 63.33 78.33 78.33 50 65 80 39.58 41.67 37.5 62.5 Proposed Energy Features REE 53.33 90 60 73.33 63.33 78.33 22.92 60.42 39.58 93.75 LREE 91.67 91.33 78.33 58.33 73.33 73.33 68.75 75 89.58 91.92 ALREE 91.67 88.33 81.67 60 78.33 81.67 81.25 68.75 89.58 93.75 Table 5. Subsets of emotions classification rate (%) for 24 channel EEG over conventional and modified energy features. Disgust Happy Surprise Fear Neutral Conventional Features Features KNN LDA KNN LDA KNN LDA KNN LDA KNN LDA Power 83.33 83.33 73.33 38.33 60 60 50 58.33 52.08 70.83 Std Dev 85 55 68.33 30 60 71.67 47.92 62.5 72.92 45.83 Variance 83.33 68.33 71.67 18.33 68.33 65 50 35.42 56.25 47.92 Proposed Energy Features REE 91.67 90 65 28.33 70 76.67 60.42 45.83 72.92 75 LREE 90 91.67 71.67 36.67 76.67 73.33 66.47 56.25 73.75 77.08 ALREE 90 90 75 40 65 76.67 66.67 52.08 91.67 70.08 Table 6. Subsets of emotions classification rate (%) for 8 channel over conventional and modified energy features. Disgust Happy Surprise Fear Neutral Conventional Features Features KNN LDA KNN LDA KNN LDA KNN LDA KNN LDA Power 90 48.33 70 40 71.67 83.33 62.5 16.67 60.42 45.83 Std Dev 86.67 70 71.67 26.68 58.33 70 64.58 39.58 77.08 39.58 Variance 83.33 50 63.33 35 61.67 86.67 62.5 14.58 77.08 20.83 Proposed Energy Features REE 76.67 83.33 53.33 40 65 63.33 60.42 52.08 77.08 39.58 LREE 78.33 90 63.33 40 63.33 65 70.83 50 79.17 62.5 ALREE 80 85 61.67 38.33 70 55 75 52.08 81.25 70.08 4. CONCLUSIONS AND FUTURE WORK In this paper we have presented an approach to discrete emotion recognition based on the processing of EEG signals. One of the major limitations on this research is the lack of international standard data base. Hence, we have compared the efficacy of emotion classification using newly proposed energy features with conventional features. Here, the modified energy features classify the emotions better than the conventional features with higher classification rate. The newly proposed feature, Absolute Logarithmic Recoursing Energy Efficiency gives the maximum average classification rate over other conventional features. Therefore the extracted features successfully capture the emotional changes of the sub- ject through their EEG signals regardless of the user’s cultural background, race, and age. In addition, it also shows a significant relationship between EEG signals and emotional states experienced by the subjects during the interaction with audio-visual content. This study is ongoing to involve different classification algorithms in order to track the emotional status of brain activation during audio-visual stimuli environment. The results of this study provide a framework of methodology that can be used to elucidate the dynamical mechanism of human emotional changes underlying the brain structure. In future, we are interested to develop efficient feature ex- traction algorithm using different wavelet functions and with a different set of statistical features for improving  M. Murugappan et al. / J. Biomedical Science and Engineering 3 (2010) 390-396 Copyright © 2010 SciRes. JBiSE 396 the emotion classification rate. 5. ACKNOWLEDGEMENTS This work is supported by the two grants of Ministry of Science and Technology Innovation (MOSTI), Malaysia. Grant Code: 9005–00020 & 9005–00002. REFERENCES [1] Bung, H. and Furui, S. (2000) Automatic recognition and understanding of spoken languages-a first step toward natural human machine communication. Proceedings of IEEE, 88, 1142-1165. [2] Cowie, R., Douglas, E., Tsapatsoulis, N., Votsis, G., Kol- lias, G., Fellenz, W. and Taylor, J.G. (2001) Emotion Rec- ognition in human-computer interaction. IEEE Signal Processing, 1, 3773-3776. [3] Takahashi, K. (2004) Remarks on emotion recognition from bio-potential signals. The Second International Conference on Autonomous Robots and Agents, 186-191. [4] Picard, R.W. (2000) Toward computers that recognize and respond to user emotion. IBM Systems Journal, 39(3), 705-719. [5] Picard, R.W. and Healey, J. (1997) Affective wearable’s. Personal Technologies, 1(4), 231-240. [6] Kim, K.H., Band, S.W. and Kim, S.B. (2004) Emotion recognition system using short-term monitoring of physio- logical signals. Proceedings on Medical & Biological Engineering & Computing, 42, 419-427. [7] Chanel, G., Karim, A.A. and Pun, T. (2007) Valence-arousal evaluation using physiological signals in an emotion re- call paradigm. Lecturer Notes in Computer Science, 1, 530-537. [8] Chanel, G., Kronegg, J., Grandjean, D. and Pun, T. (2005) Emotion assessment: Arousal evaluation using EEG’s and peripheral physiological signals. Technical Report, 4105, 530-537. [9] Murugappan, M., Rizon, M., Nagarajan, R. and Yaacob, S. (2009a) Inferring of human emotion states using mul- tichannel EEG. International Journal of Soft Computing and Applications (IJSCA), EURO Journals, United King- dom. (Accepted). [10] Russell, J.A. (1980) A Circumplex model of affect. Jour- nal of Personality and Social Psychology, 39(6), 1161- 1178. [11] Lang. P.J. (1995) The emotion probe: Studies of motiva- tion and attention. American Psychologist, 50(5), 372- 385. [12] Danny, O.B. (2008) Automated artifact detection in brain stream. Technical Report, 1-8. [13] Wang, Y. and Guan, L. (2005) Recognizing human emo- tion from audiovisual information. Proceedings of the International Conference on Acoustics, Speech, and Signal Processing, 2, 1125-1128. [14] Murugappan, M., Rizon, M., Nagarajan, R. and Yaacob, S. (2008) Asymmetric ratio and FCM based salient chan- nel selection for human emotion recognition using EEG. WSEAS Transactions on Signal Processing, 10(4), 596-603. [15] Murugappan, M., Rizon, M., Nagarajan, R., Yaacob, S., Hazry, D. and Zunaidi, I. (2008) Time-frequency analysis of EEG signals for human emotion detection. IFMBE Proceedings, 21, 262-265. [16] Takahashi, K. and Tsukaguchi, A. (2004) Remarks on emotion recognition from multi-modal bio-potential sig- nals. Proceedings of IEEE International Workshop on Robot and Human Interactive Communication, 95-100. [17] Jonghwa, K. and Elisabeth, A. (2008) Emotion recogni- tion based on physiological changes in music listening. IEEE Transactions on Pattern Analysis and Machine Intelligence, 30(12), 1-17. [18] Murugappan, M., Rizon, M., Nagarajan, R. and Yaacob, S. (2009) An Investigation on visual and audiovisual stimu- lus based emotion recognition using EEG. Transactions on Medical Engineering and Informatics, 1(3), 342-356. [19] Jung, T. (2000) Removing electroencephalographic arti- facts by blind source separation. Journal of Psychophysi- ology, 37(2), 163-178. [20] Gott, P.S., Hughes, E.C. and Whipple. (1984) Voluntary control of two lateralized conscious states: Validation by electrical and behavioral studies. Journal of Neuropsy- chological, 22, 65-72. [21] Mallat, S.G. (1989) A theory for multi-resolution signal decomposition: The wavelet representation. IEEE Trans- actions on Pattern Analysis and Machine Intelligence, 11(7), 674-693. [22] Merzagora, A.C., Bunce, S., Izzetoglu, M. and Onaral, B. (2006) Wavelet analysis for EEG feature extraction in deceptive detection. IEEE Proceedings on EBMS, 6, 2434- 2437. [23] Chethan, P. and Cox, M. (2002) Frequency characteris- tics of wavelets. IEEE Transactions on Power Delivery, 17(3), 800-804. [24] Charles, W.A. and Zlatko, S. (1997) Classification of EEG signals from four subjects during five mental tasks. IEEE Proceedings on Engineering Application in Neural Networks, 407-414. [25] Wanpracha, A.C., Ya-ju, F. and Rajesh, C.S. (2007) On the time series k-nearest neighbor classification of ab- normal brain activity. IEEE Transactions on Systems, Man and Cybernetics–Part A: Systems and Humans, 37(6), 1005- 1016. |