Journal of Water Resource and Protection
Vol.09 No.12(2017), Article ID:80775,22 pages
10.4236/jwarp.2017.912099
Water Quality Assessment by Measuring and Using Landsat 7 ETM+ Images for the Current and Previous Trend Perspective: Lake Tana Ethiopia
Mamaru A. Moges1,2*, Petra Schmitter3, Seifu A. Tilahun1, Essays K. Ayana4, Atikilt A. Ketema1, Temsgen E. Nigussie1, Tammo S. Steenhuis1,5
1Faculty of Civil and Water Resources Engineering, Bahir Dar Institute of Technology, Bahir Dar University, Bahir Dar, Ethiopia
2Blue Nile water Institute, Bahir Dar University, Bahir Dar, Ethiopia
3International Water Management Institute (IWMI), East Africa Office, Addis Abeba, Ethiopia
4Texas and Austin Agricultural and Mechanization University, Austin, USA
5Department of Biological and Environmental Engineering, Cornell University, Ithaca, USA

Copyright © 2017 by authors and Scientific Research Publishing Inc.
This work is licensed under the Creative Commons Attribution International License (CC BY 4.0).
http://creativecommons.org/licenses/by/4.0/


Received: September 17, 2017; Accepted: November 27, 2017; Published: November 30, 2017
ABSTRACT
Recently there are signs of water quality impairment in Lake Tana, the largest fresh water in Ethiopia. The lake is the growth corridor of the government and supports millions of livelihood around. In order to sustain the benefit and maintain the ecosystem of the lake, the lake health has to be kept safe. Therefore monitoring and evaluation of the water quality of lake is very vital. This study focuses on current and previous trends water quality of the lake through measurements and Landsat Images near entry of Gumera River. Statistical analysis of the physical (Turbidity and STD and biological (Cha-a,) and chemical (DPC) water quality parameters were done. Linear and non-linear regression models between water quality parameter and reflectance of Landsat 7 ETM+ images were fitted based on band combinations. Pervious trend in turbidity was analyzed based on the regression models. The results showed that reflectance and turbidity satisfactorily result with an R2 ranging from 0.61 - 0.68. Form 1999-2014 the turbidity of the lake has indicated an increasing trend. Delta development near the entry of Gumera River has been enlarged by 48% because of an increase sediment inflow. The sign in the decreasing water quality of the lake was attributed to the non-point source sediment and nutrient inflow to the lake with high erosion rate from the watersheds. Measures to reduce the non-point source sediment and nutrient inflow by targeting the source areas (hot spots) in the agricultural watersheds need to be priority for stakeholders working on the soil and water conservation. Moreover, reducing the recession agriculture around the lake and wetland management could be crucial for improving lake water quality.
Keywords:
Water Quality, Landsat 7 ETM+, Lake Tana, Delta Development

1. Introduction
Water quality of surface waters across the globe is impaired by several factors such as the non-point source contaminants through runoff [1] . This affects the impairment of water quality and the aquatic life in the surface waters such as lakes [2] [3] . Especially in developing country where the starting and existing water quality management is not satisfactory [4] becomes worse. One of the challenges in evaluating the effectiveness of management strategy is to monitor the water quality and analyses the trends in water quality data [4] . Which could be aggravated by the lack of local knowledge, and the measurements with a number of water quality parameters to be monitored are too expensive to monitor. In countries like Ethiopia, water quality challenges are emerging and in addition to hardly enough data for monitoring the water quality in surface waters such as Lake Tana, the largest fresh water in Ethiopia.
In Lake Tana, previous studies have indicated that the lake water quality showing signs of degradation [5] [6] . The rapid loss of vegetative cover and land use change, due to recent agricultural intensification, is a major driver of recent increases in sedimentation and biodiversity degradation in the lake [7] [8] . The degradation of water quality has reduced the lake’s capability to support aquatic life, and thus, impacts the sustainable utilization of the lake water resources. The incidental occurrence and spread of water hyacinths since 2011 [9] is attributed to the increased sediment and nutrient inflow into the lake. Studies indicate that eutrophication from anthropogenic drivers is the main cause for rapid spreading of water hyacinth over reservoirs [10] .
The existing water quality studies such as [4] [11] in Lake Tana used grab samples by considering the smaller portion of the lake near Bahir Dar town and near the entrance of one river. The studies revealed water quality of lake is getting enriched with pollutants such as higher nutrient inflow reduced water quality of the lake water. However, these studies only cover a portion of the lake and hence, overall assessment of agricultural non-point sources and its effect on sediment and nutrient inputs remains challenging and requires a robust spatio-temporal assessment. Basing the assessment purely on grab samples will be costly as it requires a large number of samples both in space and time. However satellite imagery in combination with a robust sampling scheme could reduce the sample size and provide an alternative for water quality monitoring at a range of temporal and spatial scales [12] .
Worldwide remote sensing imagery has been used to evaluate water quality in lakes by [13] [14] [15] [16] Various satellite images from Landsat 5, 7, 8, MODIS, and AVHRR have been used with Landsat images being one of most frequent ones [17] . The water quality parameters evaluation using images (with different type of satellite and resolution) include, study of sediment transport [18] , Chlorophyll-a for detecting over surface water [19] [20] [21] [22] [23] cyanobacteria and microphytes [24] , suspended solids [25] and water clarity [11] [26] [27] [28] [29] [30] . All of this study has been carried out of Ethiopia where fresh water quality is becoming a concern and monitoring has not been advanced as required. Specifically use of satellite imagery to assess changes in water quality in Ethiopian freshwater systems has been limited. The only existing satellite image based study in Ethiopia used MODIS/Terra images [31] to evaluate turbidity and total suspended solids. While using MODIS images gives the advantage of higher temporal resolution (i.e. daily), the coarser spatial resolution of the images renders them less suitable to map spatial distribution of the water quality parameters. The use of Landsat 7 ETM+ images such as with 30 m by 30 m resolution will help to overcome such shortcomings.
This study develops a method to continuously monitor the water quality (i.e. turbidity, Secchi disc Transparency Depth (STD), Dissolved Phosphorus Concentration (DPC), and Chl-a) in the lake using Landsat 7 ETM+ imagery. Furthermore, it uses the established protocol to evaluate the current situation in the lake as well as the historical changes in sediment load at the river deltas feeding into the lake. This assessment is crucial to understand the sustainability of the lake’s ecosystem as it is an important growth corridor for the country’s economy as it fulfills services such as transportation, hydropower, irrigation, fishery and ecotourism.
2. Materials and Methods
2.1. Description of Study Area
Lake Tana (Figure 1) is located northwest of the Ethiopian highlands. Geographically the lake lies between 278,946 meter E, 1,280,138 meter N and 349,403 meter E, 1,360,638 meter N. It is the largest fresh water resource in Ethiopia and contains half of the county’s fresh water reserve [32] covering 20% of the drainage area of the 15,096 km2 Lake Tana basin [33] . The rural populations as well as those from Bahir Dar town are highly dependent on revenues from the lake economy as it fulfills services such as transportation, hydropower, irrigation, fishery and ecotourism [34] .
It is a shallow Lake with a mean depth of 9 m and maximum depth of 15 m [35] . Usually shallow lakes are susceptible for water quality impairment [36] and carrying out this study in Lake Tana vital. The Lake has an average temperature of 22˚C and mean annual rainfall of 1450 mm/year. The lake is located in a wide depression of the Ethiopian basaltic plateau and bordered by flood plains that

Figure 1. Relative location and geographical positioning of the study area.
are often flooded during the rainy season such as Fogera floodplain in the east (mainly by Gumara and Rib rivers), Dembia floodplain in the north (from Megech River) and Kunzila floodplain in the southwest (associated with GilgelAbay, Kelti and Koga river) while it is bordered by steep rocks in the west and northwest [32] . The Lake is fed by more than 40 small streams [37] [38] [39] and receives 93% of its volume from the major rivers of Gilgel Abay, Gumara, Ribb and Megech [37] . The point sources from Bahir Dar town and non-point sources from the agricultural watersheds draining to the lake, increasing the deterioration of the lake as it decreases water quality due to the increase of sediment and nutrient loads [40] .
2.2. Methods
The general methodology of this study includes measurements of water quality parameters (Turbidity, Secchi disc Transparency Depth (STD), Dissolved Phosphorus Concentration (DPC), and Chl-a) over the surface of the Lake Tana from 26 locations near the entry of Gumara River at the moment that the satellite passed over the lake. Landsat 7 ETM+ images were preprocessed and image reflectance was extracted from single bands and band ratios (Table 1). The samples and images were used to establish a regression model between the measured Water Quality Parameters (WQP) and reflectance observed by the Landsat 7 ETM+ images. Historical assessment of turbidity changes since 1999 were derived by using the developed relationship and available archived Landsat 7 ETM+ images. A change in specific water quality parameter (turbidity) was furthermore assessed using the temporal range of satellite images and the developed regression model.
2.3. Water Quality Sampling
Sampling was carried out in three campaigns 10th of Dec. 2014, 19th of May 2015 and 7th of Aug. 2015). The sampling dates were spread within a year to capture seasonal variations in sediment and nutrient inflow. Grab samples of one liter from the top 20 cm of the water surface were collected from 26 locations (Figure 2) near the entry of Gumara river (draining from 1354 km2 watershed). The inter-sample distance was approximately 200 m to avoid repeated sampling over a single pixel (30 m × 30 m) and to ensure that the sampling area covered the spread of a sediment plume. The coordinates of each sampling location were recorded and samples were analyzed for turbidity, STD, DPC and Chl-a (Table 1).
2.3.1. Turbidity and Water Clarity
Turbidity was measured using the portable Hach 2100Q turbidimeter. The instrument was calibrated using the 2, 10, 20, 100, 200 and 800 NTU standards obtained with the instrument. Water clarity was measured as another indicator for lake turbidity using a sechi disk. The disk was submerged using a metal gaged rode or rope and depths where the disk could no long be seen from the surface were recorded. The STD depth was correlated with the turbidity measured at the same position in order to establish a transfer function. This would allow predicting turbidity using STD for further decreasing the costs of water quality

Table 1. Landsat 7 satellite over pass and water quality parameter measurement dates.

Figure 2. Sampling locations over Lake Tana.
monitoring.
2.3.2. Dissolved Phosphorus Concentration (DPC)
Samples for dissolved phosphorus were taken in 10th Dec 2014, 19th may 2015. The preserved water samples of 100 ml were prepared for water quality analysis within 24 hours after the sample has been collected. The collected samples were filtered using 0.25 μm filter paper and analyzed for dissolved phosphorus using wagtech plainest spectrophotometer using the automatic wavelength (wave length of 680 nm for P) with a detection limit of 0.001 mg・l−1.
2.3.3. Chlorophyll-a (Chl-a)
For measuring Chl-a, the samples of 100 ml were first filtered using GF Whatman 0.2 μm pore diameter filter paper. The material remaining on the filter paper was used to extract Chl-a pigment. The filter paper was grinded manually and extraction of Chl-a pigment was done using 5 ml acetone (98 percent aqueous solution) upon which the sample was centrifuged for 20 minutes at 4000 rpm. The centrifuged samples were placed in a cool dark place to settle the suspended material and prevent growth. Samples were analyzed four hours after storage using the emission spectrophotometer instrument at 663,664,665 and 750 nm. Chl-a was estimated using Environmental Protection Authority protocol (EPA 150.1 standard for Chl-a measurement [41] . Chlorophyll-a was only measured in December 2014 and May 2015.
2.4. Landsat 7 ETM+ Image Pre-Processing and Analysis
Landsat 7 ETM+ images with Path/row of 170/52 for 10th of Dec. 2014, 19th of May 2015 and 7th of Aug. 2015 were downloaded from USGS website (Table 2). Sensor scanning and atmospheric correction was applied. Since 31st of May 2003 strip/gaps in the Landsat 7 ETM+ images occurred (due to failure of scan line off corrector) which are corrected by using PANCROMA 6.42 scan line off corrector tool. The reason to use gap filled corrected Landsat 7 ETM+ images was to analyze the trend in turbidity from the previous Landsat archives.
For the atmospheric correction a simple Dark Object Subtraction (DOS) was applied, which is a common and popular procedure in various water quality monitoring using related remote sensing, due to its simplicity [42] [43] . In addition, DOS avoids the use of high demand input data as the case with complex atmospheric correction algorithms. Digital Number (DN) values from the image was converted to reflectance for each of the selected bands (band1-band5) and the ArcGIS 10.1 spatial analyst tool was used to extract the reflectance for each sampling point for the various bands and images. An example on image preprocessing is given in Figure S1.
2.5. Non-Linear Regression Model and Evaluate Trends in Water Quality
A regression model between measured water quality parameters (turbidity and
Table 2. Descriptive statistics for the water quality parameters measured over the surface of Lake Tana.

Figure 3. Cluster zones and sampling positions used in testing the previous trends in WQ.
cha-l for the month of December) and satellite image information was developed. The non-linear regression relationship was based on [31] . As indicated in Equations (1)-(3) relationship between the currently measured water quality parameters and Landsat images was evaluated using the R2. The Best fit model was again used to predict turbidity from reflectance of Landsat previously archived Landsat images from 1999-2014. Hence the current relationship between was based on the image acquired in December 10th 2014, it would be difficult to obtain the similar days image from the archive for the previous trends. In addition will help to accommodate the effect of seasonal variability on the water quality of lake as the lake experiences variances in turbidity throughout the seasons near the shore.
(1)
(2)
(3)
In order to assess the temporal variation of water quality parameters among the 3 campaigns Analysis Of Variance (ANOVA). Specifically, to evaluate differences between sampling periods. Afterwards, the trend of WQP was analyzed by using the Mann-Kendall (M-K) trend test [44] [45] using images Landsat from the archived image from 1999-2014 specifically images archived in December for each sample point. The sample points were clustered into three cluster zones as indicated in Figure 3. Clustering was based on the proximity of water quality parameter (WQP) values and WQP values were averaged to get one regional representative value for each cluster. For instance, the turbidity value for cluster 3 will be based on the weighted average of the turbidity measurements of each of the sample points in cluster 3.
In addition the trends in turbidity estimated from the satellite images will also be evaluated by using 1) analyzing with the trends in annual sediment inflow from Gumara watershed to the lake and 2) estimating identifying the enlargement of delta development near the entry of Gumara River.
The annual inflow of sediments from Gumara River was analyzed by generating the data with the newly developed rating curve for a monsoonal climate by [44] . To evaluate how the trends of sediment inflow were in line with the water quality trend, the predicted sediment inflow from 1999-2014 was also analyzed using the Mann and Kendall [45] [46] trend test.
A change in delta development was assessed using the image from 1999 as a baseline and compared against images for similar month (December) in 2014. Similar periods were taken to ensure similar water levels in the lake as those influence reflectance values and estimation of the delta expansion. Furthermore, a specific line of reference was selected within the delta to compare and estimate the delta expansion from 1999 till 2014.
3. Results and Discussion
3.1. Spatio-Temporal Variation in Water Quality Parameters
For the sampled months, turbidity has an average value of 17.1, 13.9 and 24.9 NTU in December, May and August respectively. The maximum turbidity values of 37 NTU were observed in August near the shore and the minimum of 5 NTU in May, further from the shoreline. This could be due to that the lake is shallow depth and re-suspension of sediments could also occur with the movement of lake water as the river joins and due to tides in the lake. The results also indicated the turbidity varies significantly temporally among the sampling months within a 95 percent confidence interval (Table S1). The values observed in August, during the rainy season were higher compared to those observed in the months May and December falling within the dry period. This was related to the higher sediment load coming from non-point sources in the intensively cultivated agricultural watershed.
The analysis of the STD data supported the turbidity findings. The average value of STD obtained from the observation was resulted 70.4, 84.2 and 50.6 centimeters in December, May, and August, respectively. This result clearly indicated that in dry season the lake water has higher clarity than in the rainy season, which is likely more turbid due to erosion from runoff contributing areas at the upland. The maximum STD of 121 cm was observed in May, 2015 faraway from the shore and the minimum was 36 centimeters observed in August near the shore of the lake. The STD values showed an inverse linear relationship with turbidity both temporally and spatially over the surface of the lake (Figure 4). Temporally, the ANOVA analysis of STD (p = 7.69 × 10⁻¹²) showed that it varies significantly between the months where observation has been carried out (Table S2).
The DPC measured in December, 2014 and May, 2015 showed an average value of 0.17 and 0.23 mg・l−1, respectively with maxima of 0.47 mg・l−1 (May) and 0.33 mg・l−1 (December). The minimum DPC observations were 0.06 mg・l−1 in December and 0.04 mg・l−1 in May. There is a significant difference between both months of minimum, average, and maximum values. Spatially the maximum DPC was found from the samples collected closer to shore and minimum DPC from the samples further from the shore (from Gumara river entrance to the lake). Spatially the amount of DPC and turbidity was inverse pattern indicating

Figure 4. Relationship between turbidity and STD over the surface of Lake Tana near entrance of Gumara River to Lake Tana from December/2014 observations.
Table 3. Trophic level index and class for Lake Tana based on the measurement of water quality near the entry of Lake Tana.
the concentration of DPC is controlled by the available sediment. In dry period such as May, phosphorous might be released from the bottom deposited sediment of the lake [11] and in wet period, the phosphorous is absorbed by sediment and metallic elements [47] . The results obtained were consistent with the observations made by the Tana sub Basin Organization [48] .
The results of Chl-a indicated an average value varying from 3.76 µg・l−1 in December to 1.56 µg・l−1 in May. The maximum and minimum values of Chl-a observations were 8.5 µg・l−1 and 0.57 µg・l−1 in October and 3.1 µg・l−1 and 0.26 in May, respectively. The t-test indicated significant variation of Chl-a from wet to dry season within a 95 percent confidence interval.
Based on the Trophic State Index (TSI) classification [49] turbidity and chl-awere averaged for each month. The results indicated that the lake water quality ranges from oligo-trophic to meso-trophic (Table 3). The TSI of Lake Tana could be an indicator of the lake water quality deterioration (Table S3).
3.2. Estimating Water Quality through Remote Sensing
The relationship which provided an overall best fit was based on Equation (1) for turbidity and Equation (3) for Chl-a (Table 4 and Table 5). The non-linear regression equation was selected based on the R²between observed and predicted water quality parameter during calibration. A regression for STD was made given that results are expected to be inverse (R2 = 0.7, Figure 4) to those found for turbidity.
The results shown in the Table 4 and Table 5 indicate that the relationship between the natural logarithm of turbidity with a single band had indicated relatively poor correlation (R2 of 0.36) for all months except august 2015. In August, the best relationship was based on single band i.e. band 5 with R2 = 0.66 and found to be the highest (Table 4). The natural logarithm of turbidity with normal band ratios (i.e. band 1 and band 2) provided a more reasonable relationship compared with the single bands for December 2014 (R2 = 0.68) and May 2015 (R2 = 0.48). The observed vs. predicted values showed a good correlation for the month of December (Figure 5). The results obtained in this study generally showed lower R2 values than those obtained by [31] using MODIS. Even though the resolution of the Landsat images was higher than the MODIS images, the
Table 4. R2 values for relationship between measured turbidity with Landsat 7 ETM + single band reflectance over the surface of Lake Tana.
Table 5. R2 values for the relationship between measured turbidity and Chl-a with Landsat 7 ETM+ reflectance band ratios over the surface of Lake Tana.
lesser R2 likely due to the following two reasons, 1) MODIS data used by [31] study was acquired daily to develop a relationship between the average daily turbidity and reflectance values for the entire month and 2) the gap correction for the Landsat 7 ETM + images might influence the true reflectance values in parts of the image where the strip occurred.
For Chl-a the relationships using single bands were almost insignificant and nearly zero (data not shown). Using band 1 and band 2 as indicated (Equation (1)) resulted in the best regression model from Landsat 7 ETM+ image reflectance for Chl-a (Table 5). However, the R2 was much lower as those obtained for turbidity which might be related to the fact that Chl-a absorbs light at lower wavelengths than turbidity. Hence, detecting Chl-a may require lower range bands than those used for band ratios in this study i.e. bands 1 - 5. The regression model performed slightly better in December for Chl-a, as this is related to the dry season and the higher production of Chl-a due to increased sunlight hours.
3.3. Water Quality Trends
3.3.1. Historical Changes in Turbidity
The Landsat ETM+ images from 1999 till 2013 were obtained for the month of December and used for trend analysis (Table S4). The dates of the downloaded images fell within a 10-daytime period around the 10th of December, the date of the image used for the regression function (Equation (1)). Turbidity was selected to understand potential trends in water quality given the low correlation of the satellite images for Chl-a. An increasing trend in turbidity of lake water with

Figure 5. Predicted versus observed turbidity obtained for December/2014.
slope of 0.64 (based on the Mann-Kendall trend test) clearly showed that the average turbidity lake water was increased (Figure 6). The average sediment inflow of 38-ton ha−1・yr−1 into the lake was estimated from [44] which were 46% higher than the country average of 26-ton ha−1・yr−1. The calculated annual sediment inflow showed the same trend as those observed in the 3 clusters for the same time period (Figure 6).
3.3.2. Delta Development
Results indicated that the in the delta area expanded by nearly 1.2 km2 from 1999 to 2014 (Figure 7). This indicates a 48% increase in area in comparison to a study conducted by [50] estimated the area of delta development increase by 2.1 km2 from 1959-2006. The difference between this result and the latter study was due to the time period difference for analyzing the results in delta development expansion.
Both the annual sediment load inflow increasing (Figure 8) trends and delta enlargement with increasing trend of turbidity from landsat 7 ETM+ image strongly illustrates the decreasing water quality trend. Therefore, to safeguard

Figure 6. Historical turbidity trends as predicted from Landsat 7 ETM+ image reflectance over surface of Lake Tana.
the lake water quality best management practices have to be implemented in agricultural watersheds, especially by targeting the hydrologic sensitive areas (HSAs), which are the main sources of non-point sources of nutrients such as phosphorus. In addition, establishing a buffer zone in the surrounding of the lake to sustain the existing wetlands is very important for trapping sediment and nutrient before it reaches the lake to cause eutrophication.
4. Conclusion
The corrected Landsat 7 ETM+ image could be used for monitoring previous trends current turbidity and suspended sediment and SDT but is less suitable for Chl-a for Lake Tana. The findings of this study indicated that the current water quality of Lake Tana is deteriorating. This could be caused by increased erosion which has resulted in an incremental increase of sediment inflow to the lake. The variation of water quality parameters over the lake was associated with the seasonal variation of regional climate. For example, turbidity is lower in the dry season and is greatest at the beginning of a rainy season. The continuous inflow

Figure 7. Delta developments near the entry of Gumara for (a) 1999 and (b) 2013 (the blue line indicting the reference line with known ground control point and red line area of delta in both time periods).
of sediments has expanded the delta over the past 15 years which could lead to deterioration of the lake in the future. Measures need to be taken for the reduction of non-point sediment and nutrient loading by implementing Best Management Practices (BMP’s). Such measures should include implementing the interventions by targeting the source areas for sediment and nutrient from agricultural watersheds. Recession agriculture in the surrounding of the lake should also be minimized or ceased to prevent the extra loading of nutrient from using the inorganic fertilizer. In addition, wetland in the surrounding of the lake has to be managed and monitored properly to use as the buffering for preventing extra sediment and nutrient loads into the lake.
Acknowledgements
This research was sponsored in part by USAID through the research project “Participatory Enhanced Engagement in Research” or PEER Science project (grant number AID-OAA-A-11-00012). Additional funding was also obtained from Higher Education for Development (HED), United States Department of
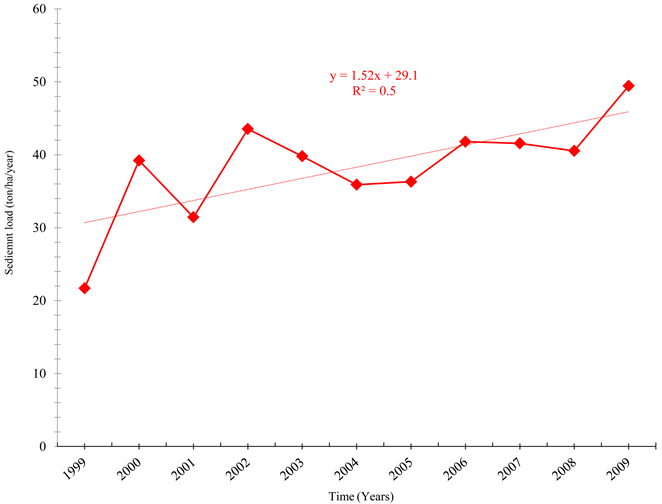
Figure 8. Sediment load inflow in to Lake Tana trends from 1999-2010 using Moges et al. (2016b).
Agriculture (USDA), International Science Foundation (IFS) in Sweden.
Conflict of Interest
The authors have declared no conflict of interest.
Cite this paper
Moges, M.A., Schmitter, P., Tilahun, S.A., Ayana, E.K., Ketema, A.A., Nigussie, T.E. and Steenhuis, T.S. (2017) Water Quality Assessment by Measuring and Using Landsat 7 ETM+ Images for the Current and Previous Trend Perspective: Lake Tana Ethiopia. Journal of Water Resource and Protection, 9, 1564-1585. https://doi.org/10.4236/jwarp.2017.912099
References
- 1. Carpenter, S.R., Caraco, N.F., Correll, D.L., Howarth, R.W., Sharpley, A.N. and Smith, V.H. (1998) Nonpoint Pollution of Surface Waters with Phosphorus and Nitrogen. Ecological Applications, 8, 559-568. https://doi.org/10.1890/1051-0761(1998)008[0559:NPOSWW]2.0.CO;2
- 2. Vitousek, P.M., Aber, J.D., Howarth, R.W., Likens, G.E., Matson, P.A., Schindler, D.W., Schindler, W.H. and Tilman, D.G. (1997) Human Alteration of the Global Nitrogen Cycle: Sources and Consequences. Ecological Applications, 7, 737-750.
- 3. Boesch, D.F., Brinsfield, R.B. and Magnien, R.E. (2001) Chesapeake Bay Eutrophication. Journal of Environmental Quality, 30, 303-320. https://doi.org/10.2134/jeq2001.302303x
- 4. Huang, G.H. and Xia, J. (2001) Barriers to Sustainable Water-Quality Management. Journal of Environmental Management, 61, 1-23. https://doi.org/10.1006/jema.2000.0394
- 5. Goshu, G. and Akoma, O.C. (2010) Comparative Study of Physico-Chemical Characteristics of Some on Farm Research Ponds, Ethiopia. Tropical Freshwater Biology, 19, 1-10.
- 6. Ligdi, E.E., Mohssine, E.K. and Patrick, M. (2010) Ecohydrological Status of Lake Tana—A Shallow Highland Lake in the Blue Nile (Abay) Basin in Ethiopia. Journal of Ecohydrology for Water Ecosystems and Society in Ethiopia, 10, 109-122.
- 7. Gebremariam, Z. (2002) The Ethiopian Rift Valley Lakes, Major Threats and Strategies for Conservation. In: Tudorancea, Ethiopian Rift Valley Lakes, Euro Net, 259-271.
- 8. Wondie, A. (2010) Improving Management of Shoreline and Riparian Wetland Ecosystems: The Case of Lake Tana Catchment. Ecohydrology for Water Ecosystems and Society in Ethiopia, 10, 123-132.
- 9. Wondie, A., Seid, A., Molla, E., Goshu, G., G/kidan, W.G., Shibabaw, A., Tewabe, D. and Genanew, M. (2012) Preliminary Assessment of Water hyacinth (Eichorniacrassipes) in Lake Tana. In: Proceedings of National Workshop, Biological Society of Ethiopia, Addis Ababa.
- 10. Ingwani, E., Gumbo, T. and Gondo, T. (2010) The General Information about the Impact of Water Hyacinth on Aba Samuel Dam, Addis Ababa, Ethiopia: Implications for Ecohydrologists. Ecohydrology and Hydrobiology, 10, 341-345. https://doi.org/10.2478/v10104-011-0014-7
- 11. Kuraz, F. (2015) Determination of Internal Phosphorus Load from Lake Sediments in Lake Tana, Ethiopia. Master’s Thesis, Faculty of Chemical and Food Engineering, Bahir Dar, Institute of Technology, Bahir Dar University.
- 12. Glasgow, H.B., Burkholder, J.M., Reed, R.E., Lewitus, A.J. and Kleinman, J.E. (2004) Real-Time Remote Monitoring of Water Quality: A Review of Current Applications, and Advancements in Sensor, Telemetry, and Computing Technologies. Journal of Experimental Marine Biology and Ecology, 300, 409-448. https://doi.org/10.1016/j.jembe.2004.02.022
- 13. Pulliainen, J., Kallio, K., Eloheimo, K., Koponen, S., Servomaa, H., Hannonen, T., Tauriainen, S. and Hallikainen, M.A. (2001) Semi-Operative Approach to Lake Water Quality Retrieval from Remote Sensing Data. Science of the Total Environment, 268, 79-93. https://doi.org/10.1016/S0048-9697(00)00687-2
- 14. Kloiber, S.M., Brezonik, P.L. and Bauer, M.E. (2002) Application of Landsat Imagery to Regional-Scale Assessments of Lake Clarity. Water Research, 36, 4330-4340. https://doi.org/10.1016/S0043-1354(02)00146-X
- 15. Cannizzaro, J.P. and Carder, K.L. (2006) Estimating Chlorophyll a Concentration from Remote-Sensing Reflectance in Optically Shallow Waters. Remote Sensing of Environment, 101, 13-24. https://doi.org/10.1016/j.rse.2005.12.002
- 16. Stumpf, R.P. and Tomlinson, M.C. (2005) Remote Sensing of Harmful Algal Blooms. In: Miller, R.L., Del Castillo, C.E. and McKee, B.A., Eds., Remote Sensing of Coastal Aquatic Environments, Springer, Dordrecht. https://doi.org/10.1007/978-1-4020-3100-7_12
- 17. Torbick, N., Hession, S., Hagen, S., Wiangwang, N., Becker, B. and Qi, J. (2013) Mapping Inland Lake Water Quality across the Lower Peninsula of Michigan using Landsat TM Imagery. International Journal of Remote Sensing, 34, 7607-7624. https://doi.org/10.1080/01431161.2013.822602
- 18. Ouillon, S., Douillet, P. and Andréfouët, S. (2004) Coupling Satellite Data with in Situ Measurements and Numerical Modeling to Study Fine Suspended-Sediment Transport: A Study for the Lagoon of New Caledonia. Coral Reefs, 23, 109-122. https://doi.org/10.1007/s00338-003-0352-z
- 19. Giardino, C., Pepe, M., Brivio, P.A., Ghezzi, P. and Zilioli, E. (2001) Detecting Chlorophyll, Secchi Disk Depth and Surface Temperature in a Subalpine Lake using Landsat Imagery. Science of the Total Environment, 268, 19-29. https://doi.org/10.1016/S0048-9697(00)00692-6
- 20. Brivio, P.A., Giardino, C. and Zilioli, E. (2001) Determination of Chlorophyll Concentration Changes in Lake Garda using an Image-Based Radiative Transfer Code for Landsat TM Images. International Journal of Remote Sensing, 22, 487-502. https://doi.org/10.1080/014311601450059
- 21. Han, L. and Jordan, K.J. (2005) Estimating and Mapping Chlorophyll—A Concentration in Pensacola Bay, Florida using Landsat ETM+ Data. International Journal of Remote Sensing, 26, 5245-5254. https://doi.org/10.1080/01431160500219182
- 22. Ronghua, M. and Jinfang, D. (2005) Investigation of Chlorophyll—A and Total Suspended Matter Concentrations using Landsat ETM and Field Spectral Measurement in Taihu Lake, China. International Journal of Remote Sensing, 26, 2779-2795. https://doi.org/10.1080/01431160512331326648
- 23. Brezonik, P.L., Menken, K. and Bauer, M.E. (2005) Landsat-Based Remote Sensing of Lake Water Quality Characteristics, Including Chlorophyll and Colored Dissolved Organic Matter (CDOM). Lake and Reservoir Management, 21, 373-382. https://doi.org/10.1080/07438140509354442
- 24. Oyama, Y., Matsushita, B. and Fukushiman, T. (2014) Distinguishing Surface Cyanobacterial Blooms and Aquatic Macrophytes using Landsat/TM and ETM+ Shortwave Infrared Bands. Remote Sensing of Environment. https://doi.org/10.1016/j.rse.2014.04.031
- 25. Baban, S.M. (1993) Detecting Water Quality Parameters in the Norfolk Broads, UK, using Landsat Imagery. International Journal of Remote Sensing, 14, 1247-1267. https://doi.org/10.1080/01431169308953955
- 26. Cox, J.R.M., Forsythe, R.D., Vaughan, G.E. and Olmsted, L.L. (1998) Assessing Water Quality in Catawba River Reservoirs using Landsat Thematic Mapper Satellite Data. Lake and Reservoir Management, 14, 405-416. https://doi.org/10.1080/07438149809354347
- 27. Dekker, A.G. and Peters, S.W.M. (1993) The Use of the Thematic Mapper for the Analysis of Eutrophic Lakes: A Case Study in the Netherlands. International Journal of Remote Sensing, 14, 799-821. https://doi.org/10.1080/01431169308904379
- 28. Lathrop, R.G., Lillesand, T.M. and Yandell, B.S. (1992) Testing the Utility of Simple Multi-Date Thematic Mapper Calibration Algorithms for Monitoring Turbid Inland Waters. Remote Sensing, 12, 2045-2063. https://doi.org/10.1080/01431169108955235
- 29. Lathrop, R.G. and Lillesand, T.M. (1987) Calibration of Thematic Mapper Thermal Data for Water Surface Temperature Mapping: Case Study on the Great Lakes. Remote Sensing of Environment, 22, 297-307. https://doi.org/10.1016/0034-4257(87)90063-0
- 30. Lillesand, T.M., Johnson, W.L., Deuell, R.L., Lindstrom, O.M. and Meisner, D.E. (1983) Use of Landsat Data to Predict the Trophic State of Minnesota Lakes. Photogrammetric Engineering and Remote Sensing, 49, 219-229.
- 31. Kaba, E.A., Philpot, W. and Steenhuis, T. (2014) Evaluating Suitability of MODIS-Terra Images for Reproducing Historic Sediment Concentrations in Water Bodies: Lake Tana, Ethiopia. International Journal of Applied Earth Observation and Geoinformation, 26, 286-297. https://doi.org/10.1016/j.jag.2013.08.001
- 32. Vijverberg, J., Sibbing, F.A. and Dejen, E. (2009) Lake Tana: Source of the Blue Nile. Springer Netherlands, in the Nile, 163, 192. https://doi.org/10.1007/978-1-4020-9726-3_9
- 33. Setegn, S.G., Rayner, D., Melesse, A.M., Dargahi, B. and Srinivasan, R. (2011) Impact of Climate Change on the Hydroclimatology of Lake Tana Basin, Ethiopia. Water Resources Research, 47. https://doi.org/10.1029/2010WR009248
- 34. Ketema, D.M. (2011) Analyzing Multi-Stakeholder Interaction in Common Pool Resources Governance: The Case of Lake Tana Watershed, Ethiopia.
- 35. Kaba, E.A. (2007) Validation of Radar Altimetry Lake Level Data and It’s Application in Water Resource Management. MSc Thesis, University of Twente.
- 36. Andrew, S., Sean, J.B. and Janine, M.C. (2013) Stream Restoration in Dynamic Fluvial Systems: Scientific Approaches, Analyses, and Tools. John Wiley & Sons, 194.
- 37. Kebede, S., Travi, Y., Alemayehu, T. and Marc, V. (2006) Water Balance of Lake Tana and Its Sensitivity to Fluctuations in Rainfall, Blue Nile Basin, Ethiopia. Journal of Hydrology, 316, 233-247. https://doi.org/10.1016/j.jhydrol.2005.05.011
- 38. Wale, A., Rientjes, T.H.M., Gieske, A.S.M. and Getachew, H.A. (2009) Ungauged Catchment Contributions to Lake Tana’s Water Balance. Hydrological Processes, 23, 3682-3693.
- 39. Rientjes, T., Perera, B., Haile, A., Reggiani, P.P. and Muthuwatta, L. (2011) Regionalization for Lake Level Simulation—The Case of Lake Tana in the Upper Blue Nile, Ethiopia. Hydrology and Earth System Sciences, 15, 1167-1183. https://doi.org/10.5194/hess-15-1167-2011
- 40. McCartney, M., Alemayehu, T., Shiferaw, A. and Awulachew, S.B. (2010) Evaluation of Current and Future Water Resources Development in the Lake Tana Basin, Ethiopia. International Water Management Institute (IWMI) Research Report, Addis Abeba, 134.
- 41. Environmental Protection Agency (1991) Environmental Sciences Section Inorganic Chemistry Unit, Wisconsin State Lab of Hygiene, Standard Chlorophyll Measuring Manual. Madison, WI 53706.
- 42. Song, C., Woodcock, C.E., Seto, K.C., Lenney, M.P. and Macomber, S.A. (2001) Classification and Change Detection using Landsat TM Data: When and How to Correct Atmospheric Effects. Remote Sensing of Environment, 75, 230-244. https://doi.org/10.1016/S0034-4257(00)00169-3
- 43. Teodoro, A.C., VelosoGomes, F., Gonçalves, H. and Retrieving, T.S.M. (2007) Concentration from Multispectral Satellite Data by Multiple Regression and Artificial Neural Networks. IEEE Transactions on Geoscience and Remote Sensing, 45, 1342-1350. https://doi.org/10.1109/TGRS.2007.893566
- 44. Moges, M.A., Zemale, F.A., Alemu, M.L., Ayele, G.K., Dagnew, D.C., Tilahun, S.A., and Steenhuis, T.S. (2016) Sediment Concentration Rating Curves for a Monsoonal Climate: Upper Blue Nile. Soil, 2, 337. https://doi.org/10.5194/soil-2-337-2016
- 45. Mann, H.B. (1945) Non-Parametric Tests against Trend. Econometrica, 245-259.
- 46. Kendall, M. (1975) Rank Correlation Methods. Charles Griffin, London.
- 47. Alemu, M.L., Geset, M., Mosa, H.M., Zemale, F.A., Moges, M.A., Giri, S.K., Seifu, A.T., Assefa, M., Essayas, K.A. and Steenhuis, T.S. (2017) Spatial and Temporal Trends of Recent Dissolved Phosphorus Concentrations in Lake Tana and Its Four Main Tributaries. Land Degradation & Development. https://doi.org/10.1002/ldr.2705
- 48. Tana Sub Basin Organization, TaSBO (2014) Annual Report on Water Quality of Lake Tana Basin. Bahir Dar, Ethiopia.
- 49. Carlson, R.E. and Simpsonv, J. (1996) A Coordinator’s Guide to Volunteer Lake Monitoring Methods. North American Lake Management Society, 96.
- 50. Abate, M., Nyssen, J., Steenhuis, T.S., Moges, M.M., Tilahun, S.A., Enku, T. and Adgo, E. (2015) Morphological Changes of Gumara River Channel over 50 Years, Upper Blue Nile Basin, Ethiopia. Journal of Hydrology, 525, 152-164. https://doi.org/10.1016/j.jhydrol.2015.03.044
Supplementary Information
Table S1. ANOVA for monthly results of turbidity.
Table S2. ANOVA for monthly results of SDT.
Table S3. TSI scale for surface waters (Carson, 1977).
Table S4. Dates of Landsat 7 ETM+ acquisition for trend analysis based on the relationship developed the measured WQ and reflectance from the Landsat 7 ETM+ image.


Figure S1. The preprocessed image of Landsat 7 ETM+ (a) the downloaded image subset by ROI, (b) the gap filled image using PANCHROMA 4.3 software (DN values), (c) atmospherically corrected image (DN values) and (d) Reflectance over Lake Tana area (the gap filled and atmospherically corrected and converted to reflectance).