Health
Vol.5 No.6A2(2013), Article ID:33718,8 pages DOI:10.4236/health.2013.56A2016
A comparison between reported and ideal patient-to-therapist ratios for stroke rehabilitation
![]()
1Department of Design, Engineering and Computing, Bournemouth University, Poole, UK; *Corresponding Author: gabrielle@salisburyfes.com
2Salisbury NHS Foundation Trust, Wiltshire, UK
Copyright © 2013 Gabrielle McHugh, Ian D. Swain. This is an open access article distributed under the Creative Commons Attribution License, which permits unrestricted use, distribution, and reproduction in any medium, provided the original work is properly cited.
Received 23 April 2013; revised 25 May 2013; accepted 10 June 2013
Keywords: Stroke; Rehabilitation; Staffing
ABSTRACT
Objective: Major improvement has been made in the medical management of stroke in the UK between 2008 and 2010 based on the indicators measured in the National Sentinel Audit. However based on the same audit, no corresponding improvement has been effected to patient functional impairment levels on hospital discharge in the corresponding time frame. This study derived patient-to-therapist ratios as a means of exploring the amount of rehabilitation time for stroke patients while in hospital care. Method: A purpose specific survey was developed for completion by stroke teams. From a contact list compiled primarily in collaboration with the 28 National Stroke Improvement Networks, the Nth name technique was used to target stroke teams in each geographical area covered by the 28 networks. Results: A total of 53 surveys were returned representing 20 of the 28 network areas providing 71% national coverage. Analysis conducted on 19 of the 37 inpatient hospital care units that were discrete units, had no missing data for staff numbers, unit bed numbers, number of stroke patients treated per annum, average unit length-of-stay, and unit occupancy rates. Staffing levels for some therapies were below the Department of Health staffing assumptions suggesting that stroke units are challenged to provide the recommended therapy time. Conclusions: Most stroke units surveyed are operating below the DH staffing assumption levels and are therefore challenged in providing the amount of therapy and patient time recommended in the National Institute of Clinical Excellence guidelines to facilitate optimal functional recovery for stroke patients.
1. INTRODUCTION
The incidence of stroke is estimated at approximately 110,000 cases per year in England with a range of 60% to 83% of patients achieving independence in self-care by one year after stroke [1]. The majority of patients surviving stroke however, experience upper limb motor impairment and reduced ability to perform basic activities [2]. Indeed, complete functional recovery of the upper limb was found to occur in only 5% to 34% of cases examined 6 months post-stroke [3].
The prioritization of stroke within the National Health Service (NHS) and proceeding changes in stroke care has resulted in a major improvement in the medical management of stroke such that hospital stay has seen a significant reduction from a mean of 23.7 days in 2008 to a mean of 19.5 days in 2010 [4]. The Sentinel Audit reported the median length of hospital stay was 10 days for patients [5]. However, functional recovery continues to present a considerable challenge. Moreover, discharge disability levels remain unchanged since 2008—58% of patients have a functional impairment on discharge from hospital. Based on a Barthel scored classification 22% of patients were mildly impaired, 14% were moderately impaired, 10% were severely impaired and 12% were very severely impaired on discharge from hospital [5]. The Sentinel Audit indicates that only a small proportion of patients are deemed appropriate for each of the therapies—physiotherapy (PT), occupational therapy (OT), and speech and language therapy (SALT)—during their hospital stay [5]. Nevertheless of those patients deemed appropriate only 32%, 31% and 18% received 45 minutes or more “per day” of each respective therapy during the weekday hospital stay [5,6].
This paper explores the extent of rehabilitation time provided to stroke patients using patient-to-therapist ratios. The findings reported here were extracted from the Work Package 1 (WP1) National Survey which was conducted under a larger Programme Grant for Applied Research (RP-PG-0707-10012) funded by the National Institute of Health Research (NIHR). The overall programme investigated Assistive Technologies in the Rehabilitation of the Arm after Stroke (ATRAS) and within that WP1 was tasked to determine current rehabilitation treatment methods and staffing resources for stroke rehabilitation. This information would be used to inform the treatment regime for the control arm of future ATRAS clinical trials. Ethical approval for WP1 was obtained from Bournemouth University.
2. METHOD
2.1. Survey Development
An Advisory Group of 12 stroke experts and a focus group attended by 30 stroke practitioners scoped the content and design of the survey. The focus group highlighted some potential difficulties with survey design such as the diversity of care settings, the multiple professions involved in care, the complexity of treating varying levels of impairment following stroke, and time constraints on the stroke team to complete a survey.
To address these issues, a two part survey was adopted that required input from the stroke team in each unit. Part A gathered demographic data about the care setting (e.g. acute or combined stroke unit); and the whole time equivalents (WTE) for all professions in the stroke team (e.g. WTE for PT, OT, SALT, Nurse, Medical). Part B provided a free script option to allow clinicians to describe the most common treatment interventions used in their unit for upper limb rehabilitation. Through an iterative development process the survey was pilot-tested and revised among the Advisory Panel and their associated stroke units before distribution to stroke units selected from the geographic areas covered by the 28 National Stroke Improvement networks. The data reported here is extracted from Part A of the ATRAS survey and used to derive patient-to-therapist ratios.
2.2. Survey Distribution
One objective of the survey was for national distribution in order to delineate the extent of stroke rehabilitation provided across the whole of England. This was achieved by collaborating with the 28 Stroke Improvement Networks to compile a contact list of stroke clinicians. Stroke Improvement Networks are national NHS networks that connect stroke practitioners around England to co-ordinate and support the stroke care pathway. However 9 networks were unable to collaborate with the researchers, therefore to cover these areas supplemental contact names were obtained through the South West Stroke Forum and searching through the NHS Consultant’s Guide for clinician contact details in those respective areas.
To have geographic representation of the network areas we used the straight-forward systematic sampling method and the Nth name selection technique (using a uniform interval of every 13th entry on the lists provided by each network) [7]. To cover the 28 network areas, 192 surveys were emailed to individual stroke care providers. However, this included multiple contacts within each team (e.g. a stroke consultant and a stroke co-coordinator) to increase awareness of the survey. The survey requested detailed input from the whole stroke team; therefore we specifically targeted clinicians who have a strong interest in stroke improvement as demonstrated by their involvement in the Stroke Improvement Networks. The original Dillman [8] approach was adopted to engage individuals with the project [9]. A minimum of 3 email prompts with non-responders was used and a minimum of 3 telephone follow-ups were made to participants if further clarification of their responses was needed.
2.3. Survey Participants
In total 54 completed surveys were returned by stroke teams to represent 20 of the 28 geographic network areas thus representing 71% national coverage. One survey was unsuitable for analysis as it described a protocol of treatments in a research situation and therefore, was not a typical clinical setting. The 53 surveys represented stroke teams who worked across 77 care setting—of which 37 identified as in-patient care (i.e. acute stroke units, combined stroke units, and stroke rehabilitation units) and 40 were post hospital care setting (e.g. Community Health Care, Outpatient Care). Despite several follow-ups with the respective stroke teams, only 51 of the 53 surveys reported annual patient numbers treated for stroke and from these, a total of 16,632 patients were treated per year by the participating teams—13,954 treated per annum during hospital care and 2678 treated during post hospital care.
2.4. Data Analysis
Surveys selected for this analysis were based on the following inclusion criteria: surveys completed by inpatient hospital care stroke teams; stroke teams self identifying as a discrete unit (e.g. acute stroke unit only); stroke teams with no missing data for staffing levels in their unit; and stroke teams provided full data per unit on average length of stay, number of beds and occupancy rates. However, and despite several follow-up phone calls to the stroke teams, some data fields remained incomplete. The researchers adopted the strategy of removing units with any missing data from further analysis rather than replacing the missing data with mean values which could lead to distortion when the intent of the analysis was to compare reported patient-to-therapist ratios to national guidelines. Consequently, this paper reports the data from 19 of the 37 in-patient hospital units.
Teams reported the WTE for all staff members (e.g. PT, OT, Nurse, SALT, and Medical) in the unit and the proportion and number of stroke patients treated annually. To isolate staffing levels and therapist time for stroke patients, the researchers adjusted staffing WTE accordingly to reflect stroke specific WTE only. For example, if a team indicated that the stroke patients treated annually in the unit represented 80% of all patients in the unit, the staffing WTE was adjusted accordingly. Thereafter, comparisons were made between reported patient-to-therapist ratios for PT, OT, and SALT derived from the survey data to ideal and aspirational ratios derived from Department of Health (DH) published guidelines for stroke unit staffing. The Stroke Strategy Staffing Assumptions grid published in the NHS Workforce Planning Resource [10], Nice Quality Standards Stroke Topic Expert Group Meeting [11] and the DH’s Progress in Improving Stroke Care [2] provides an ideal staffing WTE and an aspirational staffing WTE for stroke units. We used these staffing numbers to derive ideal patient-to-therapist ratios and aspirational patient-to-therapist ratios. We also used the terms “ideal” and “aspirational” to be consistent with the labels from the Stroke Strategy Staffing Assumptions grid. The staffing grid is presented in Table 1.
The basic formula used to derive the reported patientto-therapist ratio was:
365/LOS × OccR × 10/therapists per 10 beds = annual patient-to-therapist ratiowhere:
365 = days of the year;
LOS = average length of stay;
OccR = average occupancy rate;
10 = number of beds.
The components used to derive the reported, ideal, aspirational, and combined ratios for the formulas are presented in Table 2. Formula A used the average length of stay, occupancy rate and therapist-per 10 beds that was reported by the teams in each of the units. This represents the patient-to-therapist ratios that are experienced by teams in the stroke units. Formulas B and C used the average length of stay from the National Sentinel Audit, the Royal College of Surgeons (RCS) recommended occupancy rate, and the DH staffing levels assumptions and aspirations. This represents patient-to-therapist ratios that ought to be experienced if conditions (i.e. LOS, OccR and staffing) reached “ideal” or “aspirational” levels. Formula D represents a combined ratio for which we used the reported length of hospital stay and reported occupancy rates for each unit combined with the recommended DH staffing assumption. We used this formula to demonstrate that the high occupancy rate and longer hospital stay reported by the teams puts challenging demands on units to provide the recommended 45 minutes of therapy to patients even when the DH staffing assumptions are met.
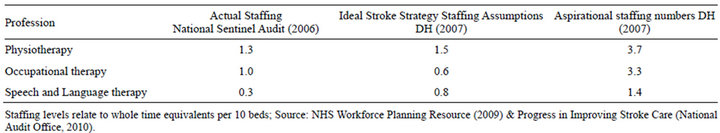
Table 1. Staffing assumptions and aspirations for stroke units (whole-time equivalents per 10 beds).
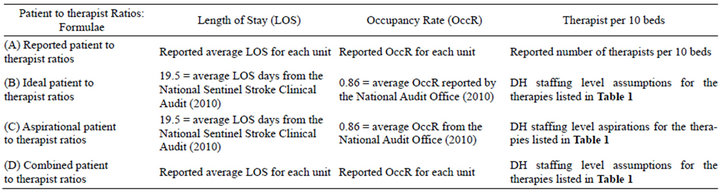
Table 2. Components to derive reported, ideal, aspirational and combined patient-to-therapist ratios.
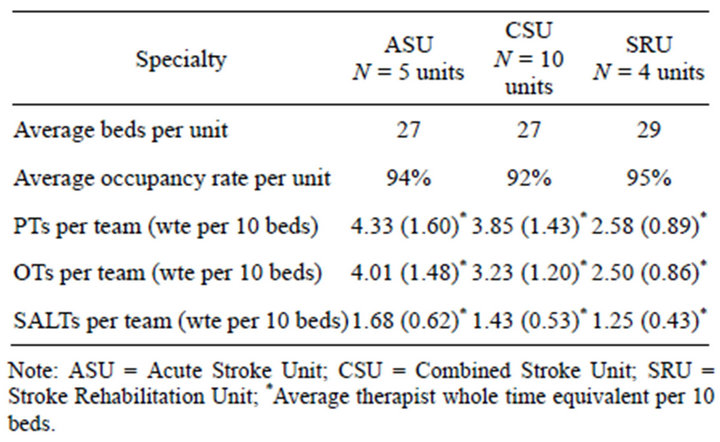
Table 3. Average staffing level per team converted to whole time equivalents per 10 beds.
The average staffing WTE for PT, OT and SALT in acute, combined and rehabilitation units respectively are presented in Table 3. The average number of beds for the three types of units was 27 for acute stroke units, 27 for combined stroke units, and 29 for stroke rehabilitation units (range of 14 - 40 beds per unit) and is comparable to the median number of beds (n = 26 beds) reported in the Sentinel Audit [5]. However, the average occupancy rate of 93% from this survey was higher than that recommended by RCS [12,13]. Indeed, the RCS states the maximum bed occupancy rate for general and acute units should not exceed 82% as this is a clear predictor of increased risk of infection, while the National Audit Office found occupancy rates to be approximately 86%. The 86% rate was used to derive ideal and aspirational ratios to better compare with the reported occupancy rates in the ATRAS survey.
3. RESULTS
Table 4 lists the ideal and aspirational patient-totherapist ratios which are represented as the dashed and solid lines respectively in each of the Figures 1-3. Figure 1 shows the patient-to-PT ratios in the units. Units were graphed geographically from North to South of England to preserve anonymity of the stroke teams. The ideal ratio (dashed line, Formula B) equaled 107 patients per PT treated annually. The aspirational ratio (solid line, Formula C) equaled 43 patients per PT treated annually. What Figure 1 shows is that few units met the patient-to-PT ratios expected by the DH. Only 6 of the 19 units (31%) were working within the ideal ratio and none of the units were within the DH staffing aspiration levels [10,11]. To make one further comparison, a combined ratio was derived using the reported numbers for average length of stay and occupancy rates in the ATRAS survey with the DH staffing assumption (see Formula D) to derive patient ratios that are shown as the darker bars in Figure 1. This shows that while the DH staffing assumptions may improve units’ ability to meet patient
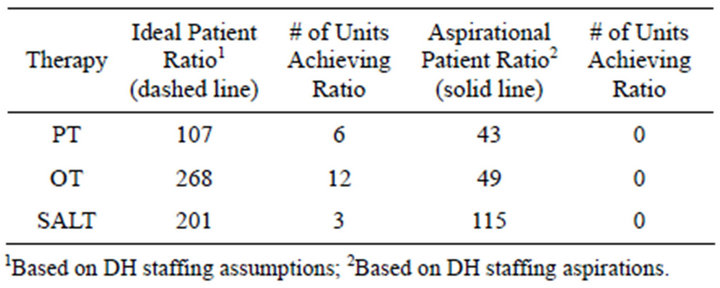
Table 4. Ideal and aspirational patient-to-therapist ratio and stroke units achieving the ratio (N = 19).
needs, the high occupancy rates and reported length of hospital stay indicates that units would continue to function below the ideal Stroke Strategy Staffing.
The same procedure was used to construct Figures 2 and 3 which depict the patient-to-OT and patient-toSALT ratios respectively. The number of lighter bars in Figure 2" target="_self"> Figure 2 below the dashed line suggests that 12 of the 19 units had ample OT capacity to meet the ratios expected by the DH in the Stroke Strategy. This is misleading as the ideal staffing level of 0.6 OTs per 10 beds sets spuriously high patient-to-OT ratios (see Table 5). However, when the reported bed numbers and occupancy rates were combined with the DH staffing assumptions only 5 of the 19 units met the expected ratio.
The reported ratios for SALT (lighter bars in Figure 3) show that only 4 units had adequate staffing WTE, while the remaining 15 units were grossly exceeding the ideal ratio and none of the units were working near the DH staffing aspirations. The combined ratio derived from formula (D) show that increasing the staffing WTE to the DH assumptions brought units more in line with the ideal ratio nevertheless; almost 50% of units would continue to exceed the ideal patient-to-SALT ratio.
To tease out how reasonable the ideal staffing figures were, particularly the OT figures, we calculated our own values based upon 1) the percentage of patients suitable for each of the three therapies taken from the National Sentinel Clinical Stroke Audit [1], and 2) the percentage of staff time spent in direct patient contact for PT, OT [14] and SALT [15]. These values are shown in Table 5, calculated in order to provide the NICE recommendation [11] of 45 minutes of each therapy to suitable patients per day over a 37.5 hours working week. Therefore, given 450 minutes per working day (7.5 working hours × 60 minutes), one therapist could provide the recommended amount of treatment to each of 10 patients if the therapist only treated patients. However, the percentage of time spent directly with patients is estimated at 46% for PT, 33% for OT [14] and 25% for SALT [15]. Using the percentage of suitable patients and percentage of direct contact time per therapy this gives the formula—10 beds divided by percentage of direct patient time multiplied by percentage of patients suitable. The final analysis looked at therapist time-to-patient ratios. Assuming
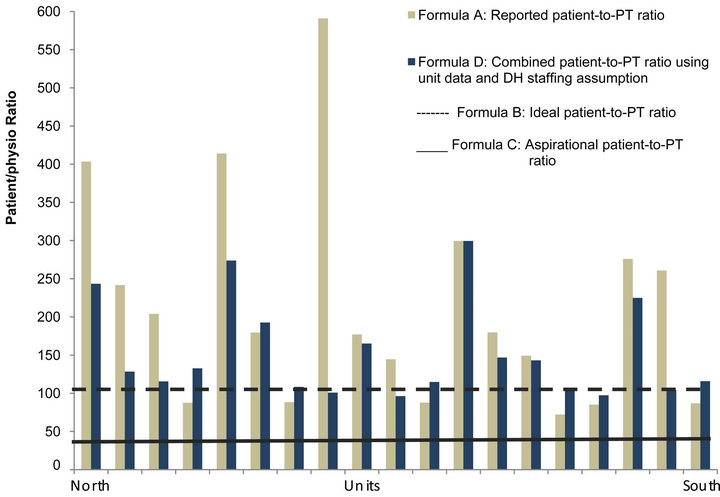
Figure 1. Patient-to-physiotherapy (PT) ratio.
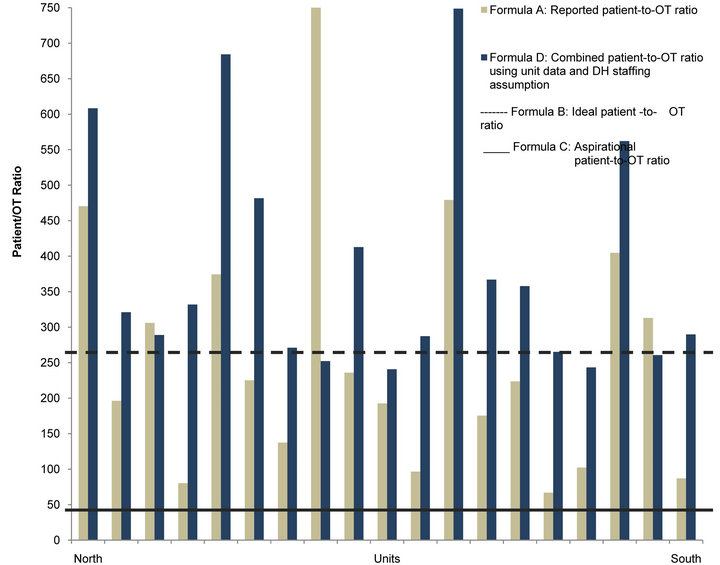
Figure 2. Patient-to-occupational therapy (OT) ratio.
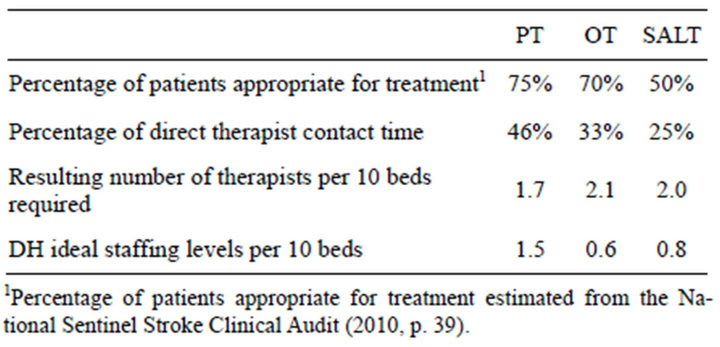
Table 5. Required staffing levels per 10 beds.
the typical 37.5 hours week and the typical 44 working weeks in a year (52 weeks less statutory holidays and vacation) Table 6 sets out the number of therapy hours a patient may expect during their hospital stay. For contrast the nursing hours per each patient based on the data reported in the surveys are set out in Table 6. If therapists spent all their time in direct patient care the patient may have up to 39 hours of nursing care compared to 10 hours of PT, 9 hours of OT and 5 hours of SALT during their stay in an acute unit, for example. However, the
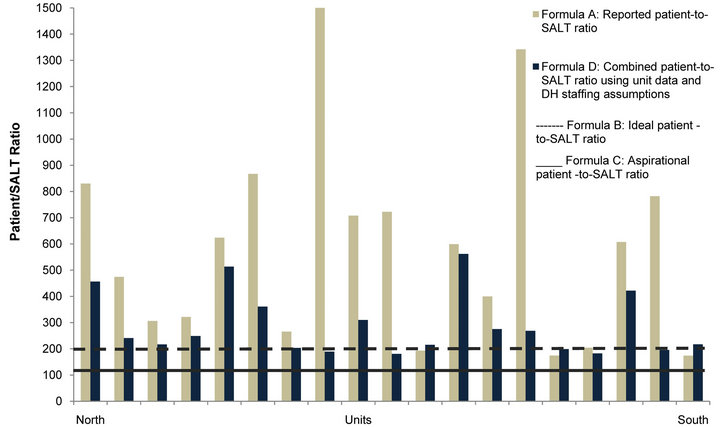
Figure 3. Patient-to-speech & language therapist (SALT) ratio.
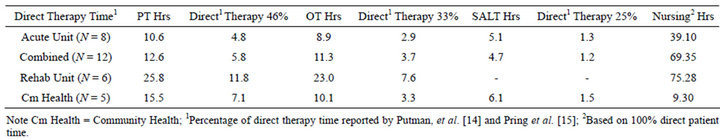
Table 6. Therapist hours and direct therapy time per patient.
percentage of time spent directly with patients is already reported as 46% for PT, 33% for OT [14] and 25% for SALT [15]. Therefore, the patient can expect up to 5, 3, and 2 hours respectively for each of the therapies PT, OT and SALT during their hospital stay.
4. DISCUSSION
The purpose of this paper was to derive patient-totherapist ratios as a means of exploring the amount of rehabilitation time for stroke patients while in hospital care. We did this by comparing the reported patient ratios derived from the ATRAS survey to the staffing WTE published by the DH. Based on the DH staffing guideline for therapists per 10 beds (1.5 PT, 0.6 OT, and 0.8 SALT) it is evident from the data that few of the units surveyed met the Stroke Strategy Staffing Assumptions [10,11]. This suggests that the majority of stroke care units are challenged in providing rehabilitation to assist with optimal functional recovery for stroke patients. With the staffing WTE reported in the survey, stroke units are unable to comply with the minimum NICE guideline of 45 minutes a day of each active therapy for at least 5 days a week. Indeed, the data show that only 42% of units reached the ideal DH staffing assumptions for PT and only 16% of units reached the DH staffing assumptions for SALT. We have shown that the 0.6 OT staffing WTE per 10 beds is not sufficient to meet the needs of patients and resulted in patient-to-OT ratios that were spuriously high. However, the overall staffing pattern is consistent with the DH Survey of Stroke Unit Staffing and Patient Dependency [16] which reported that only 25% of units had adequate staff numbers for rehabilitation. Similarly, the Sentinel Audit [5] reports that “access to occupational therapy is slower for many patients than ideal” (p. 35).
While medical management of stroke is an essential aspect of good care, the philosophy of patient-centred care should also provide the potential for optimal functional recovery to stroke patients. Notwithstanding the significant reduction in duration of hospital stay during the previous two year period, the 2011 National Sentinel Stroke Clinical Audit [5] notes that there had been no corresponding change in discharge disability scores during the equivalent time frame. However, the evidence suggests that intensive rehabilitation improves functional recovery outcomes for patients [17,18]. Additionally, Turton and Pomeroy [19] describe the early weeks following stroke as a critical period for obtaining the best response to rehabilitation when therapy is given in the context of optimum physiological basic care. Moreover, they suggest that it is more likely that patients are suffering from too little practice of movement to optimise their functional recovery. Similarly Rudd et al. [20] found that stroke patients in England received relatively little rehabilitation from therapists despite the guidelines [2,21], suggesting 45 minutes of each therapy per day.
This is quite consistent with the findings in this study in which we found that patients may expect up to 5, 3, and 2 hours respectively for each of the therapies PT, OT and SALT during their hospital stay, the duration of which is reported in the Sentinel Audit as a mean of 19.5 days or a median of 10 days [5,6]. By contrast 3.75 hours per week (45 mins × 5 working days per week) is the recommended time for each of the therapies in the NICE guidelines [11]. When we averaged the annual number of patients treated and the staffing levels reported in the ATRAS survey, the outcome suggests that a patient may receive up to 10 hours of physiotherapy in an acute unit, for example, if there are no other demands on the therapist’s time. However, the literature suggests that only 46% of a physiotherapist’s time is spent in direct patient care, thus a patient may expect less than 5 hours of physiotherapy during their stay in an acute unit. Likewise, the literature suggests 33% of OT time [14] and 25% of SALT time [15] is spent directly with patients. In an acute unit this provides less than 3 hours and 2 hours of OT and SALT time per hospital stay. By contrast a patient may expect up to 39 hours of nursing care if nurses spent all their time in direct patient care. This higher concentration of nursing care to therapy is consistent with the finding from De Wit et al. [17]. Investigating how patient time was spent, De Wit found that more than 35% of therapy time in the UK stroke centre consisted of nursing care, compared with 10% in the Belgium centre and up to 5% in the centres in Switzerland and Germany. Further analysis of our data is underway to report more specifically on the time available to provide the different therapies which we expect will further support our premise that stroke units are challenged to provide rehabilitation time to optimise functional recovery for patients following stroke.
5. CONCLUSIONS
We have clearly demonstrated that:
• Only limited therapy time is available for rehabilitation during hospital care.
• Stroke patients receive greater nursing hours than therapy hours.
• High occupancy rates when combined with bed numbers and average length-of-stay suggest patient-totherapist ratios that challenge the notion of patientcentred care.
One of the limitations is that our analysis is based on data provided by 19 of the 37 in-patient hospital care units. Despite numerous phone calls, personal email reminders and conversations with busy units we were unable to gather further data. Thereafter, we made the decision not to enhance our numbers by using mean values to fill empty cells so our data would be an authentic reflection of the participating units. The typical obstacle to participation cited was staffing and time constraints and these will be difficult challenges to overcome in future studies. Selection bias may also be considered a limitation in that our sample was specifically targeted to those stroke clinicians with an interest in the Stroke Improvement Networks. However, this participant recruitment strategy was deliberate to maximize the number of teams willing to collaborate with the study. The survey was complex and required detailed information from the stroke team and we felt these clinicians would be more willing partners of the study. Therefore it may be that our sample reflects research oriented stroke teams or even the better performing stroke teams and the data should be interpreted with that in mind. Additionally, we relied on self-reported data. We did back-up our data with additional phone and email contact with the stroke teams; however under our operating constraints, on-site visits or additional triangulation of the data were not an option. Nevertheless we believe the analyses performed and the information provided can act as a benchmark to future staff planning. Additional planned studies will examine this issue in further detail.
6. ACKNOWLEDGEMENTS
This work was funded as part of the ATRAS project, NIHR Programme Grant for Applied Research RP-PG-10707-10012. The research funded is independent and the views expressed in the paper are those of the author(s) and not necessarily those of the NHS, the NIHR or the Department of Health.
REFERENCES
- National Stroke Association (2012) Stroke fact sheet. http://www.stroke.org/site/PageServer?pagename=stroke
- National Audit Office (2010) Department of Health: Progress in improving stroke care. http://www.nao.org.uk/publications/0910/stroke.aspx
- Kong, K.-H., Chua, K.S.G. and Lee, J. (2011) Recovery of upper limb dexterity in patients more than 1 year after stroke: Frequency, clinical correlates and predictors. NeuroRehabilitation, 28, 105-111.
- (2007) National stroke strategy. http://www.dh.gov.uk/en/Publicationsandstatistics/Publications/PublicationsPolicyAndGuidance/DH_081062
- Royal College of Physicians (2011) National sentinel stroke clinical audit 2010 round 7. RCP, London.
- Royal College of Physicians (2007) National Sentinel stroke audit—Organisational audit, 2006. RCP, London.
- (2013) Royal Geographical Society. Sampling techniques. https://www.rgs.org/OurWork/Schools/Fieldwork+and+local+learning/Fieldwork+techniques/Sampling+techniques.htm
- Dillman, D.A. (1978) Mail and telephone surveys: The total design method. Wiley-Interscience, New York.
- Venkataraman, L. and Zurawski, E. (2007) Can the Dillman Method be applied to e-mail prompting with a twenty-something population. The American Association for Public Opinion Research (AAPOR) 62nd Annual Conference.
- Department of Health (2009) NHS workforce planning resource. http://webarchive.nationalarchives.gov.uk/+/www.dh.gov.uk/en/Healthcare/
- Longtermconditions/Vascular/Stroke/DH_081389.
- National Institute of Clinical Excellence (2012) Rehabilitation after critical illness: NICE clinical guideline. http://www.nice.org.uk/nicemedia/live/12137/58250/58250.pdf
- National Audit Office (2010) The prevention, management and control of healthcare related infections (HCAI) in hospitals (ROCR-LITE/08/014/FT6). www.nao.org.uk/idoc.ashx?docId=df9f6955-da02-4a07-a460
- Royal College of Surgeons (2010) High NHS hospital bed occupancy remains a big infection risk. http://www.rcseng.ac.uk/news/high-nhs-hospital-bed-occupancy-remains-a-big-infection-risk-says-rcs/
- Putman, K., DeWit, L., Schupp, W., Ilse, B., Berman, P., Connell, L., Dejaeger, E., DeMeyer, A.M., DeWeerdt, W., Feys, H., Walter, J., Lincoln, N., Louckx, F., Martens, A., Schuback, B., Smith, B. and Leys, M. (2006) Use of time by physiotherapists and occupational therapists in a stroke rehabilitation unit: A comparison between four European rehabilitation centres. Disability and Rehabilitation, 28, 1417-1424. doi:10.1080/09638280600638216
- Pring, T., Flood, E., Dodd, B. and Joffe, V. (2012) The working practices and clinical experiences of paediatric speech and language therapists: A national UK survey. International Journal of Language & Communication Disorders, 47, 696-708. doi:10.1111/j.1460-6984.2012.00177.x
- Department of Health & Royal College of Physicians (2007) Survey of stroke unit staffing and patient dependency. DH, London.
- DeWit, L., Putman, K., Dejaeger, E., Baert, I., Berman, P., Bogaerts, K., Brinkmann, N., Connell, L., Feys, H., Jenni, W., Kaske, C., Lesaffre, E., Leys, M., Lincoln, N., Louckx, F., Schuback, B., Schupp, W., Smith, B. and DeWeerdt, W. (2005) Use of time by stroke patients: A comparison of four European rehabilitation centres. Stroke, 36, 1977- 1983. doi:10.1161/01.STR.0000177871.59003.e3
- Kwakkel, G., van Peppen, R., Wagenaar, R.C., Dauphinee, S.W., Richards, C., Ashburn, A., Miller, K., Lincoln, N., Partridge, C., Wellwood, I. and Langhorne, P. (2004) Effects of augmented exercise therapy time after stroke. A Meta-Analysis. Stroke, 35, 2529-2536. doi:10.1161/01.STR.0000143153.76460.7d
- Turton, A. and Pomeroy, V. (2002) When should upper limb function be trained after stroke? Evidence for and against early intervention. NeuroRehabilitation, 17, 215- 224.
- Rudd, A.G., Jenkinson, D., Grant, RL. and Hoffman, A. (2009) Staffing levels and patient dependence in English stroke units. Clinical Medicine, 9, 110-115. doi:10.7861/clinmedicine.9-2-110
- Intercollegiate Stroke Working Party (2012) National clinical guideline for stroke. 4th Edition, RCP, London.