Advances in Bioscience and Biotechnology
Vol.3 No.4(2012), Article ID:21858,10 pages DOI:10.4236/abb.2012.34057
Isolation of lactic acid bacteria from sugar cane juice and production of lactic acid from selected improved strains
![]()
1Faculty of Agriculture, University of Mauritius, Réduit, Mauritius
2ANDI Centre of Excellence for Biomedical and Biomaterials Research, University of Mauritius, Réduit, Mauritius
Email: *sudeshp@uom.ac.mu
Received 6 May 2012; revised 12 June 2012; accepted 5 July 2012
Keywords: Lactic acid bacteria; sugar cane juice; mutagenesis
ABSTRACT
Lactic acid bacteria (LAB) were isolated from fresh sugar cane juice. It was found that several isolates exhibited a clear zone and growth on deMan, Rogosa, Sharpe (MRS) agar supplemented with sodium azide, bromocresol purple and sucrose. However, only 17 isolates which formed large yellow areas were selected for further investigations. These isolates were further identified according to their morphological and biochemical characteristics. It was found that 10 of these isolates were homofermenters. One of these 10 isolates was selected for mutagenesis using chemical (Ethidium bromide) and physical (UV-B) mutagens followed by biochemical characterisation. A total of 112 mutants were isolated and 9 homofermentative isolates were further investigated for their ability to produce lactic acid. 1H-NMR spectroscopy confirmed that all mutant isolates produced lactic acid as the sole fermentation product.
1. INTRODUCTION
Lactic acid (2-hydroxypropanoic acid, CH3-CH(OH)- COOH) is a natural organic acid with a long history of use in the food and non-food industries, including the cosmetic and pharmaceutical industries, and for the production of oxygenated chemicals, plant growth regulators, and special chemical intermediates [1-3]. Currently, there is an increased demand for lactic acid as a feedstock for the production of biopolymer poly-lactic acid (PLA), which is a promising biodegradable, biocompatible, and environmentally friendly alternative to plastics derived from petrochemicals. PLA has many uses in surgical sutures, orthopedic implants, drug delivery systems, and disposable consumer products [4], and its use would significantly alleviate waste disposal problems.
Lactic acid can be produced either by chemical synthesis or by microbial fermentation. Chemical synthesis from petrochemical resources always results in racemic mixture of DL-lactic acid, which is a major disadvantage of this approach [5]. The fermentation process is becoming more relevant because the raw materials used in fermentation are renewable in contrast to petrochemicals. Furthermore, the fermentation process could produce optically pure isomers of lactic acid by selecting an appropriate strain [6,7]. Pure isomers, L or D lactic acid, are more valuable than the racemic DL form because each isomer has its own applications in the cosmetics and pharmaceuticals industries. For example, the ratio of Land D-lactic acids influences the properties and the degradability of PLA [8], therefore it is easier to manufacture PLA with specific properties, e.g., degradability, if L and D lactic acid are supplied separately.
The isolation and screening of microorganisms from natural sources has always been the most powerful means for obtaining useful and genetically-stable strains for industrially-important products. LAB that have industrial potential should be homofermentative, i.e., they produce only lactic acid. Recovery of lactic acid and subsequent purification would also be easier in a homofermentative process. Other desirable properties for an industrially-useful LAB are the synthesis of pure isomers and tolerance to high product concentration and high temperature (42˚C or higher) as these external conditions themselves would be useful to minimise contamination of the culture by other microorganisms [9]. Heterofermentative LAB produce carbon dioxide and other types of organic acid besides lactic acid, and are therefore deemed to be lower-yielding strains. Development of a commercially viable process requires: 1) strain with high yield and productivity with minimal amount of interfering by-products; 2) optimized fermentation medium composition having low-cost nutrients; 3) optimized process parameters; and 4) ease of downstream processing for product recovery [10]. Conventional method of medium optimization is laborious and time consuming. In recent years new procedures such as rational screening and genetic engineering have begun to make a significant contribution to this activity but mutagenesis and selection—so-called “random screening”—is still a cost-effective procedure, and for reliable short-term strain development is frequently the method of choice. Mutagenic procedures can be optimized in terms of type of mutagen and dose, mutagen specificity effects can be taken into account and mutagenesis itself can be enhanced or directed in order to obtain the maximum frequency of desirable mutant types among the isolates to be screened.
The objective of this study was to isolate lactic acid bacteria from sugar cane juice and to screen these isolates for desirable traits such as homofermentative ability and the production of single isomeric form of lactic acid. Mutagenesis was included with the aim of screening higher yielding strains of LAB.
2. MATERIALS AND METHODS
2.1. Isolation of LAB
Sugar cane juice was obtained from a local sugar factory (Belle Vue Harel Sugar Estate), of which 10 ml was incubated in duplicate, at 37˚C for 20 hours, in test tubes. Aliquots of the incubated juice were diluted serially to a dilution factor of 10−6 and 0.1ml was spread evenly on MRS agar plates [11], supplemented with sodium azide (0.2 g/l), bromocresol purple (0.12 g/l) and 2% (w/v) sucrose. The plates were then incubated for 44 hours at 37˚C. Of the bacterial colonies that developed on the agar, only those which exhibited a yellow zone were individually picked and streaked on fresh MRS agar plates, supplemented with sodium azide (0.2 g/l), bromocresol purple (0.12 g/l) and 2% (w/v) sucrose, by dilutionstreaking (Quadrant streaking method) to obtain single colonies. This procedure was repeated in order to purify the isolates, which were maintained on MRS agar slants for immediate use and in 20% glycerol for storage at −40˚C.
2.2. Biochemical Tests
Each of the isolates was first tested for catalase by placing a drop of 3% hydrogen peroxide solution on the cells. Immediate formation of bubbles indicated the presence of catalase in the cells. Only those isolates which were catalase-negative were Gram-stained, and only those which were Gram-positive were put through the hot-loop test [12] to determine whether the isolate produced carbon dioxide during fermentation. An isolate was deemed to be a homofermentative lactic acid producer if no gas was produced. Based on the results, ten homofermentative isolates were obtained but only one isolate which showed largest colony, and hence yellow zone formation at 37˚C, was eventually selected for further studies.
2.3. Mutations
Ethidium bromide, a chemical mutagen and the nonionising ultraviolet (UV) radiation of the category UV-B (wavelength between 290 - 320 nm), a physical mutagen were used in an attempt to screen for higher yielding strains of LAB.
Dilutions of 10−4, 10−5 and 10−6 of the bacteria culture in the logarithmic growth phase (17 hour culture) were plated onto MRS agar supplemented with sucrose (2% w/v) and bromocresol purple (0.12 g/l). The Petri plates were irradiated with UV light (power of 25 W, wavelength of 302 nm, distance of 30 cm) for 5, 10, 15, 20, 25, 30, 60, 90 and 120 seconds. The experiment was repeated with the Petri-dishes exposed to a lower UV intensity (power of 15 W, wavelength 302 nm, distance of 30 cm) for 15, 20, 25, 30, 45, 60, 75, 90, 105 and 120 seconds. A control was included which consisted of 10−4, 10−5 and 10−6 dilution cultures not exposed to UV irradiation. All cultures were kept in complete darkness by wrapping in aluminium foil, at 37˚C for 48 hours. Biochemical tests were performed on colonies having 1% survival rate.
For the chemical mutagenesis, a modified Gawel et al. procedure was used [13]. Bacteria culture in the logarithmic growth phase (17 hour culture) were harvested and washed twice with cold sterile 0.9% NaCl solution. To 2 ml of each cell suspension, 0.05, 0.25, 0.5 and 0.75 mg/ml of ethidium bromide were added. The mixture was aerated on an orbital shaker at 37˚C for 30mins at a speed of 200 rpm. The treated cells were washed once with 0.9% NaCl solution and twice with MRS broth. After serial dilution with 0.9% NaCl, the cells from each treatment were spread on MRS agar plates, of dilution factors 10−4, 10−5 and 10−6, and incubated at 37˚C for 60 hr. A control was included which consisted of 10−4, 10−5 and 10−6 dilution cultures not exposed to ethidium bromide. Mutants were isolated from plates showing only 1% survival followed by biochemical tests.
2.4. Qualitative Determination of Fermentation End-Products
For the qualitative determination process, a modified Ramanjooloo et al. [14] protocol was used. The purpose of qualitatively determining the fermentation end-products was to find out whether a homolactate bacterium had genuinely been isolated and the effects of the different mutagenesis methods on the yield of lactic acid.
2.5. 1H-NMR Analysis
Proton 1H NMR spectra were generated at 250 MHz (Bruker FT Spectrometer), using acquisition parameters set as follows: number of scans, 32; wobble sweep width, 4 MHz; acquisition time, 6.36 s; pre-scan delay, 6.50 µs; T, 300 K; spectral width, 5.15 MHz; number of dummy scans, 2 and broadband 1H decoupling. The same 1HNMR analysis was then repeated with sterile un-inoculated fermentation medium as blank, and commercial D,Lacemic mixture of lactic acid as reference.
2.6. 13C-NMR Analysis
As a confirmatory analysis, carbon 13C NMR of the originally isolated strain (OIS) fermentation medium and commercial D,L-racemic mixture of lactic acid were run overnight for 18 hours in D2O. The spectra were generated at 250 MHz, using acquisition parameters set as follows: number of scans, 15 300; wobble sweep width, 4 MHz; acquisition time, 2.18 s; pre-scan delay, 6.50 µs; T, 300 K; spectral width, 15 MHz; number of dummy scans, 4.
2.7. Quantification of Lactic Acid
A 5% (v/v) inoculum of each of the OIS and the highest yielding LAB (U2) was separately dispensed, in duplicate, in 250 ml of pre-treated sugarcane juice, contained in 500 ml Erlenmayer flasks. The latter were aerobically incubated in a thermostatically controlled orbital shaker at 37˚C for 28 hours, at a speed of 150 rpm. An 11 ml aliquot of juice was axenically removed from each flask at every 2 hours interval, centrifuged at 5000 rpm for 5 minutes in a 15 ml corning tube, and the pH and percentage Brix of the filtrate were measured using a pH meter (Mettler Toledo AG) and a refractometer (RR32 Nr03310 Schmidt and Haensch), respectively. Subsequently, 10 ml of each filtrate aliquot was diluted with an equal volume of water and 5 drops of 1% phenolphthalein indicator was added, before 0.1 M sodium hydroxide (NaOH) was titrated against the mixture, till a pink endpoint was attained. Finally, the whole process was repeated using the pre-treated molasses, and all the results were processed using the Minitab statistical software.
The volume of NaOH was used to estimate the concentration of lactic acid produced by the LAB using the equation: 0.9 Ѵ where “Ѵ” represents the volume in ml, of 0.1 M NaOH required to neutralize 10 ml of lactic acid solution.
3. RESULTS & DISCUSSION
3.1. Isolation & Characterisation of LAB
Seventeen (17) of the several colonies growing on MRS agar plates supplemented sugar cane juice, sodium azide (0.2 g/l), bromocresol purple (0.12 g/l) and 2% (w/v) sucrose after incubation at 37˚C for 44 hours were selected. All of the seventeen isolates were catalase negative and Gram positive (Figure 1) and can thus be morphologically classified in the Lactobacillus genus. Out of these isolates, ten (10) yielded a negative hot-loop test and were therefore identified as being homofermentative.
Sodium azide, being a potent iron-porphyrin inhibitor, was effective in inhibiting the growth of most non-LAB and fungi. Since LAB do not synthesize iron-porphyrin, they are able to grow in the presence of sodium azide. This characteristic of Lactobacillus is also responsible for the negative catalase test. For the visual identification of LAB, bromocresol purple (0.12 g/l) was found to be most effective (Figure 2). Being a pH indicator, bromocresol blue, upon lactic acid production, changes from purple to yellow. The yellow area around a bacterial colony gives an indication of the amount of lactic acid produced by it.
The incubation temperature of 37˚C was chosen as
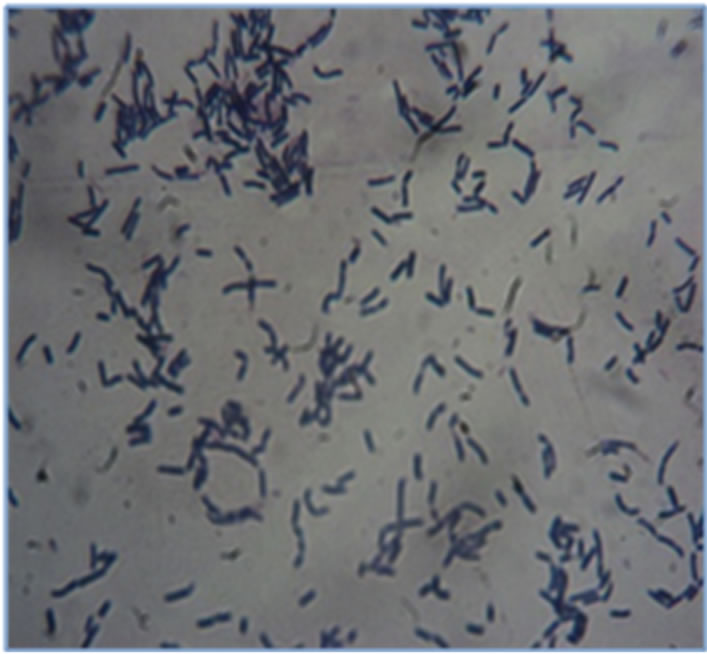
Figure 1. Gram positive LAB.
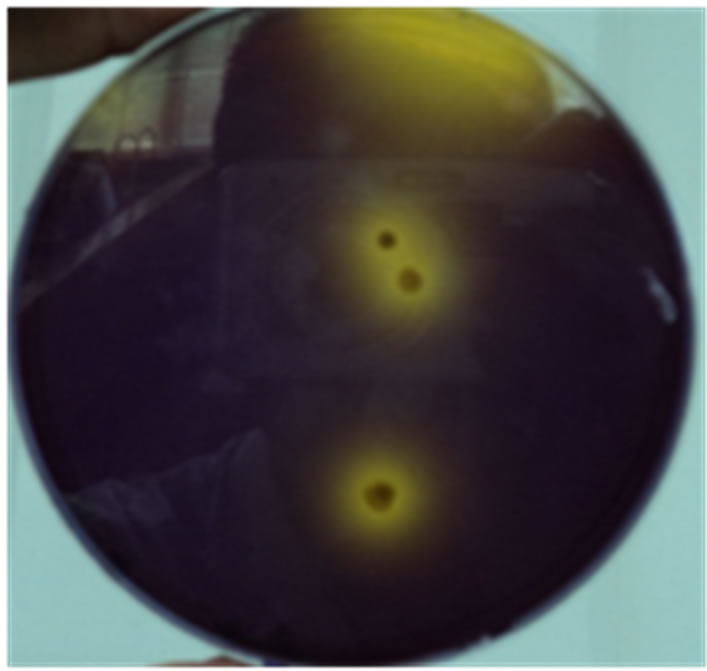
Figure 2. LAB easily visualized using bromocresol blue (0.12 g/l).
according to Adnan & Tan [4], the peak of reproductive and activity of mesophilic bacteria is achieved at this temperature.
3.2. Mutagenesis
The effects of exposure time and irradiation intensity of the UV-B and the effects of concentration of ethidium bromide on survival rate are shown in Tables 1 and 2 respectively.
As expected, as the intensity and exposure time was increased, there was a reduction in the survival rate of the organisms. The organisms which survived the highest exposure time for each of the radiation intensity were selected for further tests.
The higher the concentration of ethidium bromide used, the lower was the survival rate of the organisms.
A total of 112 mutants were isolated following mutagenesis out of which nine (9) were homofermentative and were selected for further investigation (Tables 3 and 4).
UV is the most common physical mutagen. Ultraviolet irradiation can increase the energy of the inner electron in
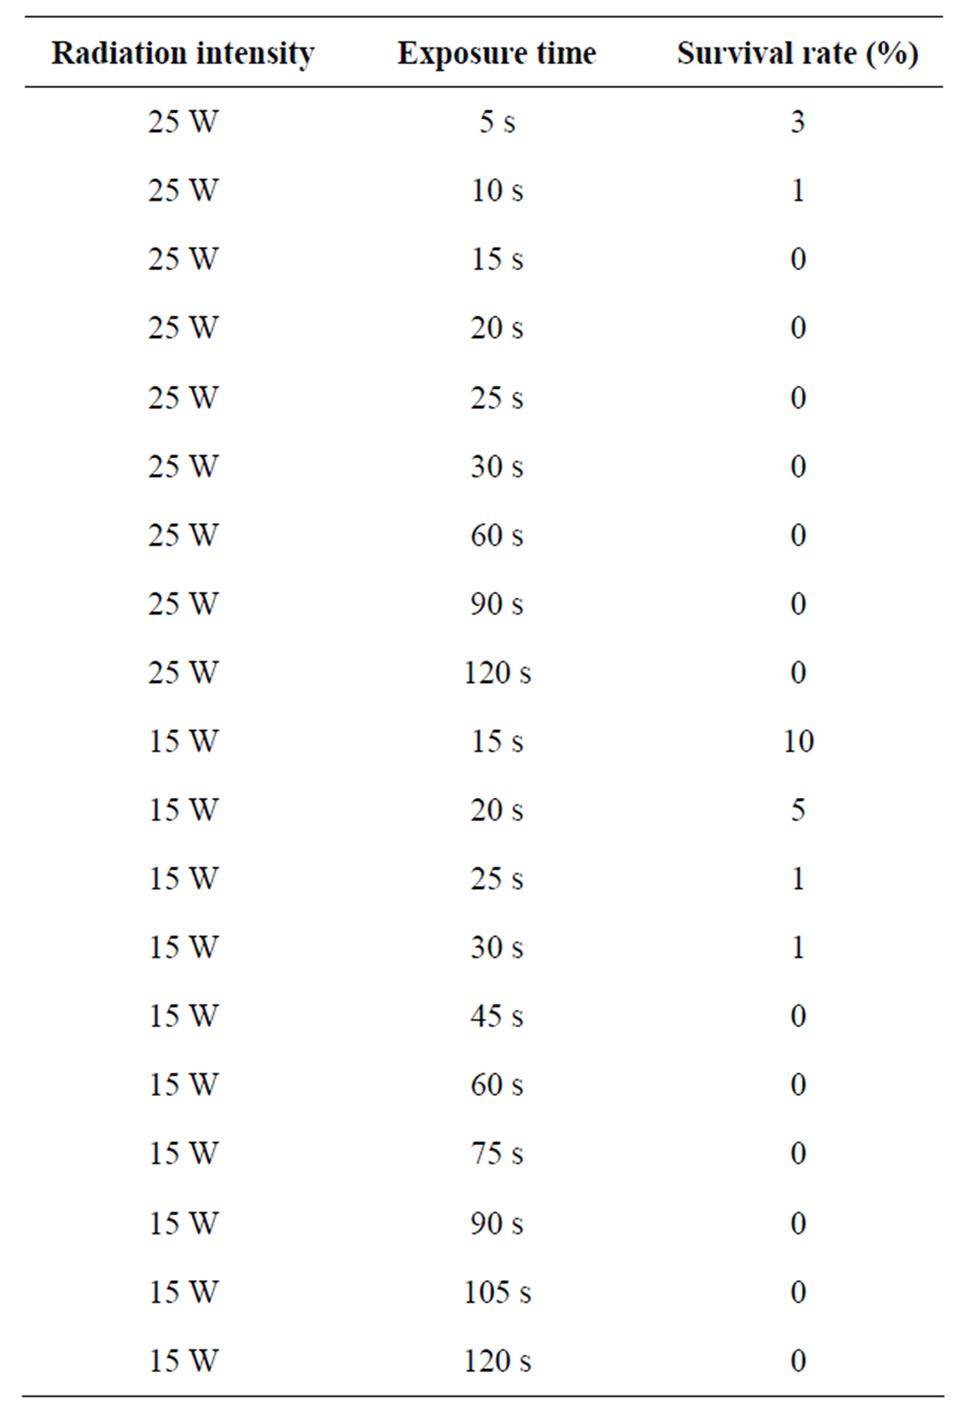
Table 1. Effects of exposure time and irradiation intensity of the UV-B on survival rate.
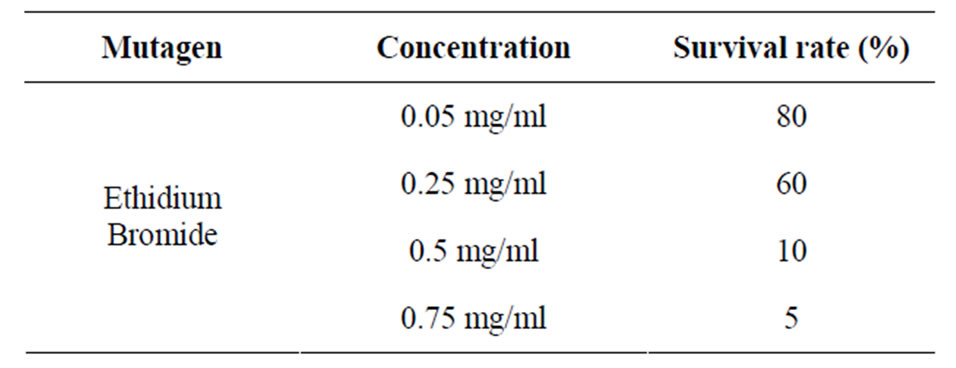
Table 2. Effects of ethidium bromide concentration on survival rate.
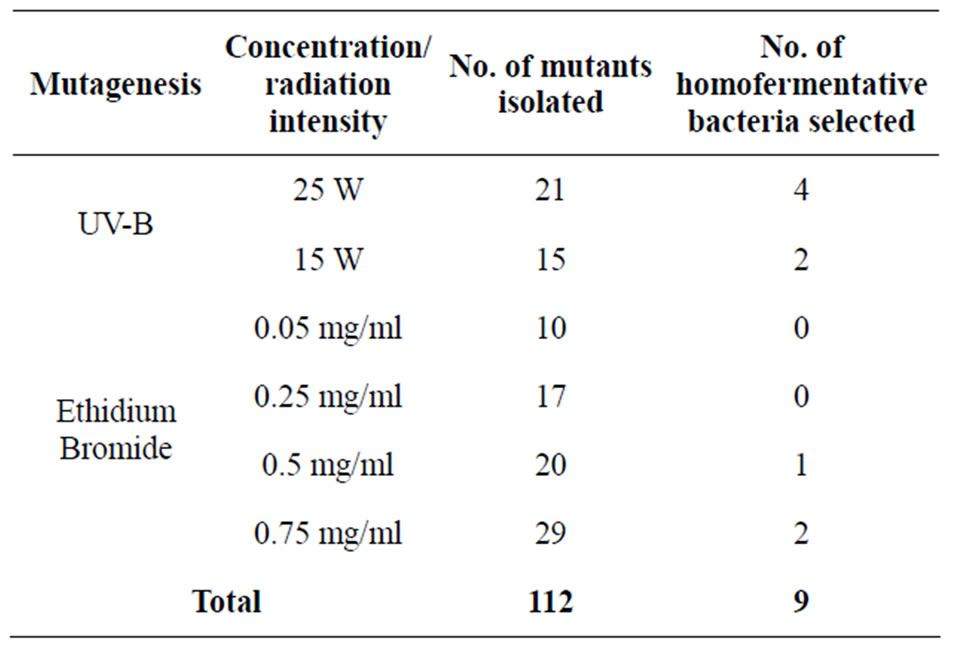
Table 3. Total number of mutants isolated and number of homofermentative bacteria selected following mutagenesis.
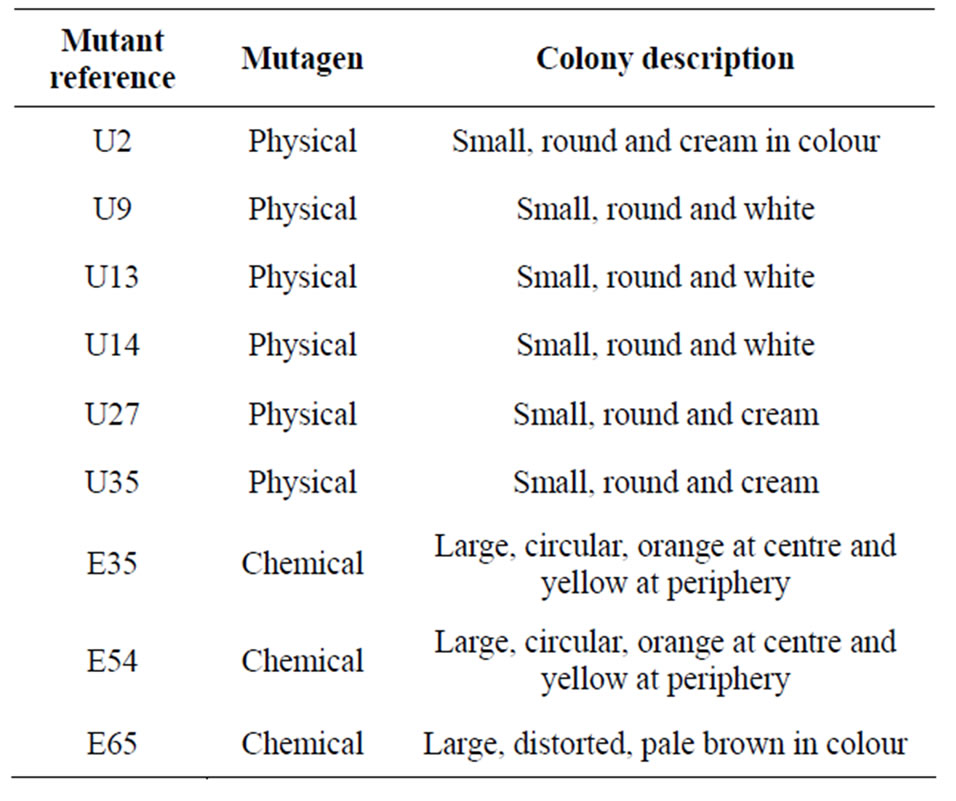
Table 4. Summary of selected LAB mutants.
the atom and can make the inner electron into the active molecule. The energy of UV is about 3 - 5 ER. Even though the energy is very weak and the penetrability of UV cannot cause ionization, the UV can change the structure of DNA; for example, DNA strand breakage, cross linking of intramolecular and intermolecular in the DNA, cross linking of nucleic acid and protein, hydration of cytosine and uralic, formation of pyrimidine dimmers [15,16]. The main effect of UV mutation is to format thymine dimmers which can change the biological activity of DNA and cause bacterial mutation even after death [17]. Excessive UV irradiation can cause loss of a large segment of DNA cells or can make the cross linked DNA unopened and prevent replication and transcription of DNA. In other words, excessive UV can induce cell death. The amount of mutagen can influence the bacteria lethality directly. Large amounts of mutagen cause high lethality (about 90% - 99%). The fewer the positive mutant strains, the more negative mutant strains are in the survival cells. However, high efficiency strains may be selected from a few positive mutant strains. Small amounts of mutagen can cause a lethality of 50% - 80%. According to Beggs [18], while more positive mutant strains are in the survival cells, a few high efficiency strains may also be there.
Ethidium bromide (EB) (2,7-diamino-9-phenylphenanthridium-1-ethyl bromide) has been used for a variety of biological purposes. EB has shown to induce petite mutations in yeast [19], it has been used to eliminate penicillinase plasmids and resistance transfer factors from bacterial cells [20], it is an inhibitor of nucleic acid biosynthesis [21], and it functions as a mutagen in bacterial cells [22]. EB binds to nucleic acids in vitro and is a commonly used intercalating agent [23] leading to nucleotide insertions and frameshifts. In addition, EB binds to cell membranes with a subsequent enhancement of fluorescence [24]. Low concentration of EtBr has been long known as a mutagen to dramatically inhibit the mtDNA synthesis [25].
Based on morphological characterisation of the mutant colonies, chemical mutagenesis proved to be a better method than physical mutagenesis.
3.3. 1H NMR Analysis of Fermentation Medium
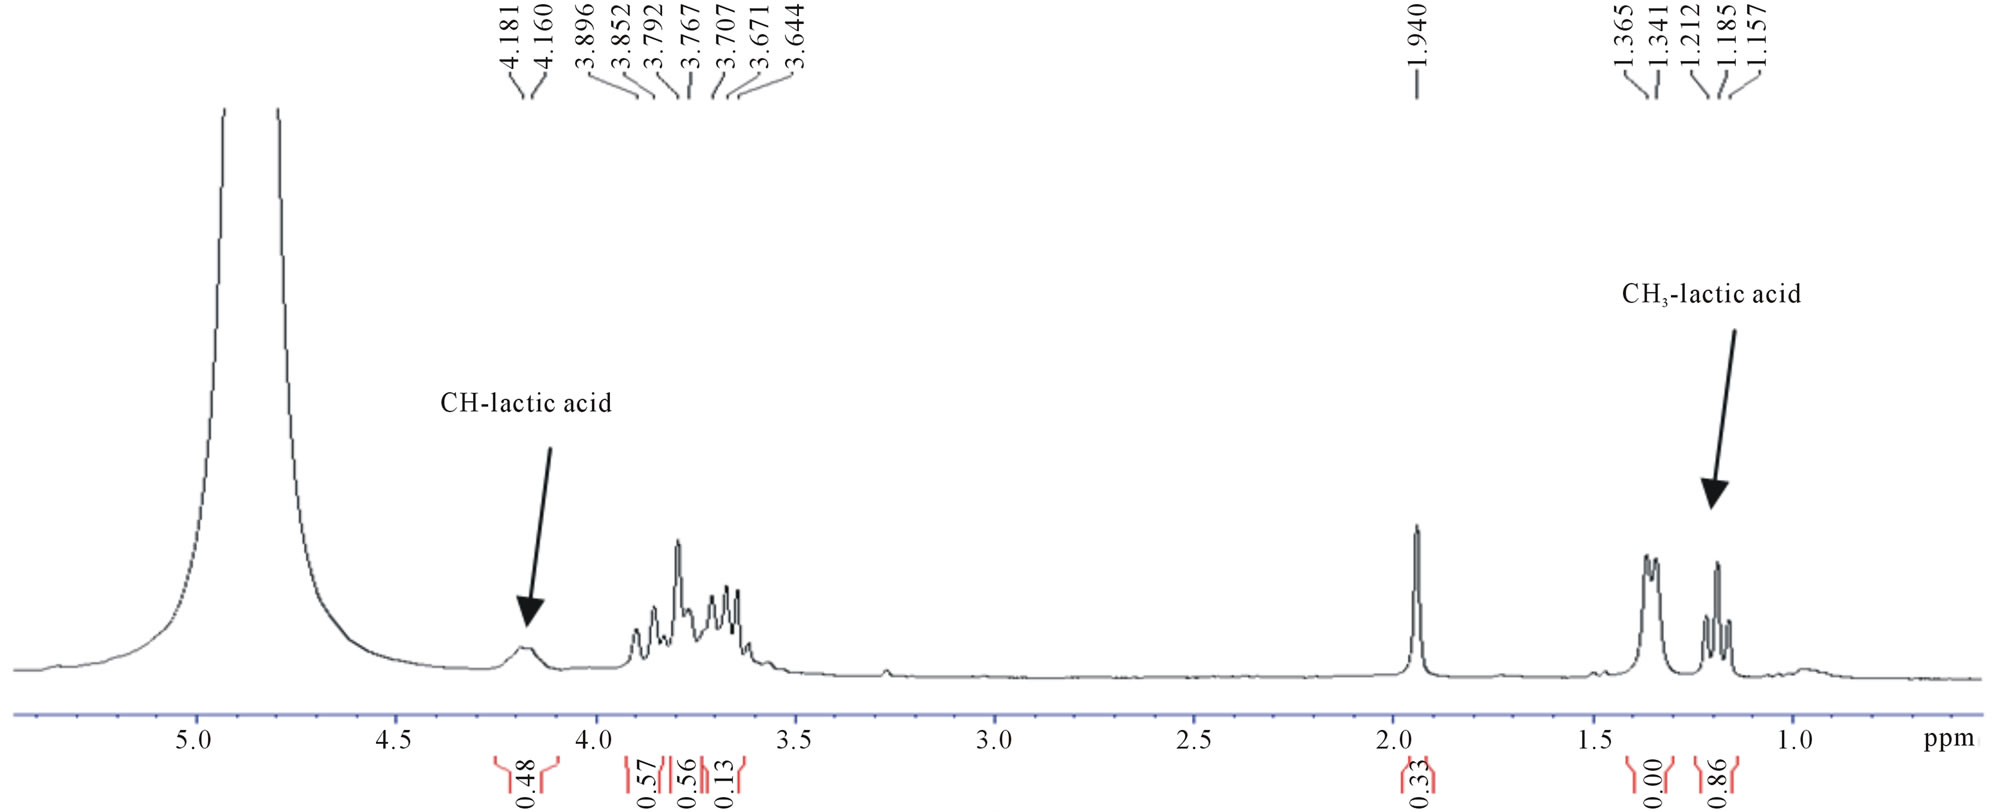
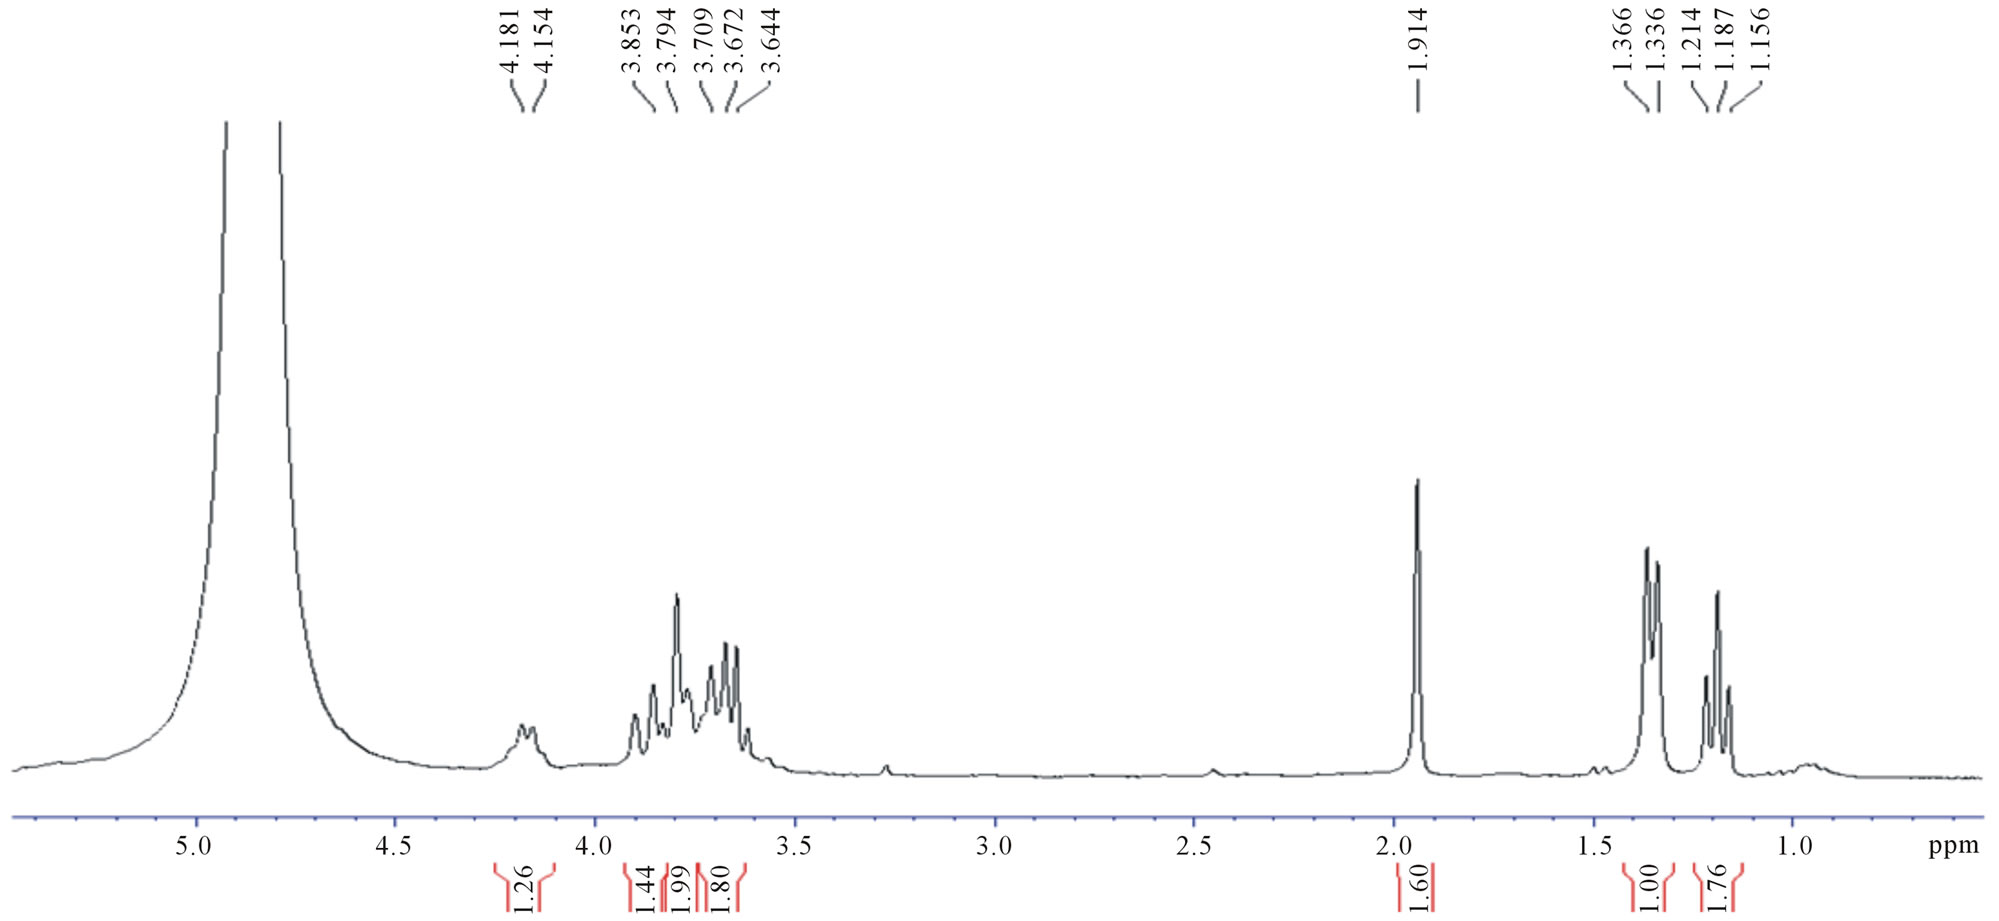
1H NMR spectra of fermented products from UVand EtBr-generated mutants, and OIS were recorded in D2O. The spectra showed similar signals and were compared with that of commercial D,L-lactic acid (Figures 3 and 4). The multiplet centered at 4.2 ppm was assigned to the methine (CH) protons and the triplet centered at 1.2 ppm assigned to the methyl (CH3) protons of lactic acid respectively [14]. A doublet centered at 1.35 ppm was detected in all the spectra including that of commercial D,L-lactic acid and was assigned to the methyl protons oligo-lactic acid (Figure 3(b)). A difference in signal intensity was seen and varied between strains. The latter is due to the different concentrations of products formed with the various strains.
The presence of a multiplet between 3.6 and 3.9 ppm and a singlet at 1.9 ppm was also detected both in the fermented products and blank (Figure 3(c)). The multiplet in the region 3.5 - 4.0 ppm indicates the presence of unfermented sucrose whereas the singlet centered at 1.9 ppm was found to correspond to a component of the MRS broth.
As the 1H-NMR spectra of all the mutants illustrated identical peaks to that of the OIS (Figure 3(a)), it implied that the same components were produced in all of them, and that, both mutagenesis processes did not result in the production of any novel substance.
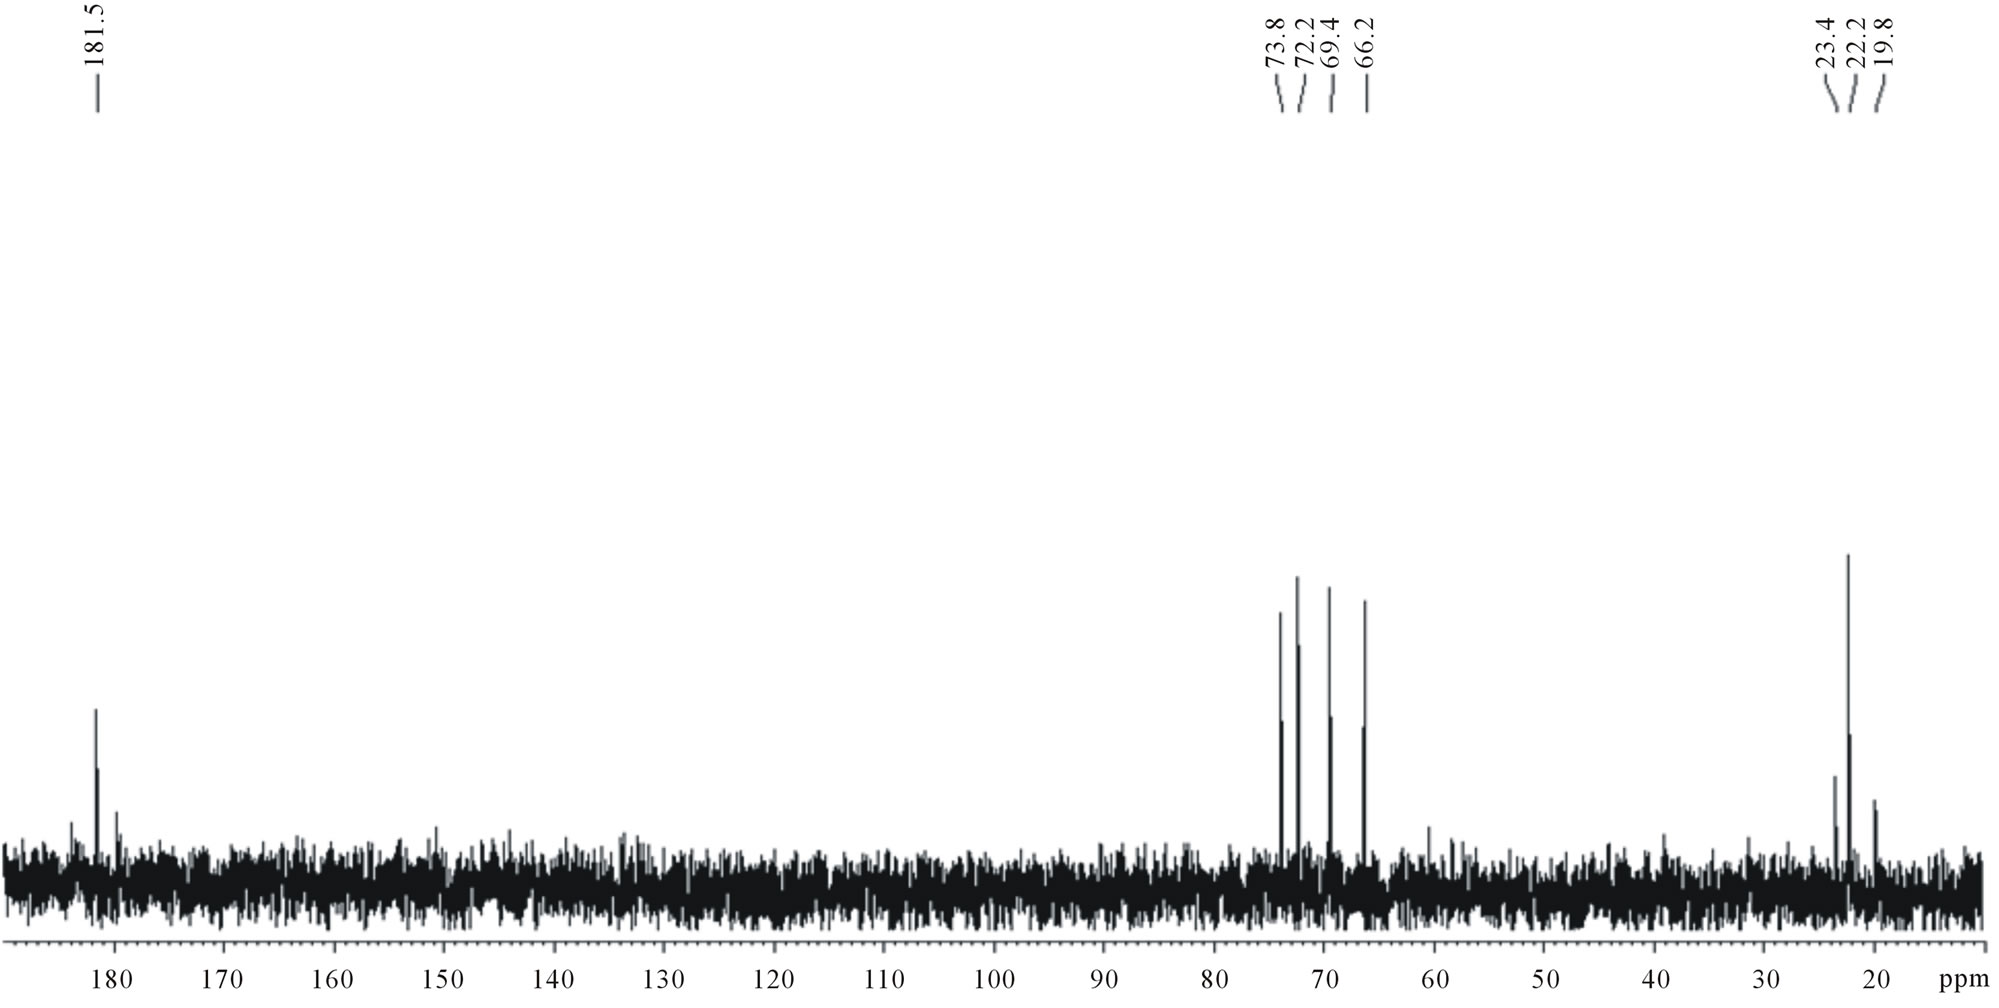
3.4. 13C-NMR Analysis
Three series of signals were obtained in the 13C-NMR spectrum of the OIS fermentation medium: 20 - 23 ppm; 66 - 74 ppm; and 175 - 181 ppm (Figure 5(a)). The spectrum of commercial D,L-lactic acid also showed similar series of signals (Figure 5(b)) confirming that lactic acid was produced by the OIS. The signals were assigned as follows: 20 - 23 ppm (CH3); 66 - 74 ppm (CH), and 181 ppm (CO). In addition, the carbonyl region indicated the presence of more than one signal which confirms that oligomers of different lengths were produced.
3.5. Estimation of Fermentation Components
Upon comparison of proton intensities from 1H-NMR spectra in the region 3.6 - 3.9 ppm with those at 1.3 ppm, the percentage ratio of lactic acid to fermented sucrose was determined, which showed a change in the percentage of sucrose utilisation and lactic acid production, with respect to each strain. The OIS was found to utilise 51.4% sucrose and produce 20.1% lactic acid, whereas the highest yielding UV-generated mutant (U2) utilised 55% sucrose and produced 21.7% lactic acid, after 46 hours of fermentation. The other mutants also showed positive and as well as negative alterations (Figure 6).
3.6. Quantification of Lactic Acid
After 28 hours of incubation in cane juice, a maximum concentration of 29 g/l lactic acid (Productivity of 1.04 g/l/h) was produced by mutant U2, as compared to OIS which produced around 19 g/l (Productivity of 0.68 g/l/h). A third-order polynomial model was found to best fit the production rate of both strains, as an R2-value of 0.999 and 1.000 resulted for the OIS and U2 curve, respectively (Figure 7). The equations which correlated the concentration of lactic acid with time were:
 (1)
(1)
 (2)
(2)
where eq.1 was representative of OIS, eq.2 representative of U2, y: concentration of lactic and x: time.
In addition, the P-values calculated at a 5% level of significance were much smaller than 0.05 for both curves.
 (a)
(a)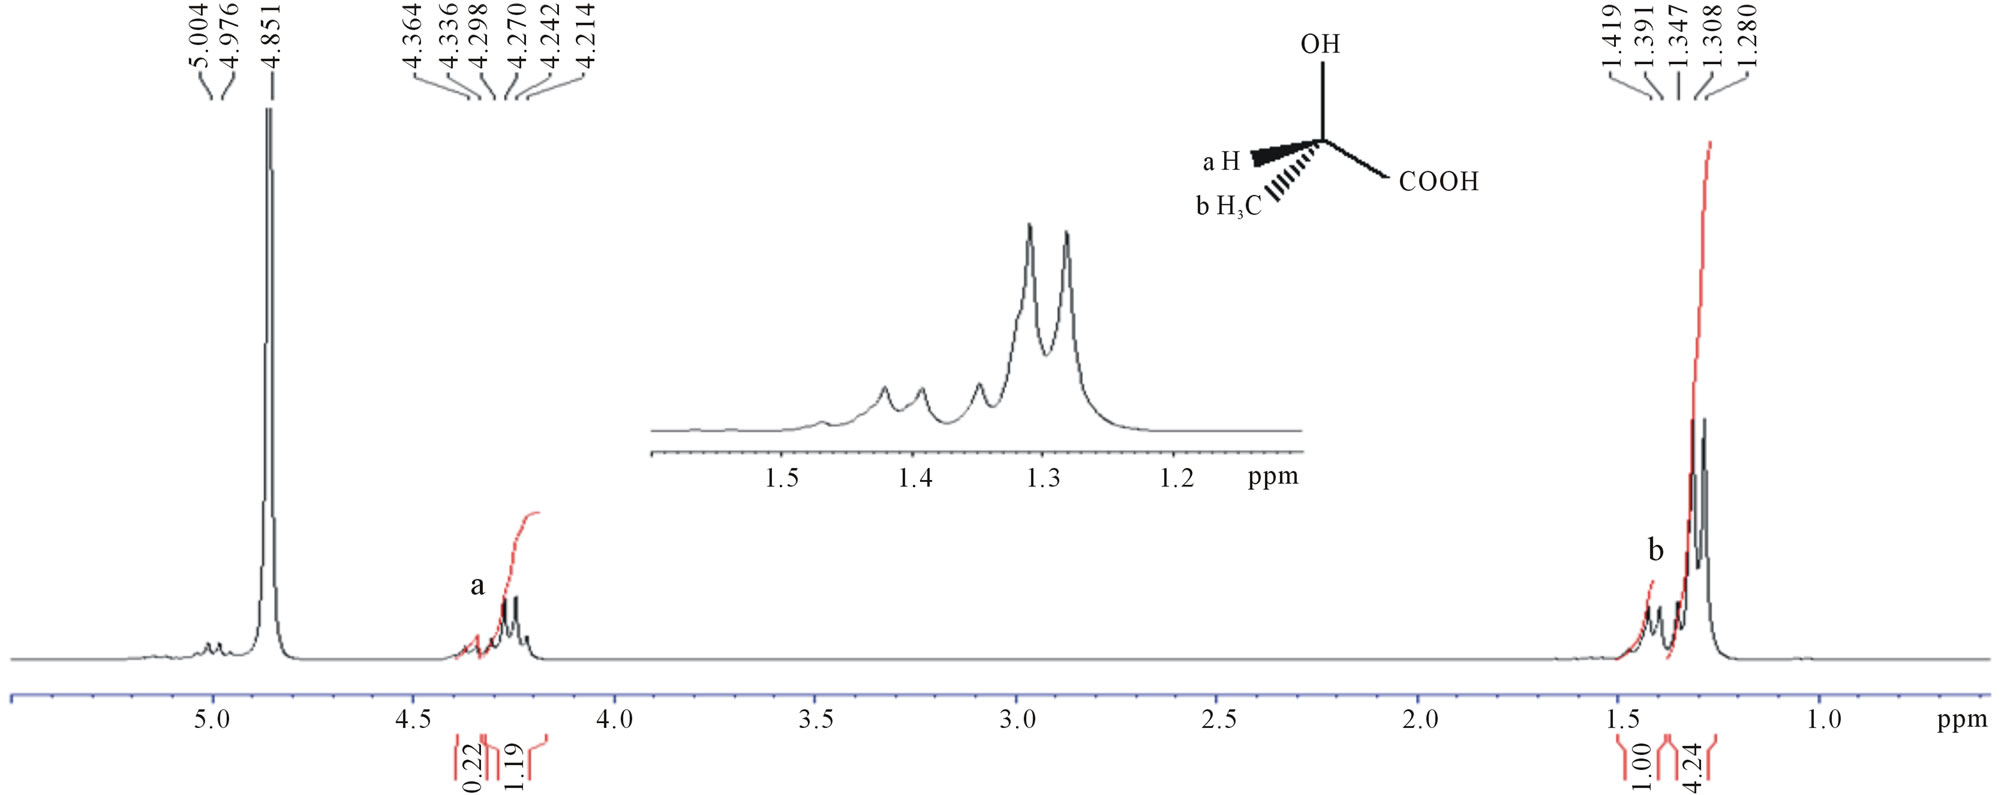 (b)
(b)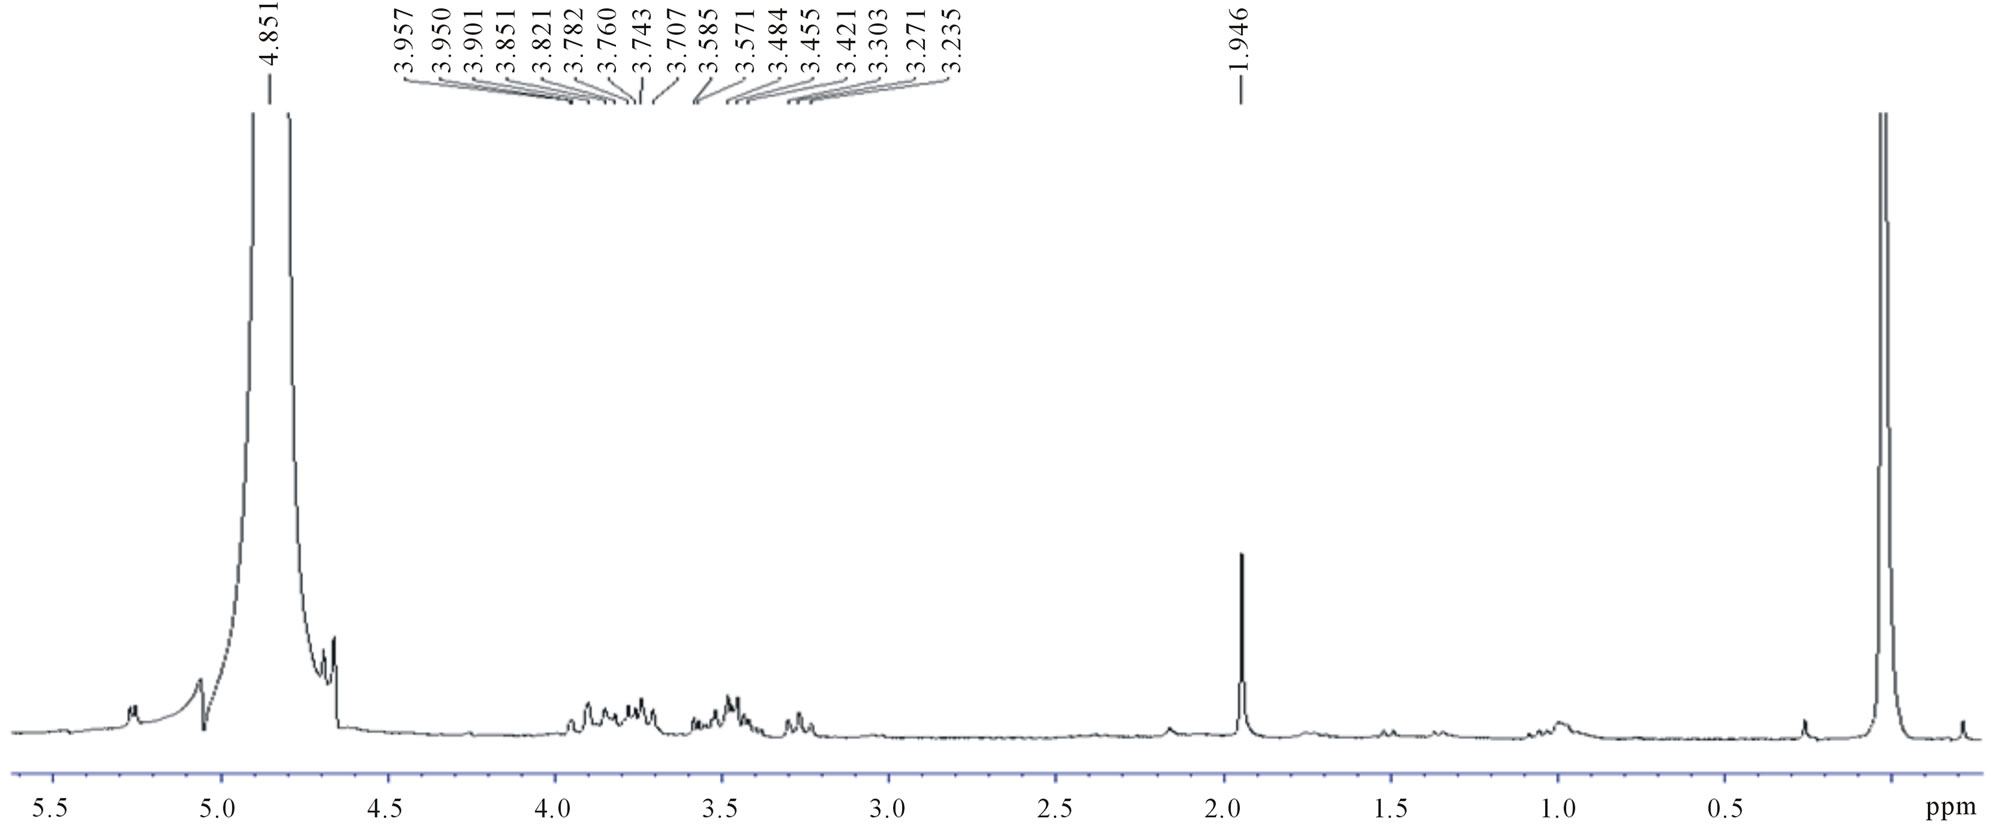 (c)
(c)
Figure 3. 1H-NMR spectra of (a) OIS fermentation medium (b) Commercial D,L-lactic acid; (c) MRS broth (Blank).
 (a)
(a)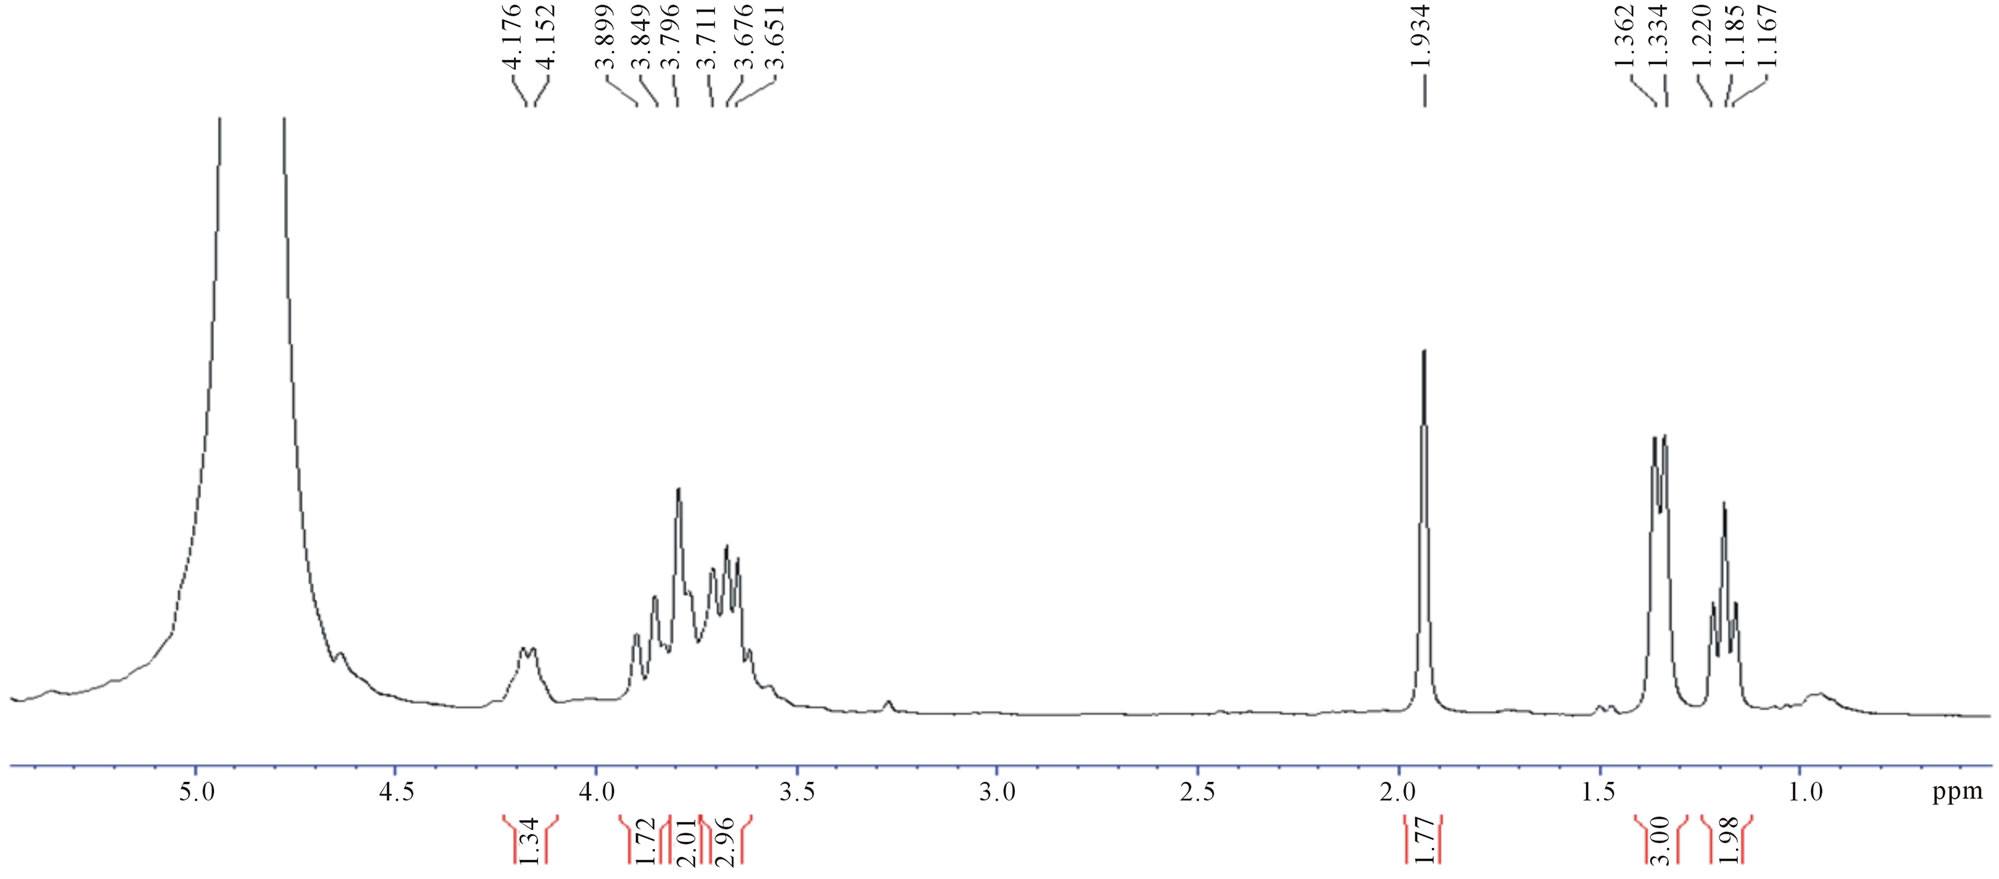 (b)
(b)
Figure 4. 1H-NMR spectra of fermentation products of (a) UV-generated mutant, U2; (b) EtBr-generated mutant, E35.
A third-order polynomial model was also found to best fit the decreasing rate of sugars in cane juice (Figure 8), with the following equations:
 (3)
(3)
 (4)
(4)
where eq.3 represented OIS, eq.4 represented U2, y: percentage sugars and x: time.
A P-value much smaller than 0.05 was calculated at a 5% level of significance, for both strains.
A 3% decrease was observed in the U2 fermentation medium, as compared to that of OIS, which resulted in only 2%, that is, from 20.5% (w/v) initially, to 18.25% (w/v) by OIS and 17.5% (w/v) by U2.
The concentrations of lactic acid obtained with the OIS and U2 for cane juice fermentation actually underestimate the real values for several reasons. LAB growth is normally inhibited by the increase in lactic acid production due to the solubility of the undissociated form of the organic acid within their cytoplasm. As a result, the acidification caused the proton motive force to fail, leading to the inhibition of nutrient transport, and hence, cell death [26]. In addition, Kotzamanidis et al., [27] have reported that the increasing concentration of lactate lead to autolysis of the bacterial cells, thereby causing a
 (a)
(a)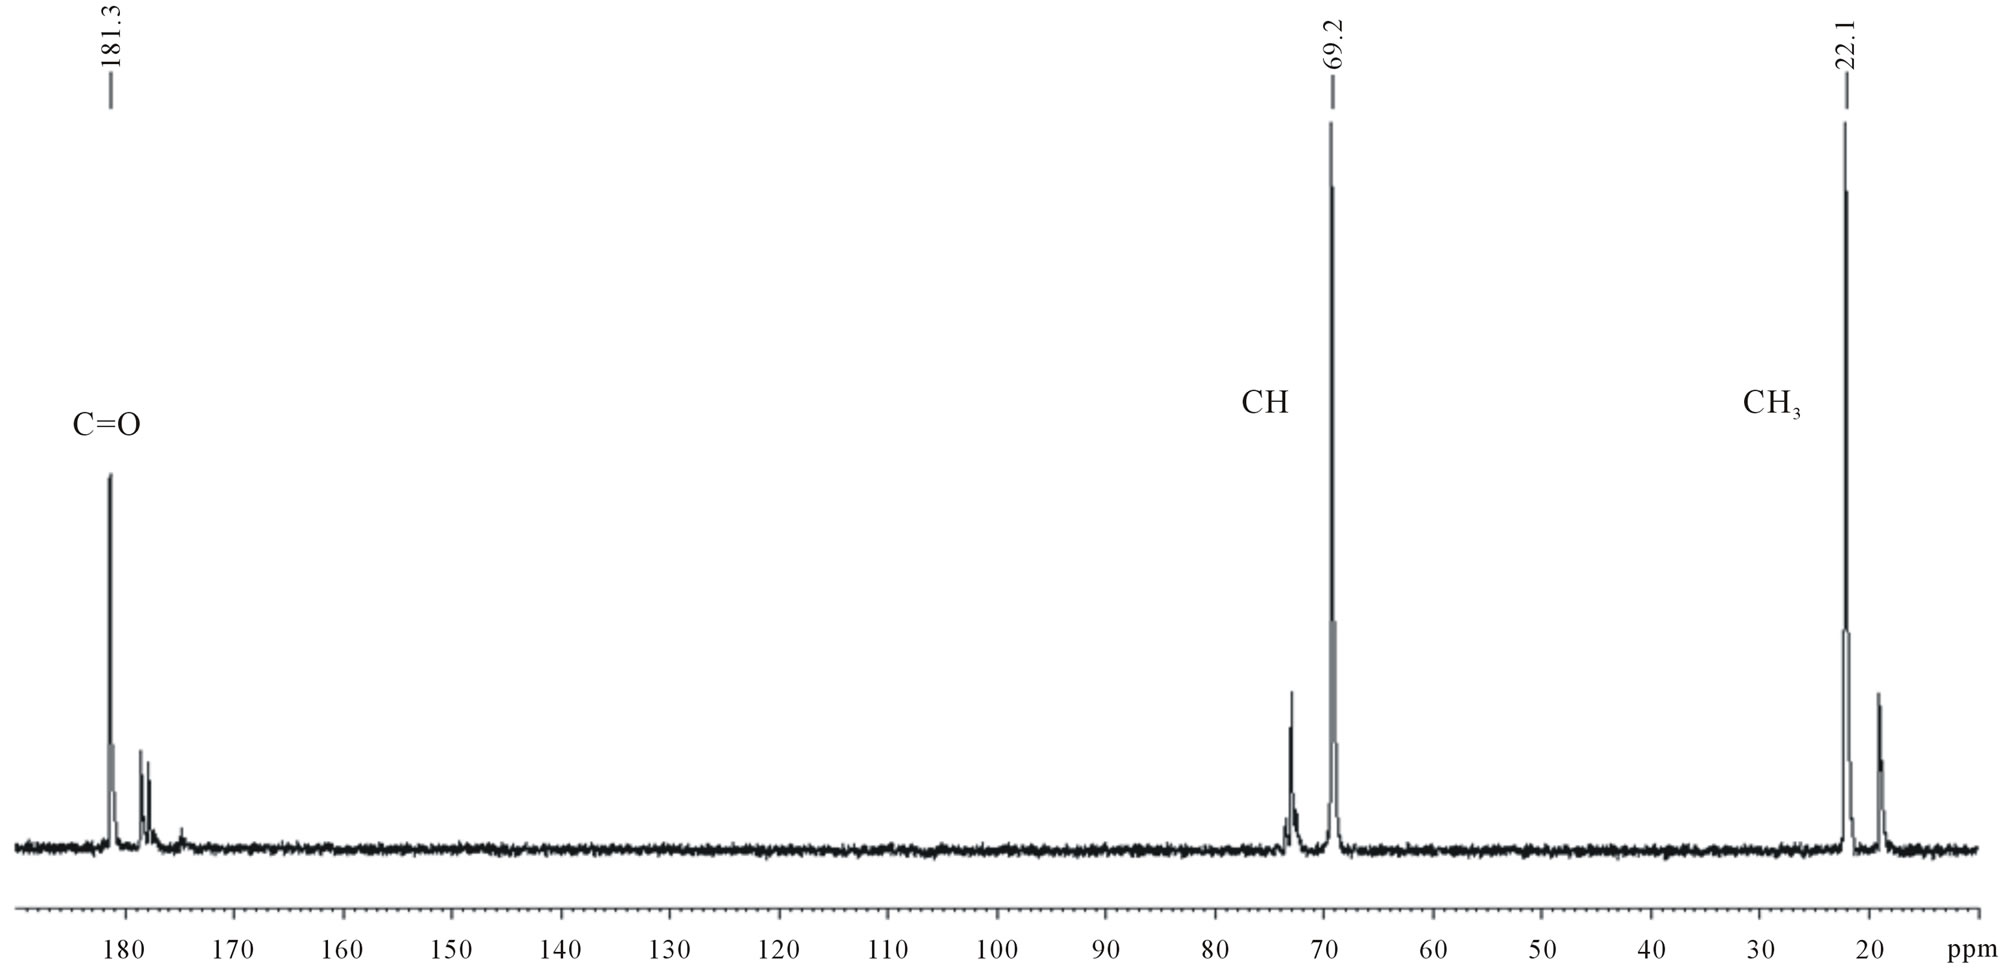 (b)
(b)
Figure 5. 13C-NMR spectra of (a) OIS fermentation medium; (b) Commercial D,L-lactic acid.
decrease in cell biomass. However, the liberated lactate dehydrogenase enzymes continue to be active, which explains why the lactate concentration continued to rise even shortly after.
The percentage change in sugar utilization remained almost the same for both OIS and U2. During the whole fermentation process, using either sugar cane juice or molasses, a decrease in pH was noted from an initial pH of around 6.5 - 7.0 to 2.5 - 4.0.
4. CONCLUSION
Through the strategy of isolation, mutagenesis and screening used in the present study, we have been able to isolate nine lactic acid bacteria capable of producing pure L-Lactic acid. The microorganisms isolated could therefore play an important role in the production of optically pure isomers of lactic acid in addition to alleviating waste disposal problems. We are now in the process of optimizing the fermentation conditions and
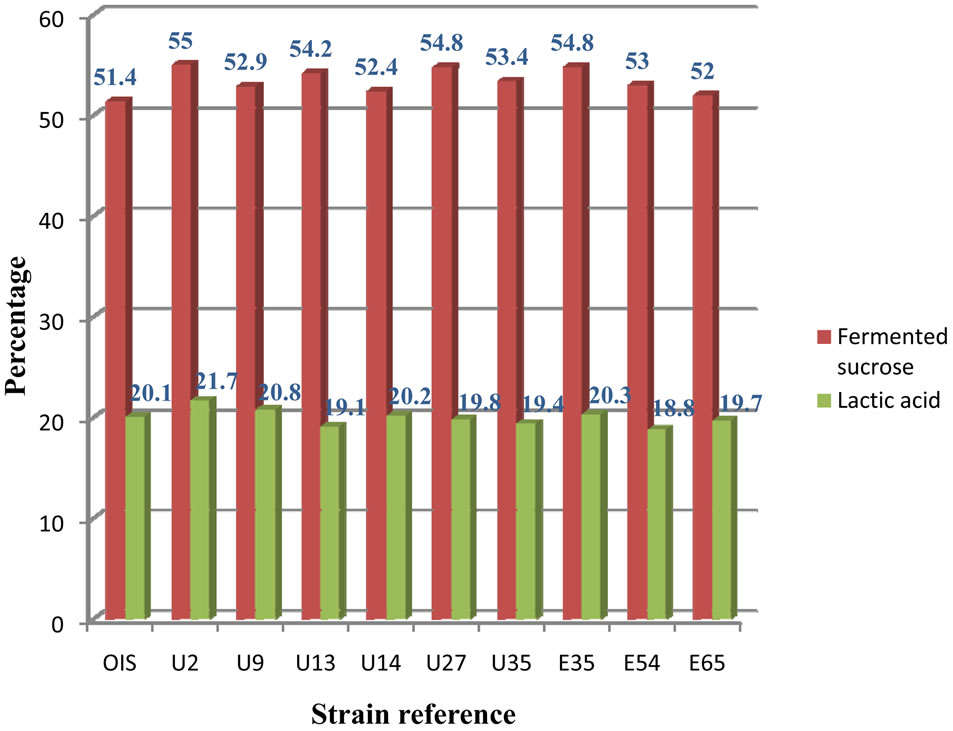
Figure 6. Percentage of lactic acid produced and sucrose utilized by each strain as determined from 1H-NMR data.
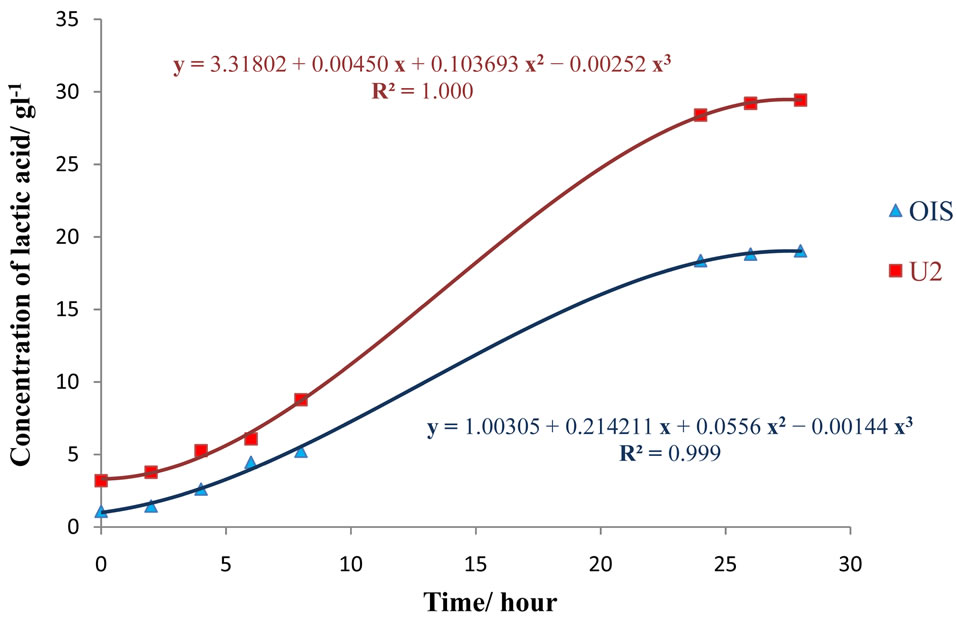
Figure 7. Lactic acid production by OIS and U2 strain from cane juice.
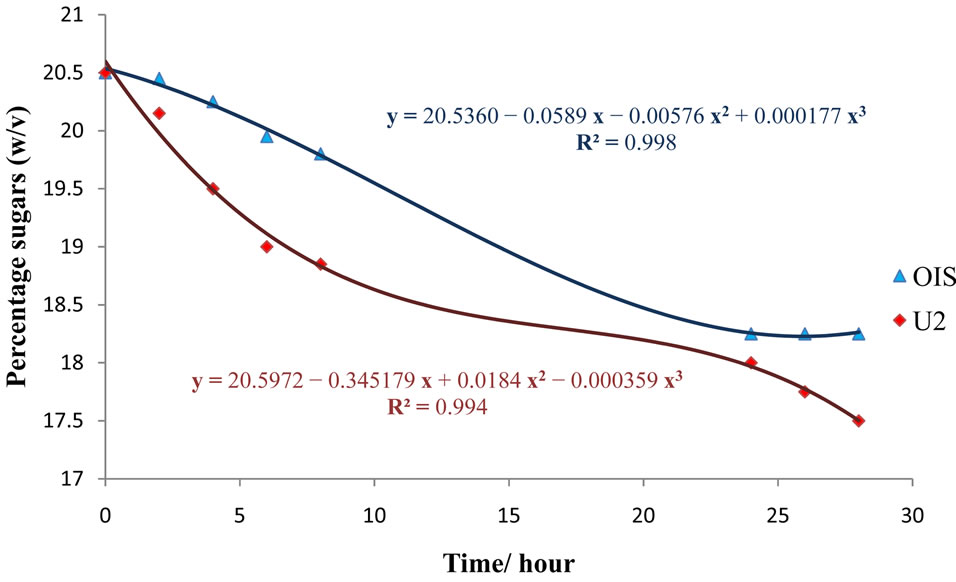
Figure 8. Sugar utilization from cane juice by OIS and U2.
characterizing the isolates by 16S rDNA gene sequence.
5. ACKNOWLEDGEMENTS
The authors wish to thank the Belle Vue Harel Sugar Estate (Mauritius) for providing the sugar-cane mixed juice for this study. The support of the technical staff of the Botany Department of the Faculty of Agriculture, in particular Mrs. A. Issany and Mrs D. Bhookun-Seeruttun, and Ms. S. L’Omelette Department of Chemistry, Faculty of Science, University of Mauritius, is gratefully acknowledged.
REFERENCES
- Oshiro, M., Shinto, H., Tashiro, Y., Miwa, N., Sekiguchi, T., Okamoto, M., Ishizaki, A. and Sonomoto, K. (2009) Kinetic modeling and sensitivity analysis of xylose metabolism in Lactococcus lactis IO-1. Journal of Bioscience and Bioengineering, 108, 376-384. doi:10.1016/j.jbiosc.2009.05.003
- Singhvi, M., Joshi, D., Adsul, M., Varma, A. and Gokhale, D. (2010) D-(−)-Lactic acid production from cellobiose and cellulose by Lactobacillus lactis mutant RM2-24. Green Chemistry, 12, 1106-1109. doi:10.1039/b925975a
- Tashiro, Y., Kaneko, W., Sun, Y., Shibata, K., Inokuma, K., Zendo, T., Sonomoto, K. (2011) Continuous D-lactic acid production by a novel thermotolerant Lactobacillus delbrueckii subsp. lactis QU 41. Applied Microbiology and Biotechnology, 89, 1741-1750. doi:10.1007/s00253-010-3011-7
- Adnan, A.F.M. and Tan, I.K.P. (2007) Isolation of lactic acid bacteria from Malaysian foods and assessment of the isolates for industrial potential. Bioresource Technology, 98, 1380-1385. doi:10.1016/j.biortech.2006.05.034
- Hofvendahl, K. and Hahn-Hägerdal, B. (2000) Factors affecting the fermentative lactic acid production from renewable resources. Enzyme and Microbial Technology, 26, 87-107. doi:10.1016/S0141-0229(99)00155-6
- Ilmen, M., Koivuranta, K., Ruohonen, L., Suominen, P. and Penttila, M. (2007) Efficient production of L-lactic acid from xylose by Pichia stipitis. Applied and Environmental Microbiology, 73, 117-123. doi:10.1128/AEM.01311-06
- Pandey, A., Soccol, C.R., Rodriguez-Leon, J.A. and Nigam, S. (2001) Production of organic acids by solid state fermentation. In: Solid State Fermentation in Biotechnology: Fundamentals and Applications. Asiatech Publishers, New Delhi, 127.
- Kharras, G.B., Sanchez-Riera, F. and Severson, D.K. (1993) Polymers of lactic acid. In: Molby, D.B., Ed., Plastics from Microbes: Microbial Synthesis of Polymers and Polymer precursors. Hanser Publishers, Munich, 93-137.
- Tsai, S.P., Coleman, R.D., Moon, S.H., Schneider, K.A. and Millard, C.S. (1993) Strain screening and development for lactic acid fermentation. Journal of Bioscience and Bioengineering, 39-40, 323-335. doi:10.1128/AEM.01311-06
- Parekh, S., Vinci, V.A. and Strobel R.J. (2000) Improvement of microbial strains and fermentation processes, Applied Microbiology and Biotechnology, 54, 287-301. doi:10.1007/s002530000403
- de Man, J. C., Rogosa, M. and Sharpe, M.E. (1960) Medium for the cultivation of lactobacilli. Journal of Applied Microbiology, 23, 130-135. doi:10.1111/j.1365-2672.1960.tb00188.x
- Sperber, W.H. and Swan, J. (1976) Hot-loop test for the determination of carbon dioxide production from glucose by lactic acid bacteria. Applied & Environmental Microbiology, 31, 990-991.
- Gawel, D., Maliszewska-Tkacyk, M., Jonczyk, P., Schaaper, R.M. and Fijalkowska, I.J. (2002) Lack of strand bias in UV-induced mutagenesis in Escherichia coli. Bacteriology, 184, 4449-4454. doi:10.1111/j.1365-2672.1960.tb00188.x
- Ramanjooloo, A., Bhaw-Luximon, A., Jhurry, D and Cadet, F. (2009) 1H NMR quantitative of lactic acid produced by biofermentation of cane sugar juice. Spectroscopy Letters, 42, 296-304.
- Pullman, A. and Pullman, B. (1963) The mechanism of ultraviolet-induced mutations. Biochimica et Biophysica Acta, 75, 269-271. doi:10.1016/0006-3002(63)90606-1
- Rohwerder, T., Gehrke T., Kinzler, K. and Sand, W. (2003) Bioleaching review part A: Progress in bioleaching: Fundamentals and mechanisms of bacterial metal sulfide oxidation. Applied Microbiology and Biotechnology, 63, 239- 248. doi:10.1007/s00253-003-1448-7
- Yang, Y., Zhang, S., Xu, A.L., Zou, L.H., Li, L. and Qiu, G.Z. (2010) UV-induced mutagenesis and bioleaching of Acidiphilium cryptum and Acidithiobacillus ferrooxidans. Journal of Central South University (Science and Technology), 41, 393-399.
- Beggs, C.B. (2002) A quantitative method for evaluating the photoreactivation of ultraviolet damaged microorganisms. Photochemistry and Photobiology Science, 1, 431- 437. doi:10.1039/b202801h
- Slonimski, P.P., Perrodin, G, and Croft, J.H. (1968) Ethidium bromide induced mutation of yeast mitochondria: Complete transformation of cells into respiratory deficient non-chromosomal “petites”. Biochemical and Biophysical Research Communications, 30, 232-239. doi:10.1016/0006-291X(68)90440-3
- Rubin, S.J. and Rosenblumn E.D. (1971) Effects of ethidium bromide on growth and on loss of the penicillinase plasmid of Staphylococcus aureus. Journal of Bacteriology, 108, 1200-1204.
- Tomchick, R. and Mandel, H.G. (1964) Biochemical effects of ethidium bromide in microorganisms. Microbiology, 36, 225-236. doi:10.1099/00221287-36-2-225
- Maillet, S. (1969) Action mutagene specifique de trois clorants, sur la mutation reverse d’un gene ProA chez E. coli K12. Comptes Rendus de l’Académie des Sciences, 269, 1708-1711.
- Waring, M.J. (1966) Structural requirements for the binding of ethidium to nucleic acids. Biochimica et Biophysica Acta, 114, 234-244. doi:10.1016/0005-2787(66)90305-4
- Gitler, C., Rubalcava, B. and Caswell, A. (1969) Fluorescence changes of ethidium bromide on binding to erthrocyte and mitochondrial membranes. Biochimica et Biophysica Acta, 193, 479-481. doi:10.1016/0005-2736(69)90208-9
- Yu, M., Yurong, S., Wei, X., Yang, Y., Zhou, Y., Hao, X., Zhang, N. and Niu, R. (2007) Depletion of mitochondrial DNA by ethidium bromide treatment inhibits the proliferation and tumorigenesis of T47D human breast cancer cells. Toxicology Letters, 170, 83-93. doi:10.1016/j.toxlet.2007.02.013
- Goncalves, L.M.D., Ramos, A., Almeida, J.C., Xavier, A.M.R.B. and Carrondo, M.J.T. (1997) Elucidation of the mechanism of lactic acid growth inhibition and production in batch cultures of Lactobacillus rhamnosus. Applied Microbiology and Biotechnology, 48, 346-350. doi:10.1007/s002530051060
- Kotzamanidis, Ch., Roukas, T. and Skaracis, G. (2002) Optimization of lactic acid production from beet molasses by Lactobacillus delbrueckii NCIMB 8130. World Journal of Microbiology and Biotechnology, 18, 441-448. doi:10.1023/A:1015523126741
NOTES
*Corresponding author.