Journal of Environmental Protection
Vol.4 No.11(2013), Article ID:40300,10 pages DOI:10.4236/jep.2013.411153
A Number Description of Ghanaian Water Quality—A Case Study of the Southwestern and Coastal Rivers Systems of Ghana
![]()
1CSIR Water Research Institute, Accra, Ghana; 2Water Resources Commission, Accra, Ghana.
Email: *humdarko@hotmail.com
Copyright © 2013 Humphrey F. Darko et al. This is an open access article distributed under the Creative Commons Attribution License, which permits unrestricted use, distribution, and reproduction in any medium, provided the original work is properly cited.
Received July 3rd, 2013; revised August 5th, 2013; accepted September 2nd, 2013
Keywords: Water Quality Index (WQI); Water Quality; Southwestern Rivers Systems; Coastal Rivers Systems; Water Resources Commission (WRC); Ghana
ABSTRACT
The CSIR Water Research Institute undertook water quality monitoring and assessment of the Southwestern and the Coastal Rivers Systems of Ghana from 2005 to 2008 for the Water Resources Commission of Ghana (WRC) under WRIS II Project, a Danish Government Funded Project. The Southwestern and the Coastal Rivers Systems cover approximately 30% of the total drainage basins of Ghana. A total of 19 surface water stations were selected for the monitoring programme. The Adapted Water Quality Index (WQI) was to be used as a tool to classify the overall ambient water quality at the 19 different stations. The index classified water quality into one of four categories: good (Class I, >80), fairly good (Class II, 50 - 80), poor (Class III, 25 - 50), and grossly polluted (Class IV, <25). This paper presents the Water Quality Index approach to the assessment of water quality of the waters in the different stations during the period of study. These ten water quality parameters were used to determine the water quality index (WQI): Dissolved Oxygen (DO % Saturation), Biochemical Oxygen Demand (BOD), Ammonium Nitrogen (NH4-N), Faecal Coliform (FC), pH, Nitrate as Nitrogen (NO3-N), Phosphate as Phosphorus (PO4-P), Total Suspended Solids (TSS), Conductivity and Temperature. Evaluation of the waters with the WQI indicated that most Ghanaian waters are currently in Class II, the fairly good water quality state, but with variations in this range within the seasons and stations, and from one water body to the other. Potroase in the Densu basin had the best water quality during the study period while Nsawam had the poorest. Efforts should be made to prevent further pollution of the waters to improve their quality.
1. Introduction
Just like human physiological laboratory test results that can only be understood and explained by medical experts or technically trained personnel, water quality data obtained from laboratory analysis on a water body, (or on a water sample) generates results that can only be understood and explained by technical water quality experts. One water sample can have as many as 40 or more variables determined on it. Such numerous variables do not normally communicate any meaningful information to the layman, decision maker, policy makers, water managers or the public, who may need water quality information expressed in a concise form for decision making.
Concise information is needed by water managers and policy makers on the quality of water bodies for decision making. In order to overcome this difficulty or decision making problem and communicate water quality information effectively to the public and water managers, an index that summaries the overall physical, chemical, and biological quality of water, generally called the Water Quality Index (WQI) has been proposed for management of water bodies. The first WQI was developed in the United States by Horton (1965) and applied in Europe since the 1970s, initially in the United Kingdom. It has also found applicability in Africa and Asia [1-5]. This methodology was further improved by the US National Sanitation Foundation [6].
Ramesh et al., [3] defined WQI as a mathematical tool to integrate the complex water quality data into a numerical score that describes the overall water quality status. Saeedi et al. [5] states that the water quality index (WQI) is a mathematical instrument used to transform large quantities of water quality data into a single number which represents the water quality level. The Canadian Council of Ministers of the Environment [7] describes water quality index as a means to summarize large amounts of water quality data into simple terms (e.g., good) for reporting to management and the public in a consistent manner which can tell us whether the overall quality of water bodies poses a potential threat to various uses of water, such as habitat for aquatic life, irrigation water for agriculture and livestock, recreation and aesthetics, and drinking water supplies. This method makes the information more easily and rapidly interpretable than a list of numerical values [8]. Thus a WQI becomes an easy communication tool for transmitting scientific information from experts to the general audience, (for instance, general public, water users, scientists, managers, lawmakers, engineers, etc.) [8,9].
In Ghana, WQI as a tool has become one of the new ways of disseminating scientific information to the general public and policy makers in a more effective manner. Besides being a useful tool for communication, the WQI can be used for comparing water quality of different water bodies, evaluating trends in quality in a water body over time, and for evaluating spatial and temporal variations in water quality in streams and rivers.
2. Materials and Methods
2.1. Steps in Water Quality Index Calculation
The development of Water Quality Index normally involves four different steps [9].
1) The first step is selecting the optimum set of parameters that together reflect the overall quality of the water body with respect to a given end use [9], e.g., drinking water supply, irrigation, recreation, aquatic ecosystem protection, etc. [3,9,10].
2) A second step is the transformation of each parameter, usually having different units of measurement, into a unitless common scale [9,10] of 0 -100 sub-index values, where 100 represents the maximum quality [3,9,10]. The transformation or standardization is often performed by creating empirical rating curves, i.e., empirically establishing a relationship between expected values and dimensionless sub-index values [5]. The main advantage of a rating curve is that it rapidly transforms the concentration of a parameter into a quality score to represent the water quality for a given use [5,8]. The subindex values (established from the rating curves) can also be tabulated in tables for more practical use, where scores are read from the rating table.
3) A third step assigns weights to each selected parameter on the basis of its importance in water quality evaluation [3,9].
4) In calculating the WQI which is the final step, the sub-indices and weight factors of all parameters are aggregated using aggregation function, usually some types of sum or mean (e.g., arithmetic, geometric, etc.) [3,5,9]. The multiplicative and additive aggregation functions are the popular aggregation techniques in the WQI approach [3,5].
The Adapted Solway Water Quality Index (WQI) is calculated from the following equation:
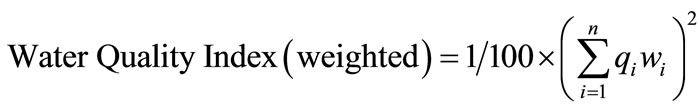 (1)
(1)
where, qi = water quality score of parameter i; wi = weighting factor of parameter i and n = number of parameters.
The aggregation equation generates a single number between 0 and 100, with 0 indicating worst water quality and 100 indicating best water quality. A typical example of the calculation of the WQI is shown in Table 1 below.
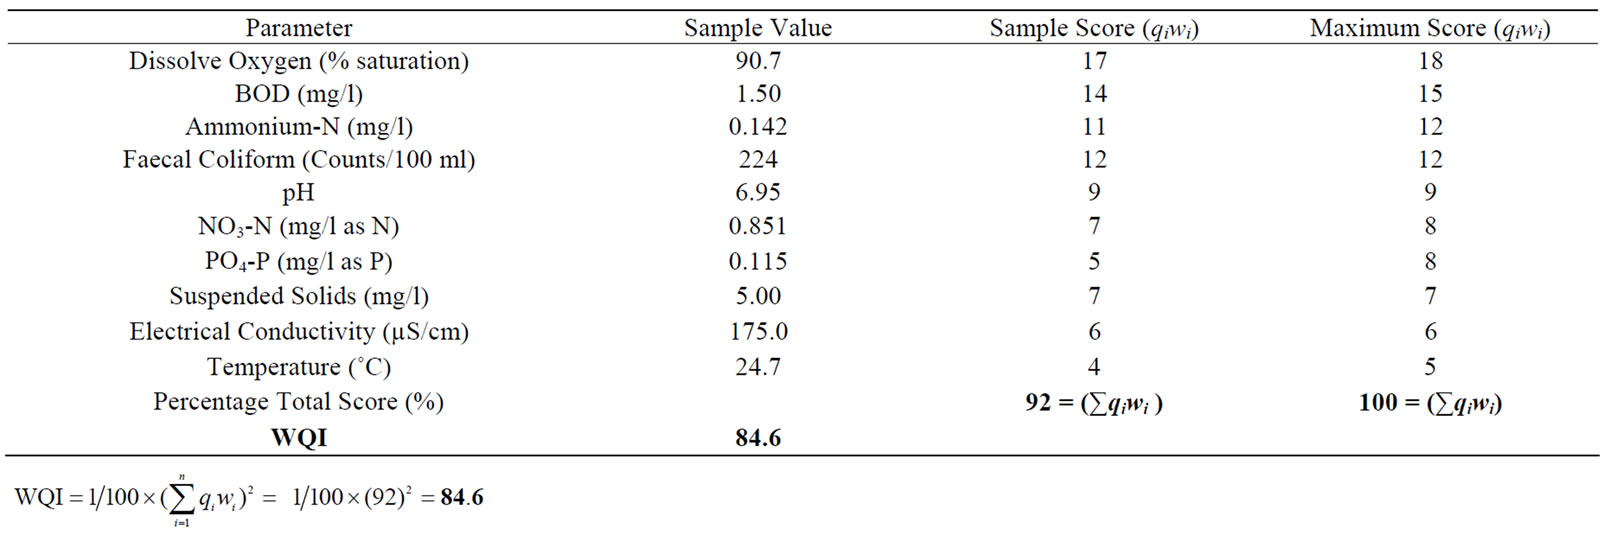
Table 1. A sample calculation of WQI for Potroase (R. Densu) in February 2006.
2.2. The Concept of Water Quality Index in Ghana—The Adapted Water Quality Index (WQI) for Ghana
The concept of Water Quality Index (WQI) to describe the state of water quality in Ghana has not been popular until 2003 when the Water Resources Commission of Ghana (WRC) produced the Adapted Water Quality Index (WQI) document, and proposed the WQI concept for assessing surface water quality in Ghana. The Adapted Water Quality Index (WQI) document started with the pioneering work of Ansa-Asare, [11], who adapted and modified the Solway Water Quality Index for Ghana, now called the Adapted Water Quality Index [12]. The concept of a water quality index for Ghana arose from two needs. The first was the need to share and communicate with the public, in a consistent manner, the technical results from monitoring ambient water. The second was the need to provide a general means of comparing and ranking various bodies of water throughout Ghana [12].
The adapted WQI used in assessing the state of the various basins in Ghana is based on the Solway River Purification Board (RPB) Weighted Water Quality Index developed by Bolton et al. (1978). This is the general water quality indices type in which various physical, chemical and microbiological variables are aggregated to produce an overall index of water quality.
The established WQI is to be used for a variety of purposes, including:
• Communicating water quality information to the public and decision makers.
• Applying it as a planning tool for water resources management.
• Identifying water quality problems for which special studies are needed.
• Evaluating the performance of pollution control programmes [12].
2.3. The Case Study of the Southwestern and Coastal Rivers Systems of Ghana
In 2003 the WRC produced a document, the Ghana Raw Water Quality Guidelines and Criteria—the Adapted Water Quality Index, which adapted the Solway Water Quality Index as an index to characterize the overall raw water quality in Ghana. The Adapted Water Quality Index (WQI) is a classification system that uses an index calculated from selected water quality parameters. The index classifies water quality into one of four categories: good, fairly good, poor, and grossly polluted (Table 2). Each category describes the state of water quality compared to objectives that usually represent the natural state. The index thus indicates the degree to which the natural
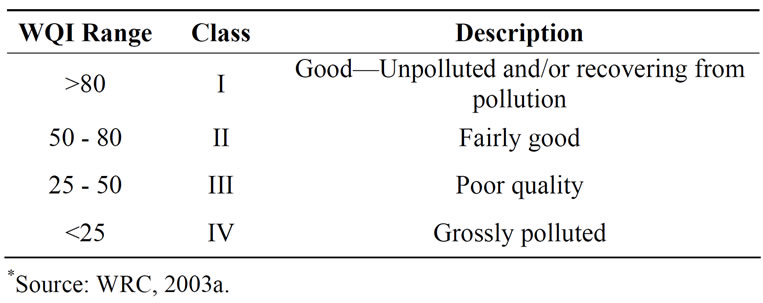
Table 2. WQI criteria for classification of surface waters*.
water quality is affected by human activity [12].
From 2005 to 2008, the CSIR Water Research Institute undertook water quality monitoring and assessment of the Southwestern and the Coastal Rivers Systems of Ghana for the Water Resources Commission of Ghana (WRC) under WRIS II Project, a Danish Government Funded Project. The Southwestern and the Coastal Rivers Systems cover approximately 30% of the total drainage basins of Ghana [13]. Various water quality parameters were measured for the assessment. However, only ten selected key parameters were used for the WQI evaluation.
2.4. Study Areas
The Southwestern Rivers Systems: The Southwestern Rivers Systems is made up of the Bia, Tano, Ankobra, Pra, Birim and Offin River Basins in Ghana (Table 3), and is located approximately between latitudes 5˚N and 7.7˚N and longitudes 0.3˚W and 3.2˚W (Figure 1). Their drainage areas cover about 22% of the country. Major water uses of all the basins are for domestic, industrial, irrigation and fishing purposes. The mean annual rainfall of the entire Southwestern Rivers System ranges from 1137 mm to 2156 mm with two rainfall seasons peaking in May/June and September/October. The Southwestern System falls within the Rain Forest Zone of Ghana with extensive cocoa farms, with a small percentage of forest remaining. The farming practice in the basin is mainly land rotation. There are also forest reserves and large established commercial tree plantations like rubber. Coconut plantations were also abundant in the southern portions towards the coastal areas until the onset of the Cape Saint Paul’s Wilt disease that has rapidly destroyed vast areas of plantations and virtually collapsed the coconut industry [13].
The Coastal Rivers System: The Coastal Rivers System comprises the Densu, Ayensu, Ochi-Amisa, Ochi-Nakwa, Kakum and Odaw River Basins (Table 4). The Coastal Rivers System covers an estimated area of 21,146 km2, with a total annual flow volume of 1491.2 × 106 m3. It covers a large portion of the Central, Eastern and the Greater Accra Regions of Ghana.
Land uses include cultivation of cocoa and fruit crops like oranges, and oil palm in the forested upper areas. Oil palm and rubber plantations can also be found in some
Figure 1. Map of Ghana showing the location of sampling sites in Southwestern and Coastal Rivers Systems.
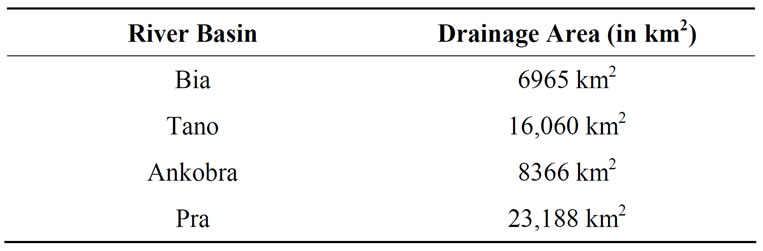
Table 3. River basins and their drainage areas in the Southwestern Rivers Systems.
other areas. Food crops including plantains, cocoyam, maize, cassava, vegetables, and fruit crops like pineapples are also under cultivation in the Coastal Rivers Systems. Coconut plantations occur on the sandy soils on the beaches along the coast. Large numbers of cattle are known to be kept on the coastal plains [13].
2.5. Sampling Strategy
Surface water samples were collected from 19 selected locations (16 river stations and 3 reservoir stations) in the basins for 4 years (March 2005 to November 2008) on bi-monthly intervals. Samples were collected in the months of February, May, July, September and November each year except 2005 when the first sample was taken in
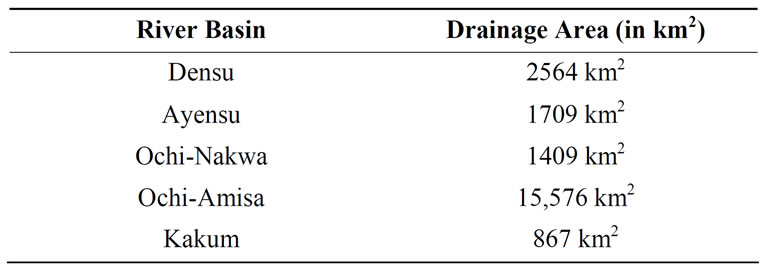
Table 4. River basins and their drainage areas in the Coastal Rivers Systems.
March. Samples for physico-chemical parameters were collected into 1 L clean plastic bottles. Samples for bacteriological analyses were collected into sterilized glass bottles. The samples for physico-chemical parameters and the bacteriological samples were preserved in ice before transporting to the Laboratory for analyses. Temperature, pH and transparency were measured in situ in the field using a calibrated digital thermometer and a calibrated pH meter (Model CG 8180) respectively. Transparency was measured by the Secchi Disc Method.
Dissolved Oxygen (DO) determinations were by Winkler’s Method. Samples for biochemical oxygen demand (BOD5) determinations were incubated at 20˚C in an incubator for 5 days before the remaining DO determined by Winkler’s Method.
The Southwestern stations sampled were Dadieso (R. Bia), Sefwi-Wiawso (R. Tano), Prestea (R. Ankobra), Dominase (R. Ankobra), Ewusijo (R. Butre), Daboase (R. Pra), Brenase (R. Pra), Akim Oda (R. Birim), Dunkwa (R. Offin), Brimso (Brimso Reservoir on R. Kakum) and Kumasi (Barekese Reservoir on R. Offin).
The Coastal stations sampled were Mankesim (R. Ochi-Amisa), Ekumfi Ekotsi (R. Ochi-Nakwa), Makrong Junction (R. Ayensu), Potroase (R. Densu), Mangoase (R. Densu), Nsawam (R. Densu), and the Weija Reservoir (on R. Densu).
Apart from Potroase which was the upstream of River Densu, most of the stations were located downstream, and mid-stream of the rivers. These locations were selected due to easy accessibility.
All field and laboratory determinations were performed according to the Standard Methods for the Examination of Water and Wastewater [14].
3. Results and Discussion
The water quality for the Southwestern and the Coastal Rivers Systems has been assessed with the Adapted Water Quality Index (WQI). Datasets from the monitoring programme carried out from 2005 to 2008 were used to assess water quality. A total of ten parameters were used to determine the Water Quality Index (WQI) for the river basins: Dissolved Oxygen (DO % Saturation), Biochemical Oxygen Demand (BOD), Ammonium Nitrogen (NH4-N), Faecal Coliform (FC), pH, Nitrate as Nitrogen (NO3-N), Phosphate as Phosphorus (PO4-P), Total Suspended Solids (TSS), Conductivity and Temperature.
The conventional way to obtain a WQI is to compute the weighted average of some predefined parameters, normalized in a scale from 0 to 100 and multiplied by their respective weights [4]. The Adapted Water Quality Index (WQI) is calculated from the following equation:

where, qi = water quality score of parameter i; wi = weighting factor of parameter i and n = number of parameters.
The pH of the waters during the study period ranged from 5.51 to 8.96 and was well within the acceptable range of 6 to 9 for raw water, recommended by the Water Resources Commission of Ghana [15]. Temperatures during the period ranged from 20.4 to 31.7, while NH4-N ranged from 0 to 2.75 mg/l. Faecal coliform counts ranged from 0 to 3506 cfu/100 ml, PO4-P ranged from 0.001 to 2.81 mg/l, NO3-N ranged from 0.001 to 10.9 mg/l, TSS from 1.00 to 260 mg/l, conductivity from 54.3 to 947 µS/ cm, DO from 0.200 to 10.6 mg/l, and BOD from 0.400 to 12.4 mg/l. Table 5 shows the maximum and minimum values of the selected parameters for the WQI calculation during the study period 2005-2008.
In the Ghana Raw Water Quality Criteria and Guidelines, the range of concentrations at which the presence of a particular water quality constituent would have no known or anticipated adverse effects on the fitness of water for a particular use, or on the protection and maintenance of the health of aquatic ecosystems is referred to as the Target Water Quality Range (TWQR) [15]. The TWQR of the 10 parameters in the waters were acceptable except, BOD, TSS, FC and conductivity. The TWQR for conductivity is 0 - 70 µS/cm [15]. Conductivity in most of the waters exceeded 70 µS/cm. However, most of the waters had conductivities below 200 µS/cm during the period. Waters with the highest conductivity during the period were observed in the Densu Basin, with the highest value of 947 in Nsawam occurring in September 2005. Conductivities in all waters in the Densu Basin were far above 200 µS/cm consistently, except Potroase whose waters exceeded 200 µS/cm only in 2005 and not in the other years. Potroase had the best water quality during the period and Nsawam the least water quality in the Densu Basin. A few other stations that also had conductivities exceeding 200 µS/cm only during certain months were Makrong Junction, Daboase, Dunkwa-On-Offin, Ekumfi Ekotsi and Sefwi-Wiawso.
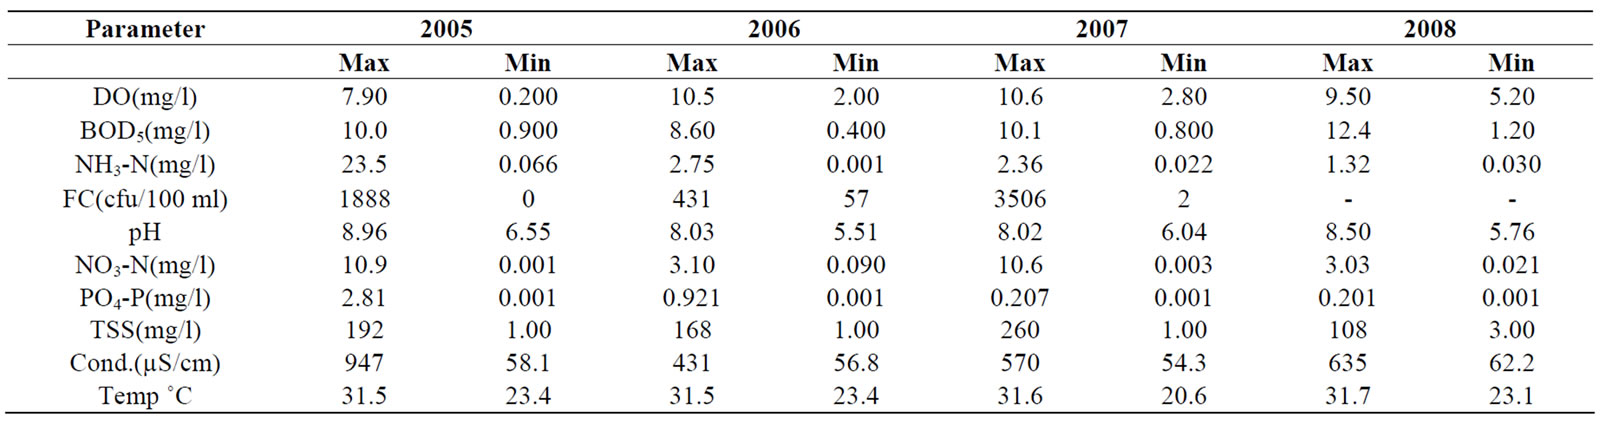
Table 5. Maximum and minimum values of the selected parameters for the period 2005-2008.
Dissolved Oxygen (DO) is essential to all forms of aquatic life. DO concentrations below 5 mg/l may adversely affect the functioning and survival of biological communities and below 2 mg/l may lead to the death of most fish [18]. The Ghana Raw Water Criteria and Guidelines [16], has set the TWQR of DO for waters of aquaculture use to be 5.0 - 8.0 mg/l as the optimal concentration range for growth. During the 4-year study, only 6.6% of DO concentrations in a dataset of 378 were below 5 mg/l. This indicates that the waters were well oxygenated and will support fish survival.
Biological oxygen demand (BOD) is a measure of the organic material, both natural (for example, decaying plant and animal material) or human (petroleum products and organic chemicals). It can react with chlorine in water treatment plants to form harmful disinfectant by-products in drinking water [17]. BOD in the Southwestern and Coastal Rivers basins is dominated by naturally occurring organic material. The TWQR of BOD is 0 to 2 mg/l. During the study period, out of a dataset of 378, only 4.8% of values were below 2 mg/l, indicating high organic matter pollution in the waters. Thus the overall BOD in the waters was unacceptable.
Just like DO, the pH of water is also important for survival of aquatic organisms. Fishes live the best in waters with a pH between 6.5 and 8.4. Fish are harmed if pH becomes too acidic (falls below 4.8) or too alkaline (goes above 9.2) [17]. The pH of the waters during the study period ranged from 5.51 to 8.96 and was thus acceptable.
Total Suspended Solids (TSS) was generally high in all the waters. Very high TSS values were observed in places like, Daboase, Akim-Oda, Dunkwa-on-Offin, where illegal mining activities were prevalent. Faecal coliform (FC) counts were also very high in the waters.
3.1. Seasonal and Annual Trends in WQI
The WQI of the rivers were calculated on seasonal basis and on annual basis to obtain both seasonal and annual trends. Seasonal WQIs were calculated from data for each of the 5 months sampled in the year (Figure 2). The arithmetic mean of the seasonal WQIs of the 5 months for each year was then calculated to obtain the annual mean WQI (Figure 3). The one-way ANOVA was used to test for the spatial and temporal (seasonal) trends in water quality.
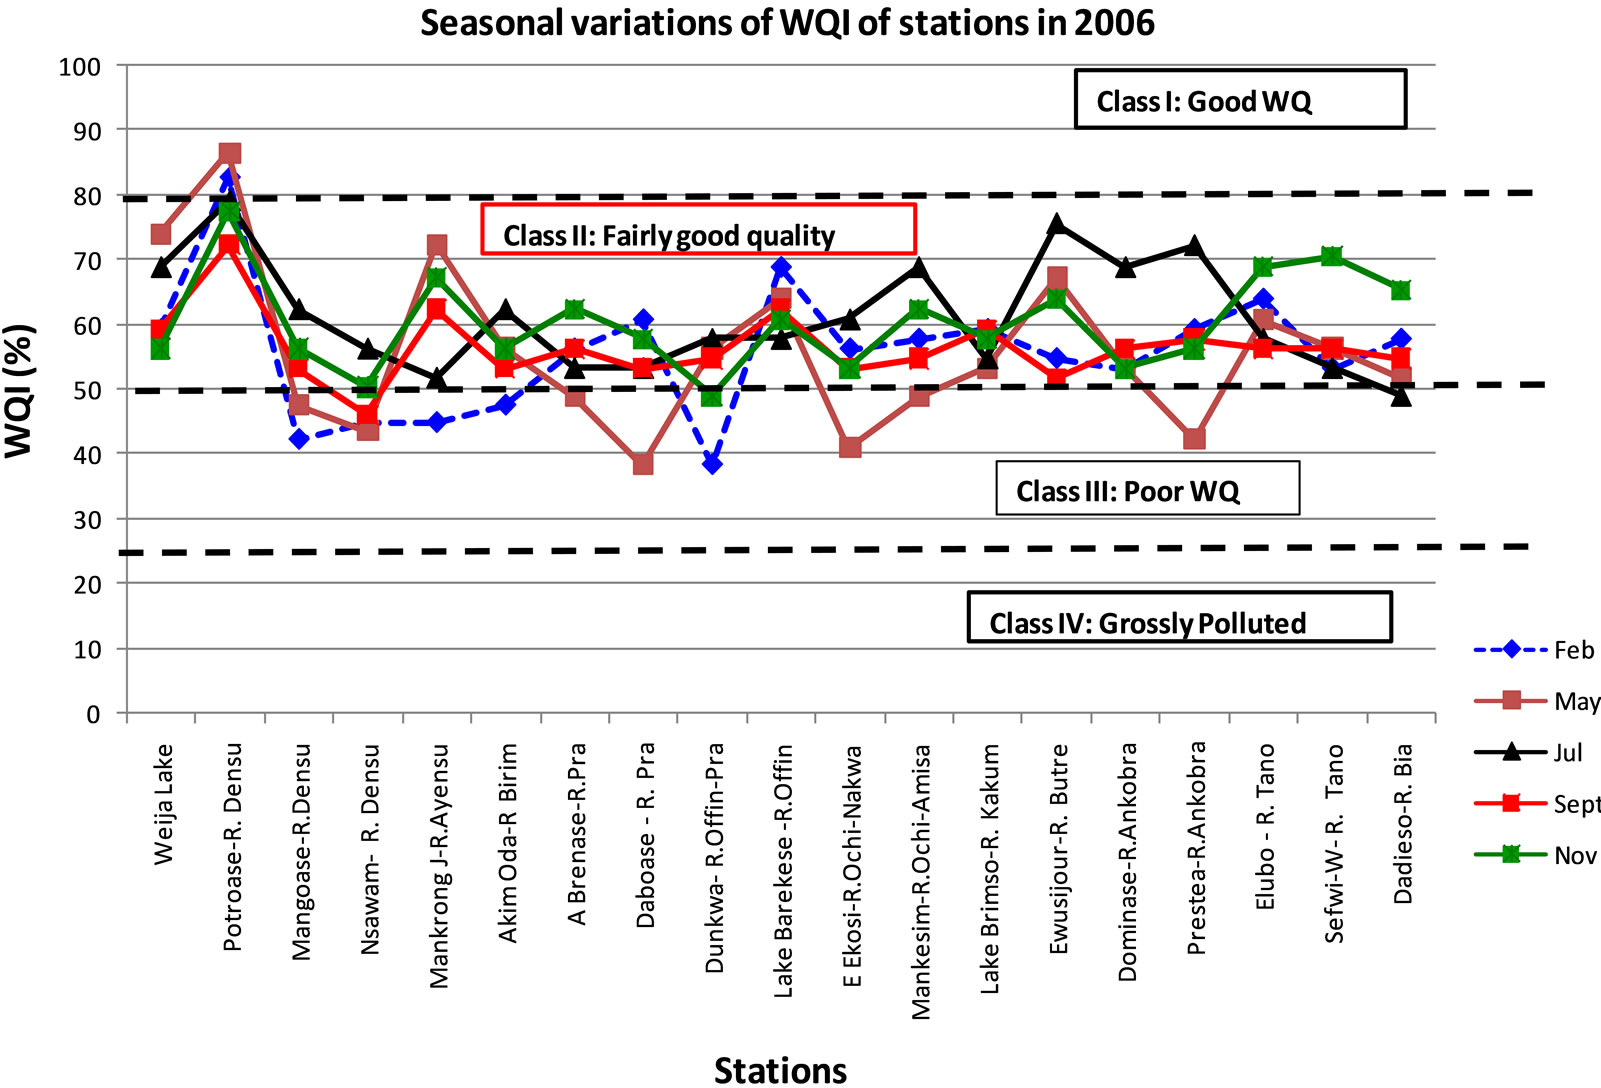
Figure 2. Seasonal variations of water quality index in 2006 depicting water quality levels. Similar patterns were obtained for 2005, 2007 and 2008.
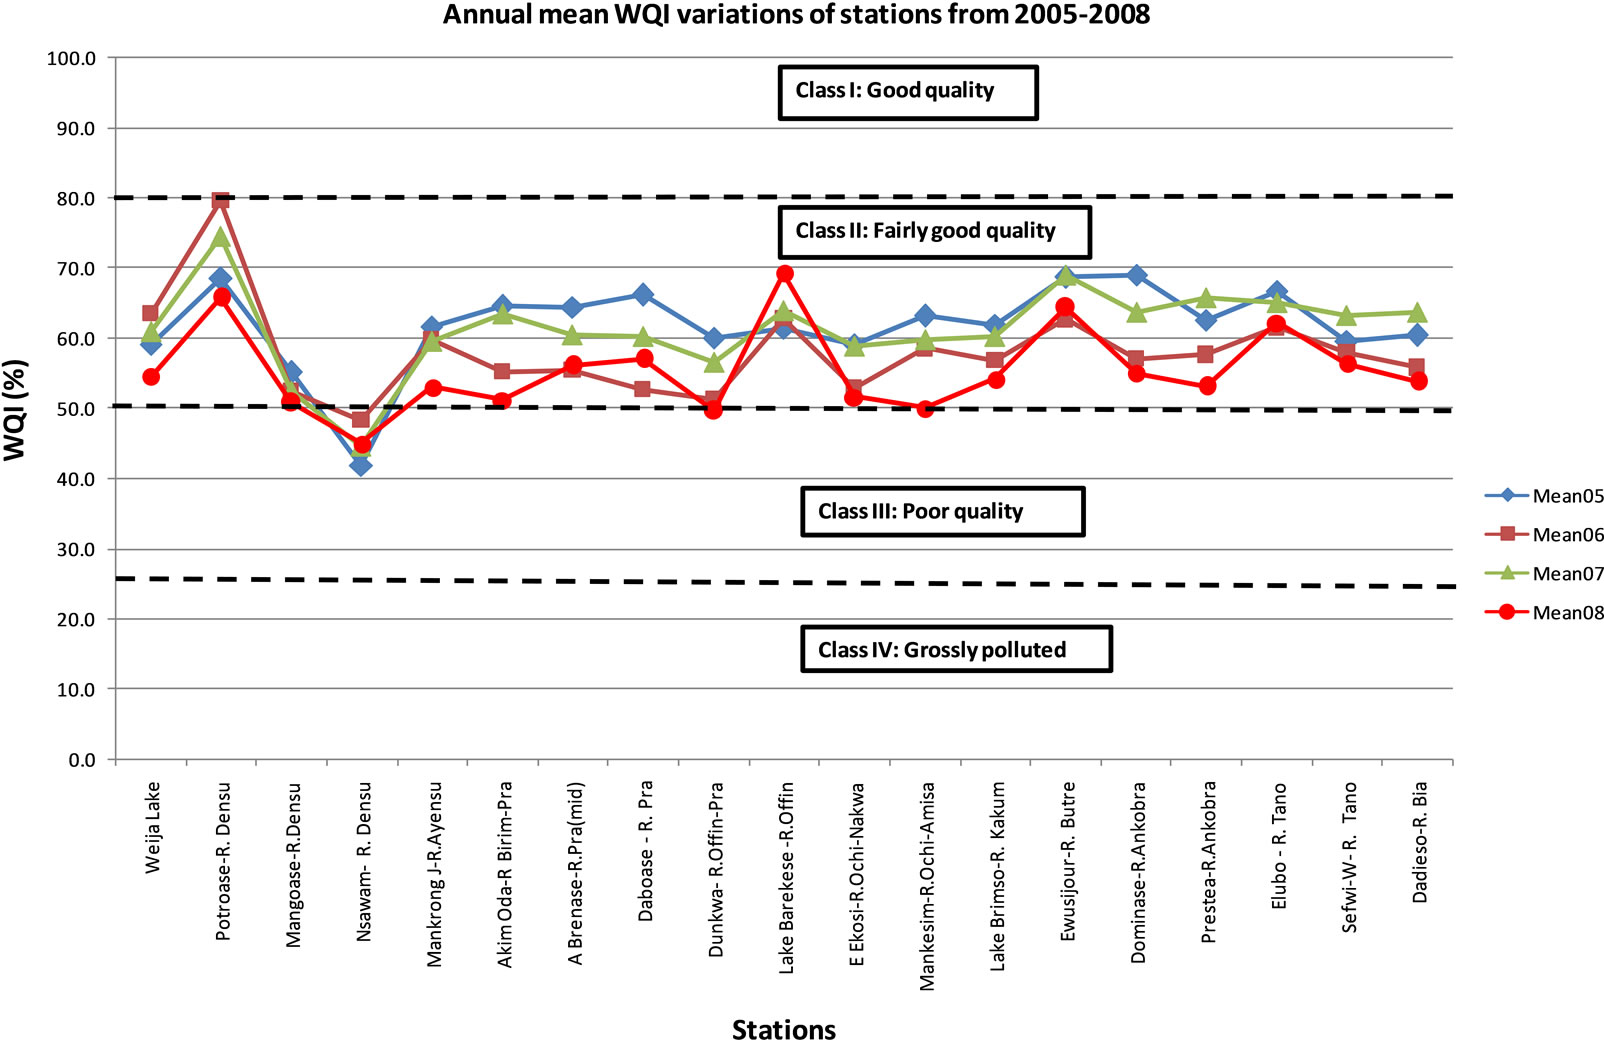
Figure 3. Annual mean WQIs of the basins depicting water quality levels. Most of the WQI values fell between 50 and 80, the Class II state.
Annual trends in WQI: There were no apparent annual trends in WQI in stations except Lake Barekese that showed consistent annual increases in WQI from 2005 to 2008. The WQI in the stations were erratic from one year to another, but mostly remained in Class II, Generally, 2005 recorded high WQI in the basins followed by 2007, 2006 and 2008. The percentage dataset that had WQI less than 50, in 2005 was 7.5%, in 2006 it was 15.8%, in 2007 it was 8.4%, while in 2008 it was 28%. The highest annual water quality was observed at Potroase in the Densu basin which was the only station that had an annual WQI of ~80.0 (79.6) in 2006 during the study period.
Potroase which had the highest water quality during the study period had the following trends in water quality. The annual mean WQI increased from 2005 to 2006, then decreased in 2007, and a further decrease in 2008 (Figures 3 and 4). The observed trend can be attributed in part to disturbance of the river bed due to lumbering activities in the area a year after the programme started. In 2006, a year after the programme started, timber exploration started in the area and heavy vehicles carrying timber were driven through and across the shallow river continually. This turned the waters mucky and led to high
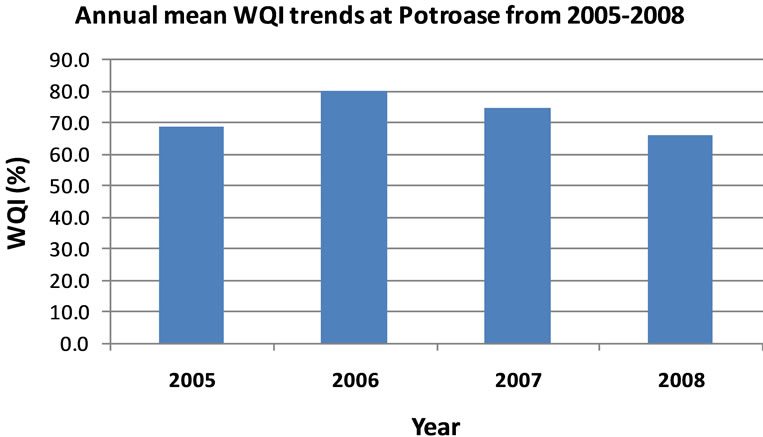
Figure 4. Yearly water quality variations at Potroase from 2005 to 2008.
Total Suspended Solids (TSS) in the waters. Since TSS is a quality determinant in the WQI calculation, a high TSS in the waters implied a lower WQI.
Other stations that had relatively high annual qualities in water were River Butre at Ewusijo, Lake Barekese in Kumasi, Lake Brimso in Cape Coast, River Ochi-Amisa at Mankesim, River Tano at Elubo and River Tano at Sefwi-Wiawso. The poorest water quality was observed at Nsawam followed by Mangoase and Dunkwa-on-Offin respectively.
The difference between annual mean values of WQI at stations was statistically significant at the 95% level (ANOVA, p < 0.010). This can be explained by the annual rainfall patterns (at the stations and/or basins). Years with high rainfall will cause high surface runoffs into the waters implying high TSS into the waters, and vice versa for years with lower rainfall. The one-way ANOVA also indicated that the difference between annual mean values of WQI between stations was statistically significant at the 95% level (ANOVA, p < 0.001). Rainfall variations within basins accounted for the differences observed in WQI (quality) at the different stations as a result of high surface runoffs occurring in some basins than others. Intensity of human activities within basins is also responsible for the differences observed in quality at the different stations, e.g. where illegal mining activities are prevalent, the waters become loaded with high suspend matter (TSS) which lowers the quality of the waters, and therefore WQI.
Seasonal trends in WQI: In the first year of sampling (2005), Lake Barekese was not sampled in March and May, and therefore it has no WQI for these 2 months. In 2005, three stations (River Ochi-Amisa at Mankesim, Lake Brimso at Cape Coast, River Butre at Ewusijo) had WQI > 80 in the month of September, and Potroase recorded 79.1 in September of same year. Nsawam recorded WQI of 23.0 in September 2005 (Class IV), indicating how grossly polluted that stretch of the River Densu was. In 2006 Potroase recorded 84.6 and 90.3 in the months of February and May respectively, with an annual mean WQI of 79.6. In 2007 two stations had WQI >80, Potroase recorded 94.1 in May and Ewusijo recorded 81.0 in July. In 2008, only Lake Barekese recorded 80.2 each, in July and September respectively.
The difference between seasonal (monthly) values of WQI (at stations) was statistically significant at the 95% level both in 2005 and 2007 (ANOVA, p < 0.001, for each year), but no significant differences were observed between seasons (months) in 2006 and 2008 (ANOVA, p > 0.05, for each year). The one-way ANOVA indicated that the difference between seasonal values of WQI between stations was statistically significant at the 95% level from 2005 to 2008 (2005: ANOVA, p < 0.05; 2006: ANOVA, p < 0.001; 2007: ANOVA, p < 0.05; 2008: ANOVA, p < 0.001). Seasonal variations in rainfall may have accounted for differences in WQI observed in seasons at stations.
3.2. Evaluation of the Water Quality for the River Basins with the Use of the Annual WQI
The annual mean WQI, obtained by the arithmetic mean of the seasonal WQIs of the 5 months for each year were used to evaluate the water quality of the River Basins. Figure 3 shows the graphical presentation of the annual WQIs of the waters and their quality designations.
In 2005 Nsawam was of Class III (poor quality) but the remaining stations were all of Class II (fairly good waters). In 2006 Nsawam (in Densu Basin) remained in Class III, while all other stations were of Class II. Potroase (in Densu Basin) was in Class II but had the highest water quality with a WQI of 79.6. Apart from Mangoase in Densu Basin whose waters deteriorated in 2006, the other stations in the Densu Basin showed marked improvement in water quality in 2006 over 2005. However, there was a reduction in water quality in all the stations in the other river basins in 2006, except Lake Barekese that had an improvement over 2005. In 2007, Nsawam was of Class III, but all the other stations fell in Class II. Potroase in the Densu Basin, although was in Class II, had the highest quality, with a WQI of 74.5 in 2007. Weija Reservoir, Potroase and Nsawam in the Densu Basin had lower water qualities in 2007 than in 2006. Mangoase in the Densu Basin and Mankrong Junction in the Ayensu Basin, in 2007, maintained the same water quality as in 2006. All the remaining stations in 2007 showed improvement in water quality over 2006. Finally, in 2008, Nsawam was of Class III, but practically maintained the same water quality as in 2007. All the remaining stations were of Class II but showed lower water quality than in 2007, except Lake Barekese which showed an increase in water quality in 2008 over 2007. Dunkwa-On-Offin in 2008 had a WQI just below 50 (i.e. 49.7) and was nominally of Class III, but practically was in Class II. It was observed that Nsawam was the only station that consistently fell in class III for all the four year period. This indicates the polluted nature of that stretch of the River Densu at Nsawm. Lake Barekese was the only station that showed a progressive increase in water quality from 2005 to 2008, although was of Class II.
The WQI has proved to be a good tool for assessing the quality of our rivers globally. The application of a water quality index to the Southwestern and Coastal Rivers Systems of Ghana allowed a water quality classification both spatially and temporally within the river basins by means of uniform, objective criteria, and can be applied in other river basins in Ghana. This approach can allow the identification of stretches of a river that may require urgent measures in order to restore minimal water quality for uses other than water supply.
High faecal coliform counts, high TSS, high BOD and high conductivity were the major parameters responsible for the low WQI scores in the waters.
4. Conclusions
Water quality indices are developed as a tool to summarize and report on the monitoring data to decision makers to be able to understand the status of the water quality in a water source for effective management. Indices can also overcome communication problems between scientists and water managers or policy makers. The use of the WQI allows for the monitoring of water quality changes with time and location. A 4-year study from 2005 to 2008 of surface waters in the Southwestern and Coastal Rivers Systems of Ghana revealed that the annual water quality decreased in the order: 2005>2007>2006>2008. It was found that the WQI was very useful for the classification of the waters monitored. According to the WQI classification of waters, most Ghanaian waters currently are practically in the Class II state, or are of the fairly good water quality category. Potroase in the Densu Basin (on River Densu) recorded the highest water quality during the study period. Thus this stretch of the river can support sensitive aquatic species. Nsawam in the Densu Basin had the poorest water quality mainly due to pressure from human settlements, and was consistently in the Class III state or the poor water quality category during the study period. It was found that differences in water quality existed between seasons (months) and stations.
Maintaining the aquatic ecosystem health is vital for the sustainability of aquatic biodiversity which will ultimately support human life and economic activities. Efforts should be made to prevent further degradation of the water quality in the basins in order to retain their current status or revert them to Class I state. This can be done through public education of communities living around the water bodies, especially by District Assemblies.
5. Recommendations
It is suggested that the current 4 Classes of the Adapted Water Quality Index be fine tuned (because of very sensitive species) into 5 Classes thus: 91 - 100 (Class I or Excellent water quality); 71 - 90 (Class II or Good water quality); 51 - 70 (Class III or Fairly good water quality); 26 - 50 (Class IV or Poor water quality); 0 - 25 (Class V or Grossly polluted water quality). This is because the class interval of 50 - 80 seems rather too wide and may mask some undesirable water quality status or pollution status.
Colour codes could also be applied to the current 4 classes of water quality classifications to describe the quality status, e.g. Green for Class I, (or good quality), Blue for Class II (or fairly good quality), Yellow for Class III (or poor quality), and Red for Class IV (or grossly polluted water).
6. Acknowledgements
The authors wish to acknowledge the Danish government and the Danida Project who provided the entire funds to undertake the programme. We are also grateful to the CSIR Water Research Institute whose laboratory facilities were used for all the analyses that were carried out. We also want to thank the WRC of Ghana for the profound co-operation throughout the entire Project. We are also grateful to Mr. Samson Abu, a Senior Technical Officer of the CSIR-WRI, and Mr. Joseph Danso, a Driver of the CSIR-WRI for their hard work and assistance.
REFERENCES
- A. A. Bordalo, W. Nilsumranchit and K. Chalermwat, “Water Quality and Uses of the Bangpakong River (Eastern Thailand),” Water Resources, Vol. 35, No. 15, 2001, pp. 3635-3642. http://dx.doi.org/10.1016/S0043-1354(01)00079-3
- S.-M. Liou, S.-L. Lo and S.-H. Wang, “A Generalized Water Quality Index for Taiwan,” Environmental Monitoring and Assessment, Vol. 96, No. 1-3, 2004, pp. 35-52. http://dx.doi.org/10.1023/B:EMAS.0000031715.83752.a1
- S. Ramesh, N. Sukumaran, A. G. Murugesan and M. P. Rajan, “An Innovative Approach of Drinking Water Quality Index—A Case Study from Southern Tamil Nadu, India,” Ecological Indicators, Vol. 10, No. 4, 2010, pp. 857-868. http://dx.doi.org/10.1016/j.ecolind.2010.01.007
- A. Lermontov, L. Yokoyama, M. Lermontov and M. A. S. Machado, “River Quality Analysis Using Fuzzy Water Quality Index: Ribeira do Iguape River Watershed, Brazil,” Ecological Indicators, Vol. 9, No. 6, 2009, pp. 1188- 1197. http://dx.doi.org/10.1016/j.ecolind.2009.02.006
- M. Saeedi, O. Abessi, F. Sharifi and H. Meraji, “Development of Groundwater Quality Index,” Environmental Monitoring and Assessment, Vol. 163, No. 1-4, 2010, pp. 327-335. http://dx.doi.org/10.1007/s10661-009-0837-5
- National Sanitation Foundation International, 2007, In: A. Lermontov, L. Yokoyama, M. Lermontov and M. A. S. Machado, “River Quality Analysis Using Fuzzy Water Quality Index: Ribeira Do Iguape River Watershed, Brazil,” Ecological Indicators, Vol. 9, No. 6, 2009, pp. 1188- 1197.
- Canadian Council of Ministers of the Environment, 2012. http://www.ccme.ca/initiatives/waterfaqs.html
- S. G. Nives, “Water Quality Evaluation by Index in Dalmatia,” Water Resources, Vol. 33, No. 16, 1999, pp. 3423-3440. http://dx.doi.org/10.1016/S0043-1354(99)00063-9
- M. Terrado, E. Borrell, S. de Campos, S. Barcelo D. and R. Tauler, “Surface-Water-Quality Indices for the Analysis of Data Generated by Automated Sampling Networks,” Trends in Analytical Chemistry, Vol. 29, No. 1, 2010, pp. 40-52. http://dx.doi.org/10.1016/j.trac.2009.10.001
- E. Sanchez, M. F. Colmenarejo, J. Vicente, A. Rubio, M. G. Garcia, L. Travieso and L. Borja, “Use of the Water Quality Index and Dissolved Oxygen Deficit as Simple Indicators of Watersheds Pollution,” Ecological Indicators, Vol. 7, No. 2, 2007, pp. 315-328. http://dx.doi.org/10.1016/j.ecolind.2006.02.005
- O. D. Ansa-Asare, “Do Diurnal Dissolved Oxygen Cycles Have Diagnostic Value for Assessing Pollution Status in Lakes?” PhD Thesis, Department of Chemistry, University of Aberdeen, Scotland, 1998.
- “Ghana Raw Water Quality Criteria and Guidelines, Adapted Weighted Raw Water Quality Index Application to Ghanaian River Systems,” Water Resources Commission, Accra, 2003.
- “Water Resources Management Study—Information Building Blocks Study,” Final Report, Ministry of Works and Housing, Accra, 1998.
- American Public Health Association (APHA), “Standard Methods for the Examination of Water and Wastewater,” 20th Edition, American Public Health Association (APHA), Washington DC, 1998.
- “Ghana Raw Water Quality Criteria and Guidelines, Volume 1, Domestic Water-Use,” Water Resources Commission, Accra, 2003.
- “Ghana Raw Water Quality Criteria and Guidelines, Volume 5, Aquaculture Water-Use,” Water Resources Commission, Accra, 2003.
- B. V. Raman, B. Reinier and S. Mohan, “Fuzzy Logic Water Quality Index and Importance of Water Quality Parameters,” Air, Soil and Water Research, Vol. 2, 2009, pp. 51-59.
- D. Chapman, “Water Quality Assessments: A Guide to the Use of Biota, Sediments and Water in Environmental Monitoring,” 2nd Edition, Cambridge University Press, Cambridge, 1996.
NOTES
*Corresponding author.