Energy and Power Engineering
Vol.4 No.6(2012), Article ID:25089,10 pages DOI:10.4236/epe.2012.46066
Online Diagnosis and Monitoring for Power Distribution System
Electrical Engineering Department, Tafila Technical University, Tafila, Jordan
Email: dr.atef_almashakbeh@yahoo.com
Received October 16, 2012; revised November 14, 2012; accepted November 26, 2012
Keywords: Fault Detection and Classification; Protective Relaying; PCA; PSCAD
ABSTRACT
Recently, power distribution system is getting larger and more complex. It is very difficult even for the experts to diagnosis and monitoring to made best action. This motivated many researchers to investigate power systems in an effort to improve reliability by focusing on fault detection and classification. There have been many studies on problems but the results are not good enough for applying to real power system. In this paper, a new protective relaying framework to diagnosis and monitoring faults in an electrical power distribution system with. This work will extract fault signatures by using ellipse fit using least squares criterion during fault condition. By utilizing principal component analysis methods, this system will identify, classify and localize any fault instantaneously.
1. Introduction
Fault detection is a focal point in the research of power systems area since the establishment of electricity transmission and distribution systems. The objectives of a power system fault analysis is to provide enough information to understand the reasons that lead to an interruption and to, as soon as possible, restore the handover of power, and perhaps minimize future occurrences if possible at all [1]. Several techniques are adopted for pattern recognition of generating the high frequency signals Artificial Neural Network (ANN) and Wavelets among other powerful pattern recognition and classification tools. ANN based algorithms depend on indentifying the different patterns of system variables using impedance information ANN is that the resolution is not efficient since it can be a very sparse network with the need for large size training data adding an additional burden on its computational complexity [2-4]. Wavelet transform is adopted to discriminate the faults type from the magnetizing inrush current [5]. Others incorporated wavelet transform with other methods such as Probabilistic Neural Network (PNN), adaptive resonance theory, adaptive neural fuzzy inference system, and support vector machines [6-10]. Fuzzy logic was also combined with discrete Fourier transform, adaptive resonance theory, principles of estimation and independent component analysis to enhance performance [9]. Unfortunately, most of the available tools for fault detection and classification are not efficient and are not investigated for real time implementation there is a need for new algorithms that have high efficiency suitable for real time usage especially for power distribution system.
2. Fault Ellipse Signature
Least squares fitting of voltage and current ellipses. During healthy condition for power distribution system for each voltage and current data during one cycle the pure ellipse we can generated in this research we using least squares criterion to define the ellipse parameter. We will try to fit the best ellipse to the given measurements from the voltage and current signal during one cycle. The mathematical representation of use will be the CONIC Equation of the Ellipse which is:
Ellipse = a*x^2 + b*x*y + c*y^2 + d*x + e*y + f = 0 Also during the fault condition we using the same method to fit ellipse parameters, the fit method using least squares criterion is very reliable method to restore the voltage and current data during fault condition to ellipse as shown in Figure 1 the fitting ellipse for prefault condition during fault single phase to ground (AG). In the first row the fitting ellipse for phase a, b and c respectively in healthily condition and in second row the we note the first fitted ellipse for phase a will be different than fitted ellipse for phase a in first row but the no difference between phase a and b so in this way we can easily visual detect and classify the fault type.
Principal Component Analysis (PCA) based Fault Detection, Classification and Localization Method. PCA has
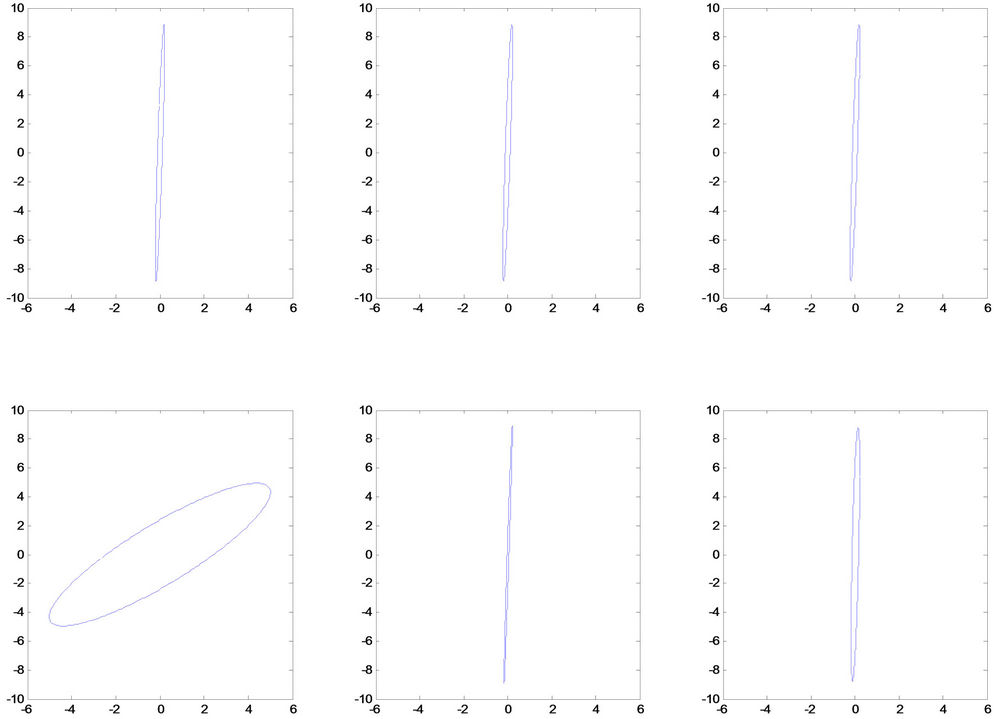
Figure 1. The fitting ellipse for prefault condition during fault single phase to ground (AG).
proven to achieve excellent results in feature extraction and data reduction in large datasets [9]. Typically PCA is utilized is to reduce the dimensionality of a dataset in which there is a large number of interrelated variables while the current variation in the dataset is maintained as much as possible [9]. The principal components (PCs) are calculated using the covariance matrix after a simple normalization procedure. After ellipse fitting we apply the PCA using following steps:
Step 1: Get data from fitting ellipse;
Step 2: Subtract the mean;
Step 3: Calculate the covariance matrix;
Step 4: Calculate the eigenvectors and eigenvalues of the covariance Matrix;
Step 5: Choosing components and forming a feature vector.
In fact, it turns out that the eigenvector with the highest eigenvalue is the principle component of the data in Figure 2 after applying PCA in fitted ellipse during fault condition the eigenvector with the larges eigenvalue was the one that pointed down the middle of the data. It is the most significant relationship between the data dimensions.
We note the angle of principal component will be a unique and distinguished as shown in Figure 3.
The classification process of a fault is divided into two stages; the first is the prefault procedure using all signatures generated prior to testing, to enforce their projections onto the principal components space calculated the principle component healthy angle (PCHA). The second stages is the testing process during fault condition, are followed to project the test pattern onto PCA space followed by measuring of the Principle component fault angle (PCFA). This minimum distance will identify a match of a pattern to a fault or no fault at all. This method uses only current and voltage signals measured by relay agents at each bus of the network sections to identify the type of fault if it is a three lines to ground (3LG), single line to ground (LG), double line to ground (DLG) or a line to line (LL) fault. It also determines the phases included in fault and the bus or line at which the fault occurred.
An analysis of all possible types of fault in three phase system, i.e. LG faults (AG, BG, CG), LL faults (AB, BC, CA), DLG faults (ABG, BCG, CAG) and 3LG faults (ABCG), is carried out. In this paper, the proposed algo
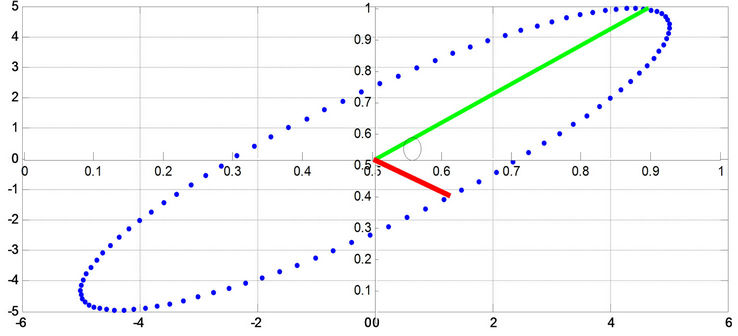
Figure 2. Fault ellipse signature.

Figure 3. Fault ellipse signature.
rithm determines the type of fault first, and finally it determines the fault location.
To identify the fault type we note the PCFA with less than comparing with PCHA for example if we have Fault AG we note PCFA for phase a less than PCHA for phase a and PCFA for phase b and c are the same as PCHA for phase b and c, also for fault ACG the PCFA for phase a and c less than PCHA for phase a and c but PCFA for phase b is the same of PCHA for phase b, also for low impedance fault the difference between PCFA and PCHA is very high and will increased gradually at faulted buses then will be increased after faulted buses but in high impedance fault the difference between PCFA and PCHA is not high and will increased gradually for small change at faulted buses then PCFA will equal PCHA after faulted buses.
3. Experimental Results and Case Study
The radial network consists of 8 km length of 11 kV feeder as shown in Figure 4.
We need to verify that the proposed distribution system simulation model can operate in different modes and to analyze its performance and operational scenarios.
3.1. Fault Analysis
Case 1: Symmetrical fault In this case a 3-phase symmetrical fault is applied on the bus 5. The fault occurs at t = 5 sec. and remains for 5 cycles in the system. The fault resistance is 0.1 ohm the bus voltage and fault current are shown in Figure 5.
Case 2: Single phase to ground The bus voltage and fault current without renewable are shown in Figure 6.
Case 3: 2 phase to ground The bus voltage and fault current without renewable are shown in Figure 7.
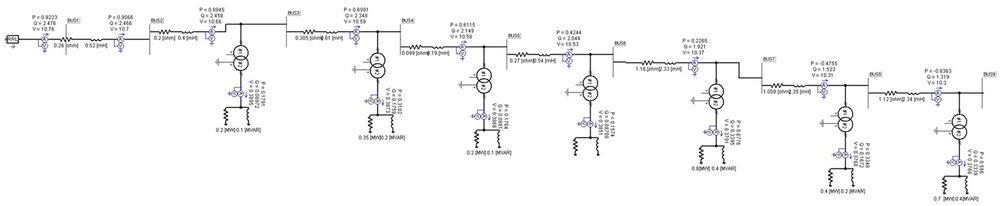
Figure 4. The radial network consists of 8 km length of 11 kV feeder.
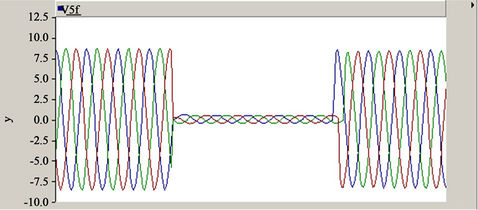
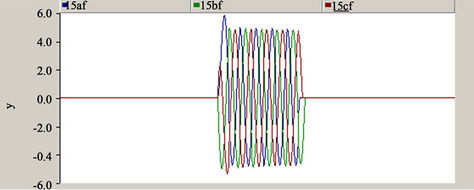
Figure 5. Symmetrical fault.
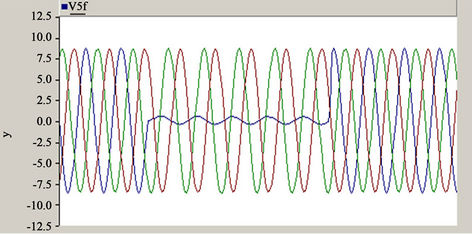
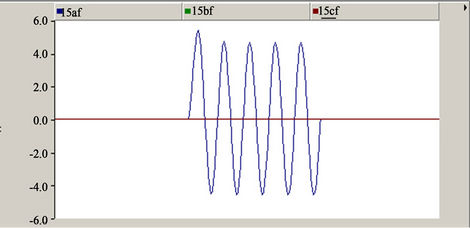
Figure 6. Single phase to ground fault.
3.2. Diagnosis and Monitoring
The first stage is using fitted ellipse generated for all phases from the prefault condition also fitted ellipse generated during fault condition as shown in the following
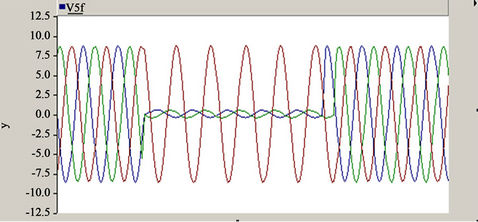
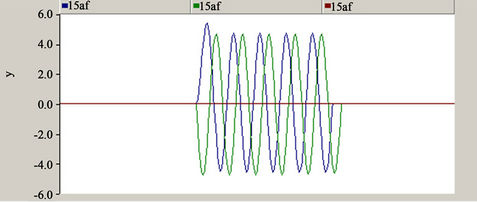
Figure 7. Double phase to ground fault.
Figures 8 and 9 for AG, ABG and ABCG.
After applying fault detection, classification and localization algorithm using PCA, for AG fault at bus 4 we note in the second stage after apply the PCA to identify the principal component fault angle, in Table 1 shown the result for Fault AG at bus 4 the PCFA for phase a less than PCHA for phase a and PCFA for phase b and c are the same as PCHA for phase b and c so it is easily to detect the type of fault also at low impedance fault the difference between PCFA and PCHA is very high and will increased gradually at faulted buses then will be increased after faulted buses but in high impedance fault the difference between PCFA and PCHA is not high and will increased gradually for small change at faulted buses then PCFA will equal PCHA after faulted buses also the location of the fault we can note easily as shown in Figures 10 and 11.
In Table 2 shown the result for Fault ABCG at bus 4 the PCFA for phase a, b and c less than PCHA for phase a, b and c, so it is easily to detect the type of fault also at low impedance fault the difference between PCFA and PCHA is very high and will increased gradually at faulted buses then will be increased after faulted buses but in high impedance fault the difference between
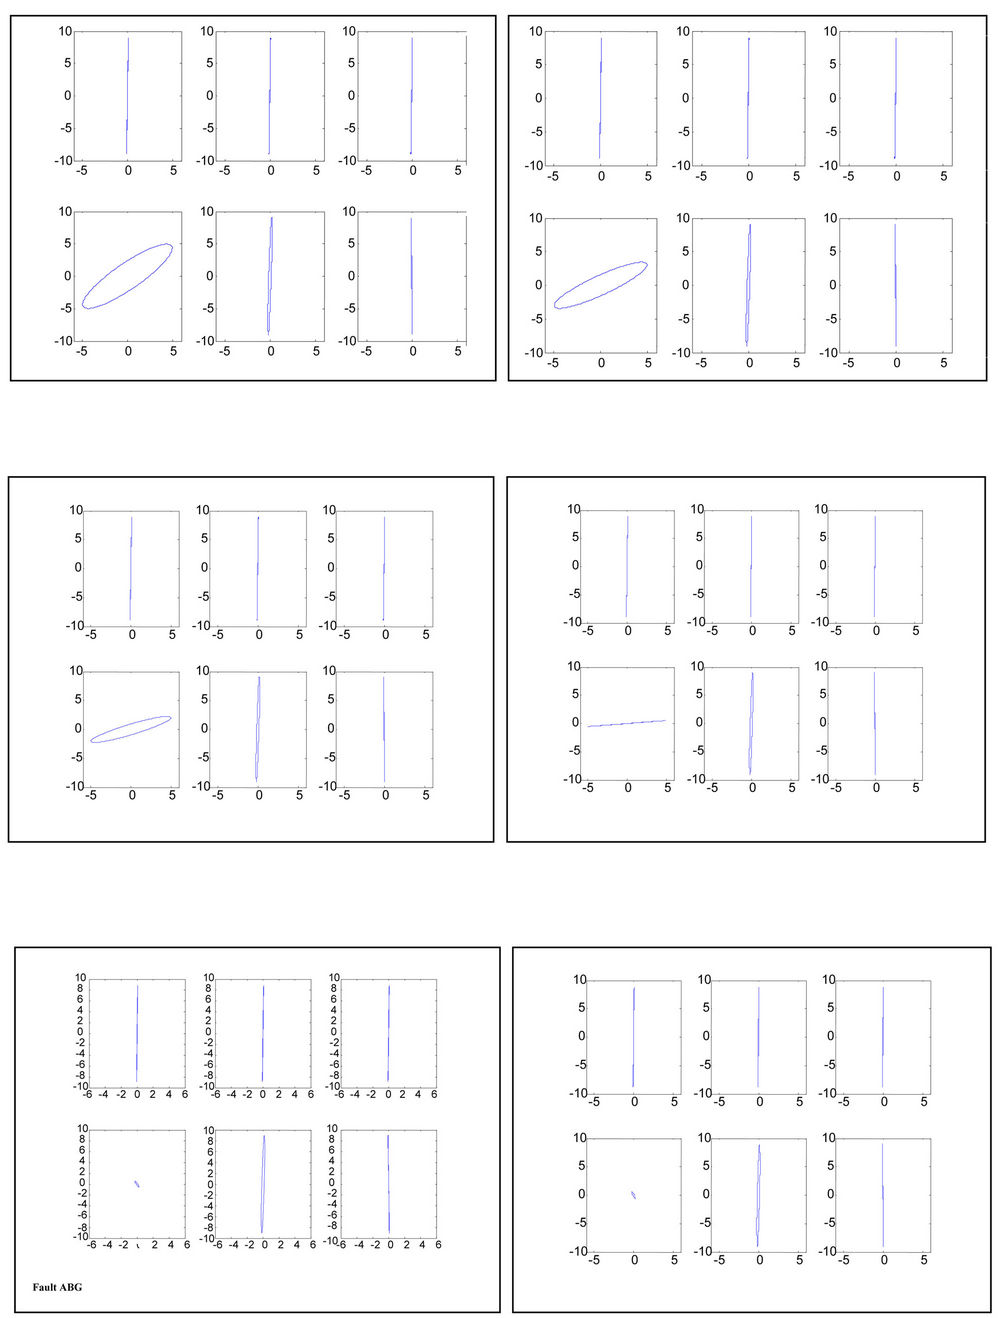
Figure 8. Fault AG at bus 4.
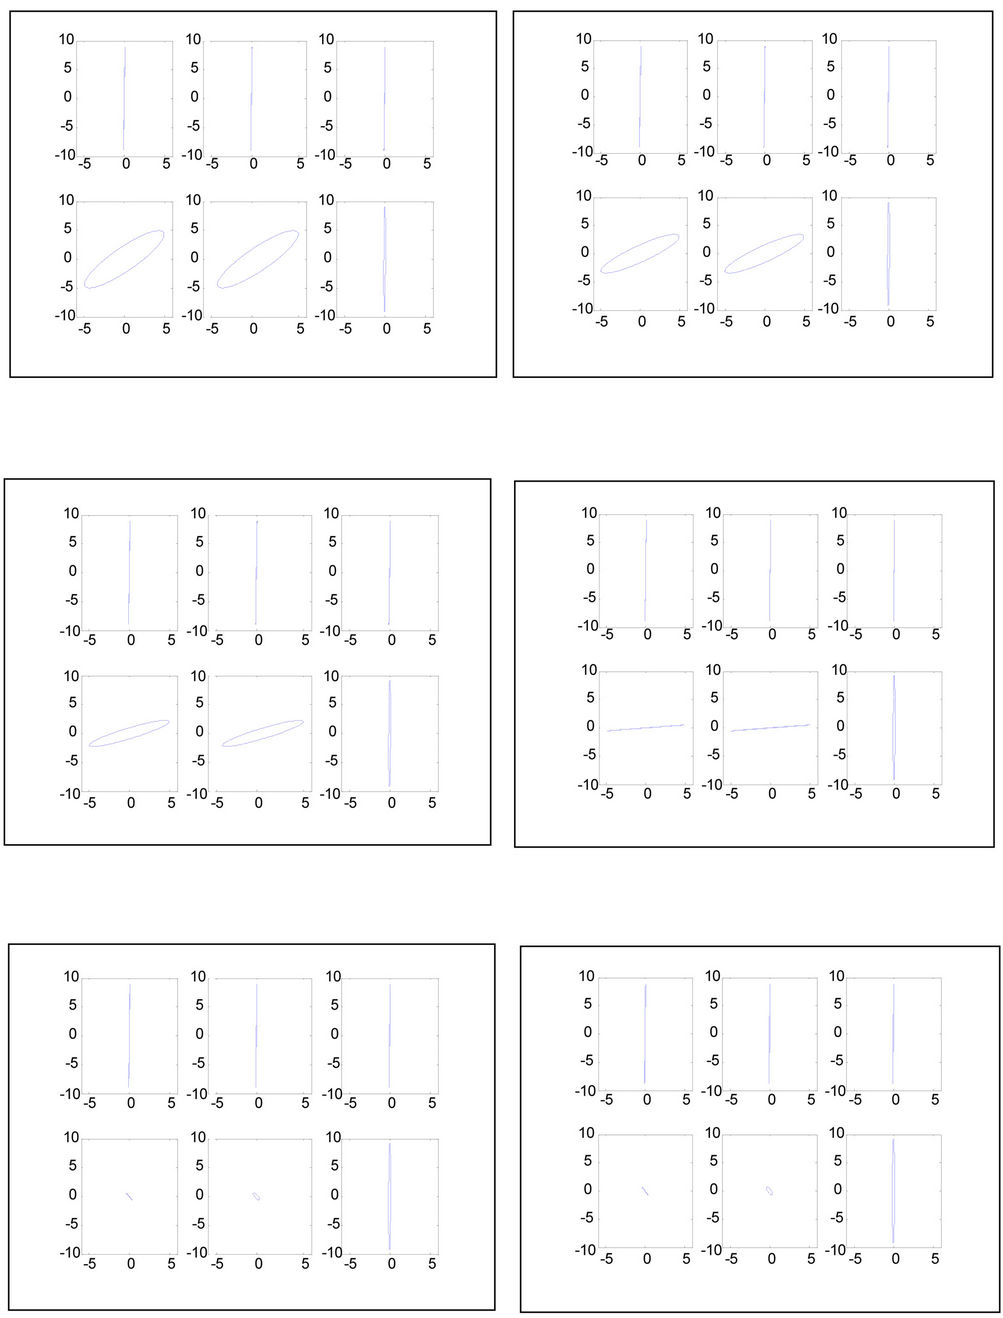
Figure 9. Fault ABG at bus 4.
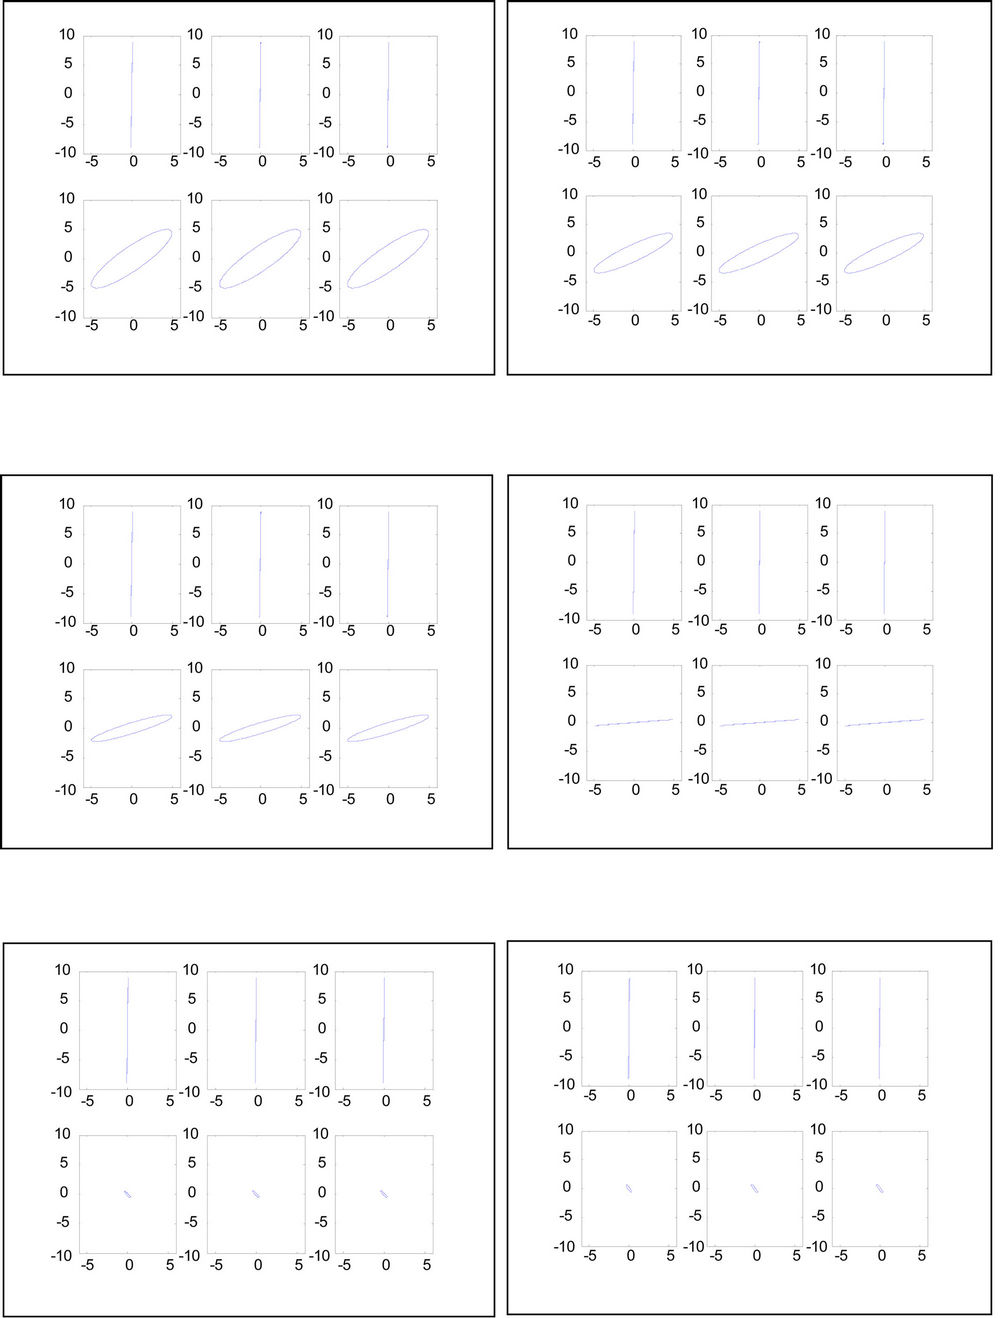
Figure 10. Fault AG at bus 4.
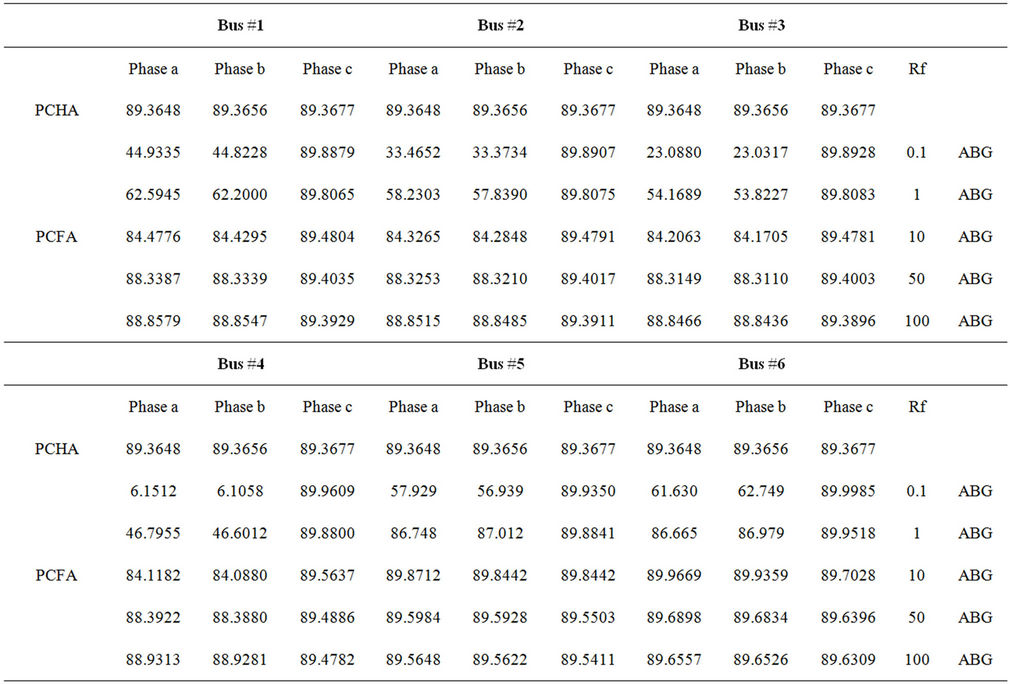
Table 1. Fault ABG at bus 4.
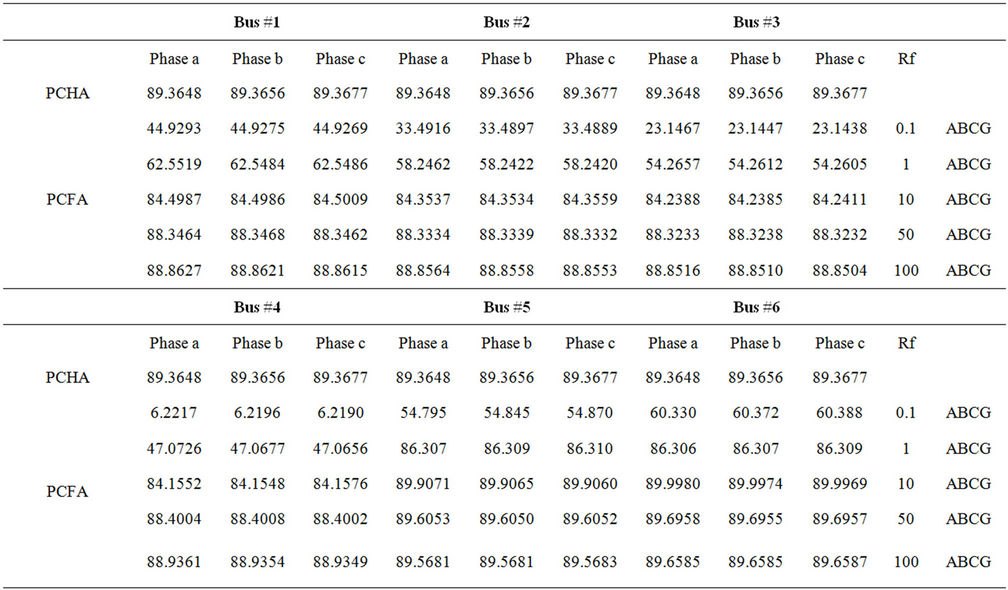
Table 2. Fault ABG at bus 4.
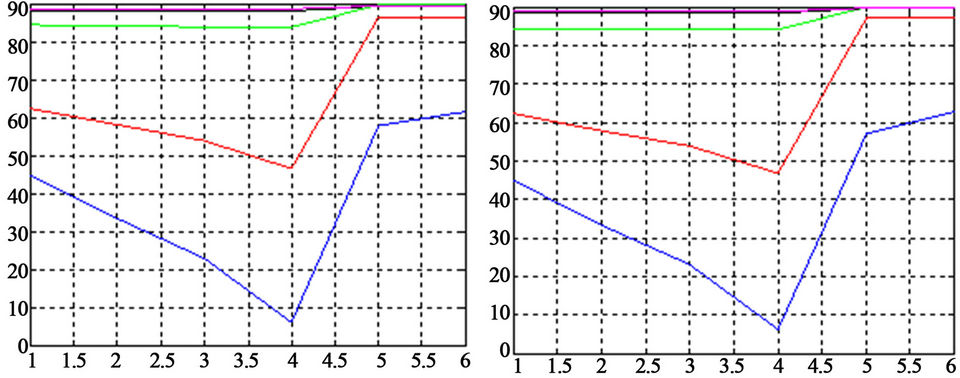
Figure 11. PCFA and PCHA value for fault AG at bus 4.
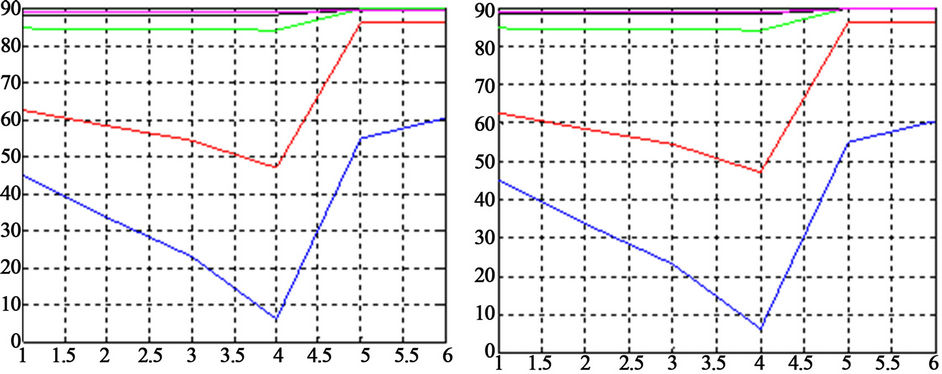
Figure 12. PCFA and PCHA value for fault ABG at bus.
PCFA and PCHA is not high and will increased gradually for small change at faulted buses then PCFA will equal PCHA after faulted buses also the location of the fault we can note easily in Figure 12.
3. Conclusion
This paper presented a new electrical protective relaying system framework to diagnosis and monitoring any fault type in electrical power system using principal component analysis fitting of voltage and current ellipses. Fault signatures were projected into the PC space and then based on ellipse parameter the diagnosis and monitoring will be take action on the system. This proposed work is computationally simple, efficient, and can be used in real-time applications.
REFERENCES
- P. Raval, “ANN Based Classification and Location of Faults in EHV Transmission Line,” Proceedings of the International Multi-Conference of Engineers and Computer Scientists, Hong Kong, 19-21 March 2008, pp. 60- 63.
- Z. Q. Bo, R. K. Aggarwal, A. T. Johns, H. Y. Li and Y. H. Song, “A New Approach to Phase Selection Using Fault Generated Frequency Noise and Neural Networks,” IEEE Transactions on Power Delivery, Vol. 12, No. 1, 1997, pp. 106-113. doi:10.1109/61.568230
- M. Hagh, K. Razi and H. Taghizadeh, “Fault Classification and Location of Power Transmission Lines Using Artificial Neural Network,” International Power Engineering Conference, Singapore, 3-6 December 2007, pp. 1109-1114.
- H. Hizam and P. Crossley, “Single-Ended Fault Location Technique on a Radial Distribution Network Using Fault Generated Current Signals,” International Journal of Engineering and Technology, Vol. 3, No. 1, 2006, pp. 148- 158.
- F. Magnago and A. Abur, “Fault Location Using Wavelets,” IEEE Transactions on Power Delivery, Vol. 13, No. 4, 1998, pp. 1475-1480.
- M. B. de Sousa and A. K. Barros, “Fault Location in Medium and High Voltage Transmission Line through Efficient Coding,” IEEE/PES Transmission and Distribution Conference and Exhibition, Dallas, 21-24 May 2006, pp. 893-898.
- J. Liang, S. Elangovan and J. B. X. Devotta, “A Wavelet Multire Solution Analysis Approach to Fault Detection and Classification in Transmission Lines,” Electrical Power and Energy Systems, Vol. 20, No. 5, 1998, pp. 327-332. doi:10.1016/S0142-0615(97)00076-8
- D. Chanda, N. K. Kishore and A. K. Sinha, “Application of Wavelet Multire Solution Analysis for Identification and Classification of Faults on Transmission Lines,” Electric Power Systems Research, Vol. 73, No. 3, 2005, pp. 323-333. doi:10.1016/j.epsr.2004.07.006
- Q. Alsafasfeh, I. Abdel-Qader and A. Harb, “Symmetrical Pattern and PCA Based Framework for Fault Detection and Classification in Power System,” Proceedings of IEEE Electro/Information Technology Conference, Normal, 24 May 2010, pp. 1-5.
- J. Sadeh and H. Afradi, “A New and Accurate Fault Location Algorithm for Combined Transmission Lines Using Adaptive Network-Based Fuzzy Inference System,” Electrical Power Systems Research, Vol. 79, No. 11, 2009, pp. 1538-1545.