Energy and Power Engineering
Vol. 4 No. 4 (2012) , Article ID: 20226 , 12 pages DOI:10.4236/epe.2012.44040
A Conceptual Framework Evaluating Ecological Footprints and Monitoring Renewable Energy: Wind, Solar, Hydro, and Geothermal
1Division of Life Sciences, Rutgers University, Piscataway, USA
2Environmental and Occupational Health Sciences Institute, UMDNJ and Rutgers University, Piscataway, USA
3Consortium for Risk Evaluation with Stakeholder Participation, Vanderbilt University and Rutgers University, Piscataway, USA
4Environmental and Occupational Medicine, UMDNJ-Robert Wood Johnson Medical School, Piscataway, USA
Email: gochfeld@eohsi.rutgers.edu, burger@biology.rutgers.edu
Received April 20, 2012; revised May 21, 2012; accepted June 11, 2012
Keywords: Airshed; Atmosphere; Energy; Ecological footprint; Geoshed
ABSTRACT
With worldwide increases in energy consumption, and the need to increase reliance on renewable energy, we must examine ecological footprints of each energy source, as well as its carbon footprint. Renewable energy sources (wind, solar, hydro, geothermal) are given as the best examples of “green” energy sources with low carbon emissions. We provide a conceptual model for examining the ecological footprint of energy sources, and suggest that each resource needs continued monitoring to protect the environment, and ultimately human health. The effects and consequences of ecological footprint need to be considered in terms of four-compartments: underground (here defined as geoshed), surface, airshed, and atmosphere. We propose a set of measurement endpoints (metrics may vary), in addition to CO2 footprint, that are essential to evaluate the ecological and human health consequences of different energy types. These include traditional media monitoring (air, water, soil), as well as ecological impacts. Monitoring human perceptions of energy sources is also important for energy policy, which evolves with changes in population density, technologies, and economic consequences. While some assessment endpoints are specific to some energy sectors, others can provide crosscutting information allowing the public, communities and governments to make decisions about energy policy and sustainability.
1. Introduction
The United States and the World are moving toward complex and diversified means of producing energy for growing demands, particularly in rapidly advancing economies, such as China and India [1]. These needs relate to increasing populations and growing per capita demand for energy [2]. For decades, oil (and to a lesser extent coal-fire burning power plants) provided the major share of electricity for developed countries, with hydro and nuclear being important in some [3]. The public, scientists, managers, and public policy makers are interested in energy efficiency and conservation, and in diversifying energy sources, including renewable sources. The potential interruption of energy supply provides a threat to stable economies, national security, and global stability [4-6]. Dependence on foreign oil fuels these threats, and the increased use of nuclear energy is hampered by public perceptions of accidents and other risks [7]. It will be many years before the full human and ecological health consequences of the Chernobyl accident will be known [8-10], and even more for the recent Fukushima disaster caused by the earthquake and tsunami [11,12].
In addition to the growing need for energy, the risk to the environment and human health from climate change caused by CO2 emissions is an international scientific and policy challenge. CO2 concentrations have risen from 280 ppm in the 19th century to 00 ppm now, with increases to 560 ppm expected in the next 50 - 60 years [13]. The European Community countries have experienced an 11% rise in energy consumption from 1995 to the mid-2000s [1]. One of the difficulties is tracking energy consumption per country over the same time period, and there is even less information on energy conservation effects.
Renewable energy is viewed as a potential future mitigation option for climate change through reduction of CO2 emissions [14,15]. Renewable energy technologies are those that rely on primary energy resources not subject to depletion [16], and often include wind, solar, geothermal, biomass, hydropower, and tidal. In general, renewable energies are secure and environmentally benign compared to fossil fuels, and using them does not prevent future use. One difficulty is that governments have enacted laws and regulations that promote renewable energy and encourage sustainability, and both definitions, and what qualifies as renewable, are often inconsistent both within and among countries [16].
Future development of renewable energy partly depends upon assessment of potential global and regional resources. Such assessment is necessary for nearly all forms of renewable energy, particularly for geothermal [15], solar, wind, and hydro. In 2000, renewable energy sources supplied between 15% and 20% of the total world energy demand [17]. To be effective, renewable energy must have: 1) a track record of sustainable production using existing technology; 2) be applicable to developed and developing countries; 3) be useful for both industrial and residential or urban environments; 4) be reliable; 5) be effective for both heating and cooling; 6) allow for life cycle assessment; and 7) be cost effective [18-20]. Life cycle assessment should be as broad as possible of both front-end and back-end costs [18,20]. And we would add, it must be protective of human health and the environment, protective of landscape and Earth systems, and be acceptable to the public [21,22].
Considerable attention has been devoted to energy and carbon footprints, whereby the amount of land (and energy) required for keeping up the current lifestyle of a community or country is calculated [13,23,24]. Ecological footprint was originally defined as a measure of how much biocapacity a population, organization, or process requires to produce products and absorb its wastes using prevailing technology [24]. However, within an energy context, it usually refers to the CO2 dynamics of energy production (as often measured by megawatts generated/ facility or structure). We suggest that the ecological or spatial physical footprint of the energy generation facility itself, with its associated facilities and transmission infrastructure, needs to be considered. Questions include, for example, how much physical space is required to generate the electricity, how can these spatial needs be compared among non-renewable and renewable energy sources, what are the ecological costs of those space needs, and what needs to be monitored to understand the effect of energy-generating facilities on ecosystems, human health, and social systems?
In this paper we develop a model for evaluating the ecological spatial footprint of four renewable energy types (wind, solar, geothermal, hydro) that can be used in conjunction with CO2 footprint models to understand the real costs (and benefits) of renewable energy for societies, and provide some metrics for monitoring among these facilities. The conceptual model can be applied to other energy sources, whether renewable or non-renewable, and the metrics can similarly be used for different energy sources. Further, we compare the importance of the metrics among the renewable energy sources considered, with those necessary for nuclear energy. The metrics are assessment endpoints, and metrics for a given assessment endpoint may differ among energy types. This paper does not address cost/benefit analysis in terms of economics, but rather in terms of the ecological costs, which ultimately can be put in terms of megawatt energy production for each ecological cost (e.g. CO2 emissions, ecosystem conversion to energy production, space used).
2. Background
2.1. Environmental Evaluation and Assessments
Ecologists, conservationists, health professionals, and managers have been evaluating ecological health for decades, and farmers and fishing communities have done so for centuries. Healthy ecosystems are essential to provide the necessary goods and services for human communities, whether they are hunters or gathers, or live in dense cities. Ecological evaluations range from qualitative statements about the state of a habitat to quite formal processes, such as ecological risk assessment [25-28]. Less formal approaches are often used where sufficient data are not available for each of the required steps of ecological risk assessment (ERA), the problem being examined does not require a formal process, or a more complex series of problems need to be integrated (e.g. chemical contamination in areas with habitat loss, avian and bat mortality from wind mills, local versus migrant populations of birds and human disturbance).
The lack of consistency among evaluation or assessment methods led to confusion on the part of managers, regulators, decision-makers, and the public, which created a need for a formal risk assessment paradigm that could be applied uniformly. The National Research Council [29] formalized the human health risk assessment paradigm (HRA) to include four parts: hazard identification, dose-response assessment, exposure assessment, and risk characterization. Hazard identification is defining the agent (or condition) that has the potential to cause harm [25]. Dose-response usually involves laboratory tests with animals that indicate how the response varies with the exposed dose. Exposure assessment is determining the pathways (source, fate and transport) and routes (uptake) of exposure, both to humans themselves, and to target organs. It is identifying the pathway from source to receptor. Risk characterization is integrating the hazards, dose-response curves, and exposure data to describe or characterize the risk to given receptors (for HRA = humans). The NRC formal risk assessment paradigm for humans was modified and adapted for ecological risk assessment [25,30-32], and modified to fit the needs of individual agencies, such as the US Environmental Protection Agency (EPA [33]). While the process varies among agencies, the overall steps are similar: problem definition or formulation, hazard identification, assessment of potential effects (and dose-response curves where possible), exposure assessment, and risk characterization (melding exposure with assessment of effects).
However, there are many situations in which sufficient data are not available to conduct a full, formal ecological risk assessment, or in which the system is sufficiently complex that a series of interlocking models are required to examine the risks to humans, the environment, and the earth’s systems. In this situation, often assessment endpoints (metrics) are developed to evaluate ecological and human health risk from system changes. Using CO2 as a measure of the ecological footprint of different energy sources has become the current currency.
In this paper, we suggest that in addition to CO2 measures, other metrics (such as the spatial footprint and associated consequences) should be examined and considered by managers, scientists, health professionals, public policy makers, and the public. We will argue that the ecological footprint should include four compartments (subsurface or geoshed, surface, airshed, atmospheric) that have local, regional and global impacts. In this paper we define and describe geoshed, particularly as it applies to energy resources. Ecological footprint should involve metrics that can be used to compare the ecological consequences across energy types, and in this paper we use four renewable energy types (solar, wind, hydro and geothermal) to examine the conceptual model.
2.2. Monitoring
Environmental and human health monitoring are important tools to assess exposure to environmental hazards [34], and to judge whether energy types are sustainable, have low ecological footprints, and have low CO2 emissions. Most monitoring schemes examine a limited group of pollutants or chemicals, and most biomonitoring studies concentrate on one or two bioindicators or biomarkers of exposure, but more complicated biomonitoring programs that include both exposure and effects are most effective [35,36]. This leads to a more holistic approach to assessing the potential risk to humans, ecosystems, and the Earth system. Further, the problem of exposure (human, ecological, and Earth system) to complex mixtures and interacting stressors has not been adequately examined, either in terms of exposures or effects [37]. Interacting stressors include CO2 emissions, landscape scale changes, and conversion of natural habitats to anthropogenic ones or from farms to cities and industrial complexes.
There are many kinds and parameters for monitoring ecological health, including media (e.g. water, air, soil, sediment, biota), biological level (cellular to landscape and Earth systems), spatial scale (point source to landscape), temporal scale (variation in key aspects of biological and physical systems), and frequency (daily, weekly, monthly, yearly), as well as other logistical and techniques for monitoring. These in turn affect human health and societal systems.
Energy facilities, whether they are renewable or nonrenewable, are increasingly going to be held to monitoring schemes that are complex and inclusive of a full range of ecological, human, societal and Earth system variables. Climate change, CO2 emissions, and ecological footprints are only one of many that will be required. For example, nuclear facilities will be required not only to monitor a complex series of pollutants (e.g. radionuclides, mercury and other heavy metals, organics, particulate matter), CO2 emissions, media (e.g. groundwater, sediment, soil, air), and biota (eco-receptors and humans), but other ecological and human Earth system parameters (e.g. land occupied, landscape changes in habitats and ecosystems, global contribution to CO2, SOx and NOx budgets and effects, local to regional deposition of wastes).
At present, Department of Energy facilities and commercial nuclear energy producers are dealing with the global issue of maintenance and safe storage of nuclear waste materials, as well as accidents and disasters caused by natural geological events (e.g. Fukushima [11,12]). The issue of land conversion (natural ecosystems to industrial, brownfields to industrial, brown-fields or already-contaminated systems to energy facilities) is a public policy issue as well as a practical one for communities and regions. The Department of Energy, for example, is considering establishing “energy parks” on the industrial, but re-mediated portions of their nuclear facilities [38]. This would achieve development of energy resources and facilities, without converting natural ecosystems (or farmlands) to industrial sites. Thus current contaminated footprints could be converted to productive energy facilities.
A weight-of-evidence approach to environmental assessment for energy facilities can be used within types of information, as well as among types of information for different energy sources. Renewable energy will be held to similar standards as nuclear, oil and coal sources, and it is essential to be able to compare energy sources and strategies to achieve sustainable development [39]. To achieve environmentally sustainable energy resources, with minimal or mitigatable effects on societal and Earth systems, it is essential to: 1) develop conceptual models for the four compartmental ecological footprints of each type; 2) develop monitoring schemes that assess current conditions, track changes, and provide early warning of potential problems; and 3) develop and institute monitoring schemes that allow comparisons within and among energy types. While extensive attention is being devoted to CO2 emissions and monitoring, more needs to be devoted to other aspects of ecological footprints. Monitoring in the four compartments is essential to determining whether a given energy source is sustainable, what is needed to maintain it, and what the costs are to humans, ecosystems, and the Earth system.
3. Ecological Footprints
3.1. Definitions
Footprint usually refers to a spatial occupancy or physiccal space required or used by a given society, group, activity, plant, or energy source. For example, a chemical plant or nuclear plant may occupy 1000 hectares of land for their facilities and buffer lands [40]. Similarly, the wind turbines and electrical generation facilities of a wind facility may occupy a given amount of land. The ecological footprint concept, first popularized in the 1990’s [41], expands the concept of footprint to include all the affected or impacted land area, such as the watershed involved in a hydroelectric plant [16], as well as the land affected to provide raw materials, transportation corridors, and waste disposal [42,43]. Ecological footprint can be calculated for a single family, facility, city, nation [42], or globally [44].
Basically, ecological footprint is a resource accounting tool that can have several different metrics [42]. As such, ecological footprints are often expressed in units of space (global hectares). Thus, global footprint demands can include land devoted to crops, grazing, fishing, forests, carbon, and built-up areas [42,44]. This method of accounting examines the state of current global lands. However, it does not examine energy use or production, or the costs/benefits of those demands and production.
3.2. A Conceptual Model for Examining Footprints
Often ecological footprints are examined for a given facility or type of facility, which addresses local environmental concerns, but does not provide a method of comparison among and between energy options and different kinds of facilities, nor does it include the ecological space or requirements of facilities for raw materials, transportation corridors, and waste disposal sites. There are many other methods for calculating footprints, particularly for energy sources. For example, solar footprints are often calculated in terms of a solar electric footprint (electric demand/solar energy density per area), or as a self-sufficiency footprint whereby all electricity used is derived from solar (electric demand [local + industrial]/ solar energy density per area (watts/m2 [43]). Other indicators focus on sustainability (total inputs and outputs for a system) and on indicators that can be measured (productivity per inputs; energy produced per acre of land or fuel source), and thus compared across energy types [45].
There are clearly documented advantages and disadvantages to different renewable energy types depending both on geography and technology. The advantages of a renewable energy resource are low carbon emissions and few environmental effects, including low effluent and air pollution. However, there are well-known environmental effects of some renewable energy sources. These include injury and mortality to wildlife from wind facilities [46- 48], waste heat (and sometimes sulfur gases) from geothermal energy [49], habitat loss to flooding, altered water flow, and obstruction to spawning fish and other wildlife from hydroelectric facilities [50,51], and conversion of wildlife habitat or farmland into biofuel production, impacting global food supply and prices [52].
Other effects may be less obvious, but require examination and monitoring. Examples that might illustrate the importance of sufficient monitoring (because effects have been found) include: the effect of wind facilities on local meterology [53] and humidity [54], the potential for local geothermal facilities to allow development on land not previously usable because of the surface springs and thermal activity [49], the importance of appropriate mixing of lowand high-temperature heating systems for geothermal [55], changes in soil microorganisms in the aquifers of geothermal well fields [56], and full life-cycle cost calculations for solar energy because of the use of fossil fuel based energy to produce materials for solar cells, modules and systems, and from smelting, production and manufacturing facilities [57]. The traditional two dimensional space, hectares or square kilometers of the Earth’s surface required to support a particular activity or lifestyle, are no longer sufficient to evaluate effects on Earth systems.
We propose that ecological footprints should be expanded to four compartments that include the subsurface or underground, surface, airshed, and atmosphere because different energy sectors use the spatial environment differently (Figure 1). The subsurface, which henceforth we call geoshed, includes groundwater. The surface includes lands and waters, as well as traditional watersheds. The term airshed has gained recent attention, and recognizes that local or regional parts of the atmosphere share common features with respect to dispersion of emissions. Introduced to the air pollution literature in the early 1970 s [58,59], it became a popular approach around 2000 for analyzing and managing air pollution impacts or for setting geographic boundaries for air quality standards. Just

Figure 1. Illustration of the four compartments that require evaluation for solar, geothermal, wind and hydro production of energy. The arrow from the energy types indicates that they feed into a generator to produce electricity.
as watersheds typically encompass a valley or group of valleys draining into a water body, airsheds are bounded by geographical features that provide some limitation to pollution dispersion close to the ground surface. Watershed, however, is a drainage collection concept, while airshed has been an output expansion concept. By contrast, the larger atmosphere is unbounded as air mass movements occur over areas on the continental or global scale.
We propose geoshed for the subsurface (or underground) three dimensional space, particularly the aquifers drawn on or impacted by energy sources. It includes extraction of thermal energy, extraction of natural gas or coal, and disposal of waste, including nuclear and other wastes. The geoshed concept recognizes the importance of the underground ecology.
While each of the compartments can be divided further, the impacts and consequences of energy development on each compartment are critical to ecological (and human) health. For example, the geoshed could be divided into different geological formations and aquifers, varying greatly in temperature and chemical composition both vertically and horizontally. Further, we suggest these compartments must include additional considerations for onshore and offshore development [60]. While each of the four compartments exists for offshore development, the marine environment creates additional challenges, with unique consequences and impacts for marine ecosystems (including estuarine, coastal, and pelagic zones). Ecological effects depend not only on amount of space used in each compartment by each energy sector, but the type of use (resource extraction, waste dilution), and conversion factors (land or water type before use).
Such an analysis is essential because the ecological effects and consequences of energy resource development in each compartment differ, and some effects may be overlooked if careful consideration is not given to each compartment. Recent attention has focused on Earth global systems, such as the effect of CO2 emissions [1,61, 62], yet effects on surface and groundwater will become more important with increasing populations, and increaseing concentrations of people that put higher demands on extracting potable water and water for agriculture.
The types of questions the public, scientists and governmental agencies will want answered, as well as the consequences, vary with the type of energy and the compartment involved (Table 1). Separate considerations for each compartment will focus attention on the unique ecological aspects of each. For example, if either soil structure or soil invertebrate communities are disrupted in the geoshed compartment, the land may be less usable for agriculture. If groundwater levels are lowered, or groundwater is contaminated, sufficient irrigation or drinking water may not be available. Table 1 provides examples of some of the types of question that apply to each compartment, with possible consequences. It is meant to provide examples, and is not exhaustive.
The specific kinds of questions asked will relate not only to the compartment, but to the energy resource. Thus, considerations of wind resources will mainly focus on the surface and airshed compartments and possible effects on biota, ecological community structure, and compatible land uses, while hydro will focus mainly on atmosphere, surface (and subsurface) because there are few underground facilities, and few emissions into the airshed, although there may be spray and release of volatiles at falls. Questions for solar capture will focus on the surface and subsurface, as well potential effects on albedo (earth surface reflectance) and global temperature changes. Geothermal energy development potentially affects all compartments except for atmospheric because the energy source is underground and near the surface in some instances, and sulfur and other gases, including some CO2, can be released to the airshed and may affect both ecological and human receptors.
During construction, operation and maintenance, these renewable energy sources have the potential for injuries to workers and the public, such as those involving vehicles, falls and crushing, electrocutions, and being struck by objects, as well as accidents during transportation of materials to and from energy facilities [63]. Such accidents can occur at any energy facility, whether renewable
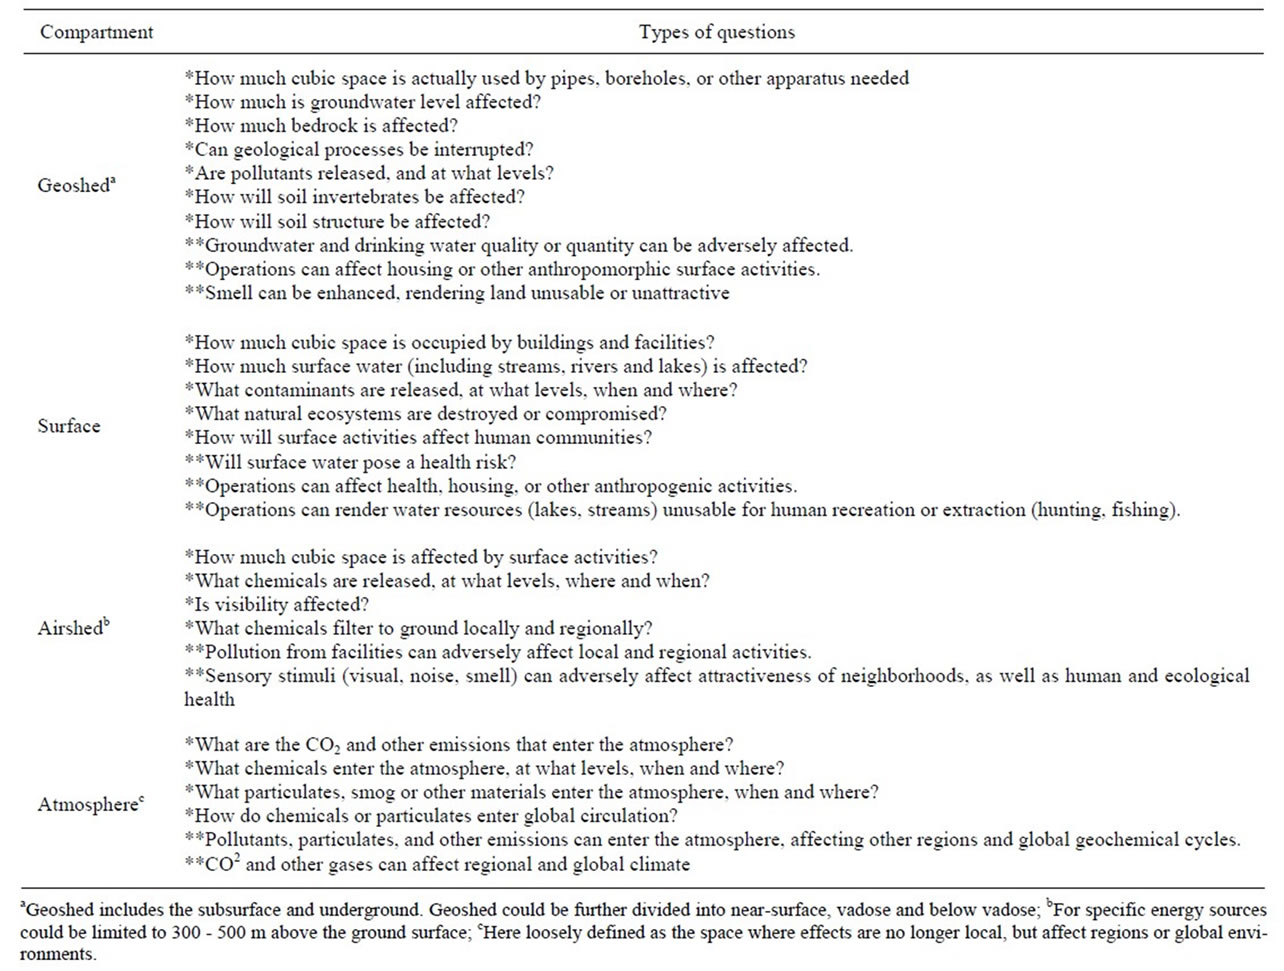
Table 1. Questions (*) and implications (**) of a four-compartmental evaluation of ecological footprints (see Figure 1). These are meant only as examples.
or not. Most renewable energy facilities, however, do not have the potential for large-scale disasters that can impact human health, societies, and ecosystems. An exception is hydro because of large reservoirs located behind large dams. Dam failure, though rare, causing massive flooding, could result in loss of life and property, loss of towns and communities, and destruction of ecosystems. While devastating locally or to a region, they do not have the potential for global effects of high CO2 or toxic chemical emissions (that affect Earth systems).
In contrast, non-renewable energy sources have the potential for high CO2 emissions, mercury emissions, or catastrophic events that can cause massive effects. Coalfire burning power plants have high CO2 emissions. They also routinely release mercury into the atmosphere [64], which enters the food chain, resulting in high mercury levels in fish that can pose a threat to consumers, including humans [65-67]. Ash disposal catastrophes, such as the 2008 containment failure and massive spill at the Tennessee Valley Authority’s, Kingston, Tennessee power plant [68] are uncommon, but have local consequences comparable to refinery fires or some nuclear releases.
While catastrophic events at nuclear plants such as Chernobyl (USSR in 1986) and Fukushima (Japan, 2011) are rare, they have the potential for high impact human and ecological effects, both at the regional and global level. The public generally has considerable “fear” or concern about the potential for low probability, high consequence events [7]. On first look, the ecological footprint of nuclear facilities in terms of absolute space is small compared to other energy sources, unless there are radionuclide emissions. There are few underground facilities (although this may change with new requirements for safety and cooling), and normally, little intrusion into either the airshed or atmosphere, although accidental or intentional venting may occur at some facilities during operations or maintenance. However, the full life-cycle cost of operation of a nuclear facility may be high. Life cycle costs include mining, milling, enrichment, and fabrication (with attendant ecological and human health effects), safe transportation corridors requiring new infrastructure, and the unsolved problem of waste disposal, which may entail significant subterranean (or geoshed) land use.
3.3. Application
The application of the model proposed requires an indepth analysis for a given energy source, such as solar. Ideally, such an application is most useful from a given facility. As an example, we suggest steps for facilities to follow, which include: 1) Designation of a Project leader; 2) Appointment of a team for each compartment (geoshed, surface, airshed, atmosphere); 3) Selection of a member of each team as its Chair, and assignment of the chair to an Evaluation Board; 4) Assessment of each Compartment by the relevant team; and 5) Coordination and final evaluation by the Evaluation Board.
Each team should be composed of a range of scientific disciplines (as well as relevant stakeholders). The initial evaluation by each team would include the parameters held in common (e.g. cubic space involved, chemicals released, ecosystems and organisms at risk), followed by examination of the characteristics unique to that compartment (Table 1).
The initial assessment results in provision of status information. Status information can then be used to design the monitoring schemes necessary for each separate energy type (see Table 2). The actual monitoring necessary will depend not only on the energy source, but on local environmental and social conditions.
4. The Role of Monitoring
The monitoring required of energy facilities, at least in the United States, is governed by a series of local, state, and federal laws and regulations, and varies among energy types. Air quality, chemical and radiological releases, and effects on local fish, and wildlife are regularly monitored, and data reported to the appropriate agencies. However, we suggest that other assessments and monitoring of all energy facilities, whether renewable or nonrenewable, would provide additional information to allow the public, ecologists and health professionals, and governmental agencies to compare and contrast among energy sources for the purposes of developing sound and sustainable energy policies.
We propose that monitoring should include ecological footprint monitoring of the four spatial compartments, as well as the traditional environmental quality monitoring of media (water, air, sediment, soil) and biota (Table 2). Not all monitoring will be appropriate for all energy resource sectors, but others will be applicable to all, both renewable and non-renewable energy resources. While the expected levels of CO2, mercury, and other pollutants will vary greatly among energy sectors, all use fossil fuels in the transportation of materials to the facilities, which results in some release of CO2. The four-compartmental ecological footprint measures are also applicable to all energy sources, although less so for the geoshed compartment. Similarly, biota monitoring parameters are applicable to all energy sectors, particularly metrics for human perceptions, mortality or injuries to wildlife, and other sublethal effects for humans and eco-receptors (Table 2).
The parameters described in Table 2 are assessment endpoints, that is, aspects of energy resource use that should be monitored to assess potential ecosystem and


Table 2. Types of monitoring suggested for four types of renewable energy. Traditional involves environmental quality, including pollutant levels and particulate matter. X before the solar column indicate what might be necessary for nuclear as a comparison.
human health effects, and to provide early warning of potential harm to humans, ecosystems, and the Earth system. Individual metrics for each assessment endpoint may differ among energy types. For example, effects to wildlife differ among energy sources. Wind facilities can have mortality of birds and bats [46], and geothermal can have effects on soil invertebrate diversity [56]. However, we propose that the assessment endpoint (effects to wildlife) needs to be examined across energy types.
5. Discussion and Conclusions
5.1. Need for Holistic Approach to Ecological Footprint and Monitoring
The imperative to develop a sustainable energy strategy for individual nations, as well as globally, must include conceptual models for ecological footprints that include the effects and implications of four compartmental space, and monitoring to allow for current assessment, trends analysis, and early warning of potential local, regional, and global effects. The recent emphasis on one or another aspect of a given energy sector (e.g. CO2 emissions, other noxious gas emissions, use of fossil fuel) to the exclusion of a more holistic approach to assessment results in failure to consider other ecological implications. For example, conversion of natural ecosystems or farmland to massive solar facilities has long range implications for global temperature changes (through changes in reflectance and albedo), loss of food production areas, and loss of species diversity and ecosystem types (if massive solar facilities are placed in deserts). In contrast, considerations of the spatial footprint required in the surface compartment for solar facilities may encourage further research and development to reduce the physical space need for these facilities.
5.2. Integrating Different Ecological Consequences
Too often the focus of discussions about energy resources is one-compartmental, or at best, considers only a few factors, such as use, source or costs of fossil fuels or CO2 emissions. We proposed a multi-compartmental approach that considers not only traditional environmental quality monitoring, but monitoring of ecological footprints in terms of four-compartmental space and ecosystem/landscape parameters. To some extent this will require a weight-of-evidence approach since comparing among parameters is difficult, although the common currency of megawatt production can be used. A weight-of-evidence approach to environmental assessment for energy facilities will not only be useful within types of information, but among types of information for different energy sources [68,69].
The ultimate measure of sustainability may well be our ability to provide energy without global change [13]. However, global change not only refers to global climate change, but to other measures as well. Amount of land used to keep up society’s lifestyle, changes in species diversity, and what types of ecosystems are sacrificed to human development, may have equal implications for the societies and the earth [6,22]. Making societal decisions about energy strategies will require integrating among sustainability attributes (as measured by the monitoring indicators provided in Table 2), which in turn requires balancing among attributes. For example, how will managers and society balance individual versus population effects, ecological versus human health effects, local versus regional or global effects or consequences, and one type of global effect (climate change) against another (land use changes, ecosystem type changes). While the decisions about how to balance these are societal and within the realm of public policy makers, providing assessments and monitoring data on the necessary compartments is the role of ecologists, economists, and health professionals.
5.3. Conclusions
We suggest that there are a number of assessment endpoints or metrics that should be used when evaluating energy resource sectors, in addition to CO2 emissions. One key metric is ecological footprint examined in terms of four-compartmental space: geoshed (underground or subsurface), surface, airshed, and atmosphere. Conversion of the earth’s natural ecosystems into farming, residential, industrial, or energy production has conesquences for Earth system changes. The ecological issues, as well as the effects and consequences, will vary among the four compartments. Monitoring a range of metrics will provide a more balanced basis for making decisions about energy sources and long-term sustainability.
Balancing will require Earth system global change models (well examined and monitored by ICPP), conceptual models of ecological footprints (four-compartmental space), and monitoring metrics that can be applied within and among energy types, within and among countries, within and among different media (air, water, soil, sediment, biota), and within and among components (i.e. terrestrial, aquatic). While not all metrics suggested in this paper will be useful for all energy resource sectors, many will allow comparisons among energy types.
6. Acknowledgements
We are grateful to many people for valuable discussions about these topics over the years, including C. W. Powers, D. Kosson, J. Clarke, M. Greenberg, B. Goldstein, P. Lioy, E. Gunnalaugsson, C. Safina, S. Smallwood, J. Yee, J. Estep, and S. Orloff and to T. Pittfield who prepared the figure. This research was partly funded by the Consortium for Risk Evaluation with Stakeholder Participation (CRESP) through the Department of Energy (AI # DE-FG 26-00NT 40938 and DE-FC01-06EW07053), NIEHS (P30ES005022), and EOHSI. The conclusions and interpretations reported herein are the sole responsibility of the author, and should not in any way be interpreted as representing the views of the funding agencies.
REFERENCES
- S. Perry, J. Klemes and I. Bulatov, “Integrating Waste and Renewable Energy to Reduce the Carbon Footprint of Locally Integrated Energy Sectors,” Energy, Vol. 33, No. 10, 2008, pp. 1489-1497. doi:10.1016/j.energy.2008.03.008
- J. Sheffield, “World Population Growth and the Role of Annual Energy Use Per Capita,” Technological Forecasting and Social Change, Vol. 59, No. 55, 1998, pp. 55-87. doi:10.1016/S0040-1625(97)00071-1
- A. McDonald, “Nuclear Power Global Status,” International Atomic Energy Agency, Vienna, 2009. http://www.iaea.org/Publications/Magazines/Bulletin/Bull492/49204734548
- A. L. Alm, “Energy Supply Interruptions and National Security,” Science, Vol. 211, No. 4489, 1981, pp. 1379- 1385. doi:10.1126/science.211.4489.1379
- A. E. Waltar, “Feeding the Nuclear Pipeline: Enabling a Global Nuclear Future,” IAEA Science Forum, Vienna, 2002.
- M. Gochfeld, “Energy Diversity: Options and Stakeholders,” In: J. Burger, Ed., Stakeholders and Scientists: Achieving Implantable Solutions to Energy and Environmental Issues, Springer, New York, 2011, pp. 207-208.
- M. Greenberg and H. B. Truelove, “Energy Choices and Risk Beliefs: It Is Just Global Warming and Fear of a Nuclear Power Plant Accident?” Risk Analysis, Vol. 31, No. 5, 2011, pp. 819-831. doi:10.1111/j.1539-6924.2010.01535.x
- T. G. Hinton, R. Alexakhin, M. Balonov, N. Gentner, J. Hendry, V. Prister, P. Strand and D. Woodhead, “Radiation Induced Effects on Plants and Animals: Findings of the United Nations Chernobyl Forum,” Health Physics, Vol. 93, 2007, pp. 427-440. doi:10.1097/01.HP.0000281179.03443.2e
- A. Rantavaara, “Ingestion Doses in Finland Due to 90Sr, 134Cs, and 137Cs from Nuclear Weapons Testing and the Chernobyl Accident,” Applied Radiation and Isotopes, Vol. 66, No. 11, 2008, pp. 1768-1774. doi:10.1016/j.apradiso.2007.12.018
- E. Ron and A. Brenner, “Non-Malignant Thyroid Diseases after a Wide Range of Radiation Exposures,” Radiations Research, Vol. 174, No. 6, 2010, pp. 877-888. doi:10.1667/RR1953.1
- NPJ (Nuclear Plant Journal), “Information on Status of Nuclear Power Plants in Fukushima,” Nuclear Plant Journal, E-News, 2011.
- J. P. Christodouleas, R. D. Forrest, C. G. Ainsley, Z. Tochner, S. M. Hahn and E. Glatstein, “Short-Term and Long-Term Health Risks of Nuclear Power Plant Accidents,” The New England Journal of Medicine, Vol. 16, No. 24, 2011, pp. 2334-2341. doi:10.1056/NEJMra1103676
- G. Stoglehner, “Ecological Footprint—A Tool for Assessing Sustainable Energy Supplies,” Journal of Cleaner Production, Vol. 11, No. 3, 2003, pp. 267-277. doi:10.1016/S0959-6526(02)00046-X
- J. A. Turner, “A Realizable Renewable Energy Future,” Science, Vol. 285, No. 5428, 1999, pp. 687-688. doi:10.1126/science.285.5428.687
- C. J. Bromley, M. Mongillo, G. Hiriart, B. Goldstein, R. Bertani, E. Huenges, A. Ragnarsson, J. Tester, H. Muraoka and V. Zui, “Contribution of Geothermal Energy to Climate Change Mitigation: The IPCC Renewable Energy Report,” Proceedings of the World Geothermal Congress, Bali, 25-30 April 2010, pp. 25-29.
- G. W. Frey and D. M. Linke, “Hydropower as a Renewable and Sustainable Energy Recource Meeting Global Energy Challenges in a Reasonable Way,” Energy Policy, Vol. 30, No. 14, 2002, pp. 1261-1265. doi:10.1016/S0301-4215(02)00086-1
- J. P. Painuly, “Barriers to Renewable Energy Penetration; A Framework for Analysis,” Renewable Energy, Vol. 24, No. 1, 2001, pp. 73-89. doi:10.1016/S0960-1481(00)00186-5
- M. Pehnt, “Dynamic Life Cycle Assessment (LCA) of Renewable Energy Technologies,” Renewable Energy, Vol. 31, No. 1, 2006, pp. 55-71. doi:10.1016/j.renene.2005.03.002
- S. M. Benson and F. M. Orr, “Sustainability and Energy Conversions,” MRS Bulletin, Vol. 33, 2008, pp. 297-304. doi:10.1557/mrs2008.257
- E. Martinez, F. Sanz, S. Pellegrini, E. Jimenez and J. Blanco, “Life Cycle Assessment of a Multi-Megawatt Wind Turbine,” Renewable Energy, Vol. 34, No. 3, 2009, pp. 660-673. doi:10.1016/j.renene.2008.05.020
- J. Burger, “Environmental Management: Integrating Ecological Evaluation, Remediation, Restoration, Natural Resource Damage Assessment, and Long-Term Stewardship on Contaminated Lands,” Science of the Total Environment, Vol. 400, 2008, pp. 6-19. doi:10.1016/j.scitotenv.2008.06.041
- J. Burger, “Stakeholders and Scientists: Achieving Implantable Solutions to Energy and Environmental Issues,” Springer, New York, 2011.
- J. Holmberg, U. Lundqvist, K. H. Robert and M. Wackernagel, “The Ecological Footprint from a Systems Perspective of Sustainability,” International Journal of Sustainable Development and World Ecology, Vol. 6, No. 1, 1999, pp. 17-33. doi:10.1080/13504509.1999.9728469
- M. Wackernagel and C. Monfreda, “Ecological Footprints and Energy,” Encyclopedia of Energy, Vol. 2, 2004, pp. 1-11.
- National Research Council (NRC), “Issues in Risk Assessment,” National Academy Press, Washington, 1993.
- W. N. Beyer, G. H. Heinz and A. W. Redmon-Norwood, “Environmental Contaminants in Wildlife,” Lewis Publications, Winter Haven, 1996.
- G. W. Suter, R. A. Efroymson, B. E. Sample and D. S. Jones, “Ecological Risk Assessment for Contaminated Sites,” Lewis Publications, Winter Haven, 2001.
- G. W. Suter, T. Vermeire, W. R. Munns and J. Sekizawa, “Framework for an Integration of Health and Ecological Risk Assessment,” Human and Ecology Risk Assessment, Vol. 9, No. 1, 2003, pp. 281-301. doi:10.1080/713609865
- National Research Council (NRC), “Risk Assessment in the Federal Government,” National Academy Press, Washington, 1983.
- National Research Council (NRC), “Ecological Knowledge and Environmental Problem-Solving,” National Academy Press, Washington, 1986.
- J. Burger, “The Historical Basis for Ecological Risk Assessment,” Preventive Strategies for Living in a Chemical World, New York Academy of Sciences, New York, 1997, pp. 360-371.
- M. Sorensen, W. Gala and J. Margolin, “Approaches to Ecological Risk Characterization and Management: Selecting the Right Tools for the Job,” Human and Ecology Risk Assessment, Vol. 10, No. 2, 2004, pp. 245-269. doi:10.1080/10807030490438193
- S. B. Norton, D. J. Rodier, J. H. Gentile, W. H. van der Schalie, W. P. Wood and M. W. Slimak, “A Framework for Ecological Risk Assessment for EPA,” Environmental Toxicology Chemistry, Vol. 11, 1992, pp. 1663-1672. doi:10.1002/etc.5620111202
- National Research Countil (NRC), “Human Biomonitoring of Environmental Chemicals,” National Academy Press, Washington, 2006.
- J. Burger, “Bioindicators: Types, Development, and Use in Ecological Assessment and Research,” Environmental Bioindicators, Vol. 1, No. 1, 2006, pp. 22-39. doi:10.1080/15555270590966483
- J. Burger, “Bioindicators: A Review of Their Use in the Environmental Literature 1970-2005,” Environmental Bioindicators, Vol. 1, No. 2, 2006, pp. 136-144. doi:10.1080/15555270600701540
- K. Sexton and D. Hattis, “Assessing Cumulative Health Risks from Exposure to Environmental Mixtures: Three Fundamental Questions,” Environmental Health Perspective, Vol. 115, No. 5, 2007, pp. 825-832. doi:10.1289/ehp.9333
- M. R. Greenberg, “Energy Parks for Former Nuclear Weapons Sites? Public Preferences at Six Regional Locations and the United States as a Whole,” Energy Policy, Vol. 3, 2010, pp. 5098-5107. doi:10.1016/j.enpol.2010.04.040
- H. Lund, “Renewable Energy Strategies for Sustainable Development,” Energy, Vol. 32, No. 6, 2007, pp. 912- 919. doi:10.1016/j.energy.2006.10.017
- J. Burger, “A Framework for Analysis of Contamination on Human and Ecological Receptors at DOE Hazardous Waste Site Buffer Lands,” Remediation, Vol. 17, No. 2, 2007, pp. 71-96. doi:10.1002/rem.20125
- W. Rees, “Ecological Footprints of the Future. Overview,” People Planet, Vol. 5, No. 2, 1996, pp. 6-9.
- J. Kitzes, A. Peller, S. Goldfinger and M. Wackernagel, “Current Methods for Calculating National Ecological Footprint Accounts,” Science for Environment and Sustainable Society, Vol. 4, No. 1, 2007, pp. 1-9.
- P. Denholm and R. M. Margolis, “Land-Use Requirements and the Per-Capita Solar Footprint for Photovoltaic Generation in the United States,” Energy Policy, Vol. 36, No. 9, 2009, pp. 3531-3543. doi:10.1016/j.enpol.2008.05.035
- J. Kitzes, M. Wackernagel, J. Loh, A. Peller, S. Goldfinger, D. Cheng and K. Tea, “Shrink and Share: Humanity’s Present and Future Ecological Footprint,” Philosophical. Transactions of the Royal Society of London Biological Sciences, Vol. 363, 2008, pp. 467-475. doi:10.1098/rstb.2007.2164
- N. H. Afgan, M. G. Carvalho and N. V. Hovanov, “Energy System Assessment with Sustainability Indicators,” Energy Policy, Vol. 28, No. 9, 2000, pp. 603-612. doi:10.1016/S0301-4215(00)00045-8
- K. S. Smallwood and C. G. Thelander, “Bird Mortality in the Altamont Pass Wind Resource Area,” Journal of Wildlife Management, Vol. 72, No. 1, 2008, pp. 215-223. doi:10.2193/2007-032
- K. S. Smallwood and L. Neher, “Map-Based Repowering of the Altamont Pass Wind Resource Area Based on Burrowing Owl Burrows, Raptor Flights, and Collisions with Turbines,” Sacramento, California Energy Commission, PIER Energy-Related Environmental Research Program, 2009.
- K. S. Smallwood, L. Ruggeb and M. L. Morrison, “Influence of Behavior on Bird Mortality in Wind Energy Developments,” Journal of Wildlife Management, Vol. 73, No. 7, 2009, pp. 1082-1098. doi:10.2193/2008-555
- B. Snyder and M. J. Kaiser, “Ecological and Economic Cost-Benefit Analysis of Offshore Wind Energy,” Renewable Energy, Vol. 34, No. 6, 2009, pp. 1567-1578. doi:10.1016/j.renene.2008.11.015
- J. E. Mock, J. W. Tester and P. M. Wright, “Geothermal Energy from the Earth: Its Potential Impact as an Environmentally Sustainable Resource,” Annual Review of Energy and the Environment, Vol. 22, 1997, pp. 305-356. doi:10.1146/annurev.energy.22.1.305
- R. Waples, R. W. Zabel, M. D. Scheuerell and B. L. Sanderson, “Evolutionary Responses by Native Species to Major Anthropogenic Changes to Their Ecosystems: Pacific Salmon in the Columbia River Hydropower System,” Molecular Ecology, Vol. 17, No. 1, 2007, pp. 84- 96. doi:10.1111/j.1365-294X.2007.03510.x
- H. I. Jager and B. T. Smith, “Sustainable Reservoir Operation: Can We Generate Hydropower and Preserve Ecosystem Values,” River Restoration Applications, Vol. 24, 2008, pp. 340-352. doi:10.1002/rra.1069
- P. W. Gerbens-Leenes, A. Y. Hoekstra and T. van der Meer, “The Water Footprint of Energy from Biomass: A Quantitative Assessment and Consequences of an Increasing Share of Bio-Energy in Energy Supply,” Ecology Economics, Vol. 68, 2009, pp. 1052-1060. doi:10.1016/j.ecolecon.2008.07.013
- S. B. Roy, S. W. Pacala and R. L. Walko, “Can Large Wind Farms Affect Local Meteorology,” Journal of Geophysical Research, Vol. 110, 2004, pp. 191-201.
- S. B. Roy, “Simulating Impacts of Wind Farms on Local Hydrometeorology,” Journal of Wind Engineering and Industrial Aerodynamics, Vol. 99, No. 9, 2010, pp. 491- 499.
- W. Nowak and A. Stachel, “Systems of Simultaneous Operation of Lowand High-Temperature Heating Installations and the Effect on the Degree of Geothermal Energy Utilization in a Geothermal Heating Plant,” International Geothermal Conference, Reykjavik, September 2003, 61 p.
- K. P. York, Z. M. G. S. Jahangi, T. Solomon and L. Stafford, “Effects of a Large Scale Geothermal Heat Pump Installation on Aquifer Microbiota,” 2nd Stockton International Geothermal Conference Proceedings, Stockton, 1994, pp. 49-56. http://intraweb.stockton.edu/eyos/energy_studies/content/docs/proceedings?YORK
- V. M Fthenakis, H. C. Kim and E. Alsema, “Emissions from Photovoltaic Life Cycles,” Environmental Science & Technology, Vol. 42, No. 6, 2008, pp. 2168-2174. doi:10.1021/es071763q
- H. Reiquam, “A Method for Optimizing Pollutant Emissions in an Airshed,” Atmospheric Environment, Vol. 5, No. 1, 1971, pp. 57-64. doi:10.1016/0004-6981(71)90045-X
- J. H. Seinfeld, “Optimal Location of Pollutant Monitoring Situations in an Airshed,” Atmospheric Environment, Vol. 6, 1972, pp. 847-858. doi:10.1016/0004-6981(72)90056-X
- B. Snyder and M. J. Kaiser, “Ecological and Economic Cost-Benefit Analysis of Offshore Wind Energy,” Renewable Energy, Vol. 34, No. 6, 2009, pp. 1567-1578. doi:10.1016/j.renene.2008.11.015
- M. R. Raupach, G. Marland, P. Ciais, C. Quere, J. G. Canadell, G. Klpper and C. B. Field, “Global and Regional Drivers of Accelerating CO2 Emissions,” PNAS, Vol. 104, 2007, pp. 10288-10293. doi:10.1073/pnas.0700609104
- EIA (US Energy Information Administration), “EnergyRelated Carbon Dioxide Emissions,” 2011. http://www.eia.gov/oiaf/ieo/emissions.html
- Bureau of Labor Statistics, “Labor Statistics,” 2011. www.BLS.gov
- “NESCAUM. Northeast States Report,” 2011. www.nescaum.org/documents/pr031104mercury.pdf.
- IOM (Institute of Medicine), “Seafood Safety,” National Academy Press, Washington, 1991.
- IOM (Institute of Medicine), “Seafood Choices: Balancing Benefits and Risks,” National Academy Press, Washington, 2006.
- R. L. Vengosh, G. S. Dwyer, H. Hsu-Kimand A. Deonaire, “Environmental Impacts of the Coal Ash Spill in Kingston, Tennessee: An 18 Months Survey,” Environmental Science & Technology, Vol. 44, No. 24, 2010, pp. 9272-9278. doi:10.1021/es1026739
- I. Linkov, D. Loney, S. Cormier, F. K. Satterstrom and T. Bridges, “Weight-of-Evidence Evaluation in Environmental Assessment: Review of Qualitative and Quantitative Approaches,” Science of the Total Environment, Vol. 407, No. 19, 2009, pp. 5199-5205. doi:10.1016/j.scitotenv.2009.05.004