Food and Nutrition Sciences
Vol.4 No.8A(2013), Article ID:35286,8 pages DOI:10.4236/fns.2013.48A016
The Relationship between Antioxidant and Anti-Ulcer Activities in Saudi Honey Samples Harvested from Various Regions in Different Seasons
![]()
Chemistry Department, College of Science, King Saud University, Riyadh, KSA.
Email: njaber@ksu.edu.sa
Copyright © 2013 Nabila Al-Jaber. This is an open access article distributed under the Creative Commons Attribution License, which permits unrestricted use, distribution, and reproduction in any medium, provided the original work is properly cited.
Received March 9th, 2013; revised April 9th, 2013; accepted April 17th, 2013
Keywords: Winter and Summer Honey; Anti-Ulcer; Antioxidant; Flavonoids; Amino Acids; Phytochemical Analysis
ABSTRACT
The main chemical components of 13 Saudi honey samples (composed of winter and summer honeys) were identified according to anti-ulcer and antioxidant activity by using phytochemical and chromatographic analyses. Phytochemical screening of ethyl acetate and water extracts was used to detect the presence of carbohydrates, flavonoids, amino acids, and phenolic acids. High-performance liquid chromatography (HPLC) of sugar contents was used to detect the presence of galactose in all of the honey samples. The other detected sugars were sucrose, fructose, and arabinose. Fifteen amino acids were detected in all of the honey samples: Prolin is dominant in all of the honey samples. The citric acid and tartaric acids of winter and summer honey were also detected, in addition to faint traces of free oxalic acid. Both samples were tested for amino acids, phenolic compounds, and sugars. The most crucial result derived in this study is the effect of summer honey on ulcers. The anti-ulcer activities were also evaluated, showing that oral administration of the honey samples reduced the intensity of ulcer scores when compared to the control group. Similarly, there was a highly significant reduction in the values of the ulcer indices and areas in rats that received the same sample (P < 0.05 and P < 0.01) in comparison with those of the ulcer control rats. Finally, the antioxidant activity of the honey samples was evaluated, revealing a proportional relationship between the anti-oxidant and anti-ulcer activities. The results of this study could be reached that the effectiveness of honey as an anti-ulcer increase with the increasing its antioxidant activities.
1. Introduction
Honey, which is used in both domestic and medicinal applications, has been widely used as a sweetener since ancient times. The composition of honey varies depending on the geographical and nectar sources of a region. The quality of honey depends on its physio-chemical and sensory properties. Hence, knowledge about its constituents is essential for assessing its quality [1,2].
Certain phenolic acids and flavonoids are described in the literature as marker substances for several unifloral honeys [3]. Because the methods for extraction and determination have varied among studies, 37 phenolic acids and flavonoids are described in the literature [3,4].
Ulcerative lesions of the gastrointestinal tract are one of the major side effects associated with alcohol consumption [5]. Gastric ulcers are benign lesions occurring at a site where the mucosal epithelium is exposed to acid, alcohol, and pepsin. Several factors are implicated in the pathogenesis of gastric ulcers including stress, smoking, nutritional deficiencies and ingestion of non-steroidal antiinflammatory drugs [6,7]. In recent years, a powerful association between gastric ulcers and infection of Helicobacter pylori has been adopted [8]. Gastrointestinal bleeding is the most common complication of ulcers. A sudden loss of a large amount of blood can be life-threatening, and occurs when the ulcer erodes a blood vessel. Scarring and swelling caused by ulcers may obstruct the gastric outlet.
Numerous products are used for treating gastric ulcers including H2-blockers, proton pump inhibitors that reduce acid secretion, and sucralfate, which provides mucosal protection. Although these drugs have changed ulcer therapy remarkably, their efficacy is still debatable. Reports on clinical evaluations of these drugs show that there are incidences of different adverse effects and drug interactions during ulcer therapy [9]. Thus, screening plants and other natural compounds for active drugs is still critical and might provide a useful source of new anti-ulcer products for developing pharmaceutical drugs or, alternatively, simple dietary adjuncts to existing therapies [10].
Therefore, this study assessed the efficacy of honey samples for their gastro-protective effects in rats, as well as the study of antioxidant, and conducted phytochemical and chromatographic analysis to determine their main chemical components.
2. Material and Methods
2.1. Honey Samples and Identification
Thirteen honey samples were collected from beekeepers and divided into three main groups (summer, winter, and both). None of the samples showed signs of fermentation or granulation. Table 1 lists the 13 honey samples.
2.2. Animals
Male albino rats (220 - 230 g) and mice of both sexes (25 - 30 g) were used. The rats were maintained in cages with raised floors of wide wire mesh to prevent coprophagy, whereas the mice were housed randomly in groups in polypropylene cages. All of the animals were kept under uniform and controlled conditions of temperature and light/dark (12 h/12 h) cycles. The animals were fed a standard pellet diet and water ad libitum and were left for one week to acclimatize to the conditions of the room.
2.3. HPLC Analysis
2.3.1. For Amino Acids
1) Standards and Sample Preparation Standards of amino acids (Sigma, St. Louis, MO) and our honey samples were prepared as described by A. Fabiani, et al. [11]. Identification was based on comparing the retention times of the standards amino acids with those in the honey samples and was confirmed by performing a fortification technique.
2.3.2. For Flavonoids
To identify the flavonoids, an Agilent 1100 HPLC apparatus was used. In the high-performance liquid chromatography (HPLC) analysis, a Zorbax SB-C18 column 250 mm in length, 4.6 mm i.d., and 5 μmin particle diameter was used. To detect flavonoids, a wavelength of 337 nm was set. The mobile phase was acetonitrile-water at a ratio of 48:52(v/v); the temperature was 25˚C, with a flow rateof 0.3 ml/min; and the injected sample volume was 20 μl. Diluted standard solutions of rutin, quercetin, apigenin, kaempferol, acacetin, chrysin, myricetin, luteolin, tricetin, cinnamic acid, gallic acid and caffeic acid were analyzed under the same HPLC conditions. Furthermore, the detector response was calibrated, and the honey samples were dissolved in 0.5 gm/100 ml of deionized water.
2.3.3. For Carbohydrates
A hyopercarb column, 5U 100 × 4.6 mm in length was
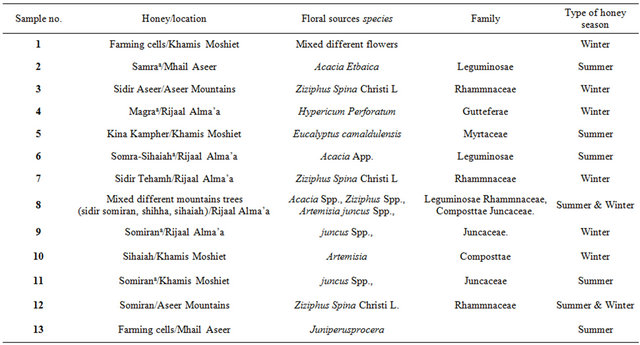
Table 1. Types of Saudi honey.
used, and the detector was RI detector, pump was GBC LC 1110 pump, software Winchrome Chromatography Ver.13, and the flow rate was 1 ml/min. The optimalmobile phase was a mixture of acetonitrile and water in the ratio of 85:15 (v/v).
Standard sugars were obtained from Sigma (St. Louis, MO). Standard solutions of sugars made up by as solving 5 g of each sugar in 1000 ML of distilled water. The honey samples were diluted in water prior to analysis (0.5 g/100 ml H2O). All standards and samples were filtered and degassed by using vacuum filtration. Before injection onto the column, all syringes were fitted with syringe filters. The retention times for all standards were noted and tabulated.
2.4. Antioxidative Activity
The honey samples were analyzed for antioxidant activity by using the DPPH method. The reaction of DPPH with the honey samples was measured spectrophotometrically, at 517 nm on a Perkin Elmer, Lambda EZ Series spectrophotometer, and the data were analyzed using the corresponding UV-Vis Analyst ver. 4.67. The crude honey diluted samples, and tenth fold, were mixed with 1 mM of a DPPH ethanolic solution in 96% ethanol, and the absorbance at 517 nm was measured (the ratio of the honey sample, DPPH solution, and ethanol were 1:1:13). The antioxidative activity of the honey sample was evaluated as the relative absorbance of the sample in the presence of the DPPH solution after the constancy of the absorbance at 517 nm by using the following formula:
where A is the absorbtion at 517 nm [4].
2.5. Ulcerogenic Activity
2.5.1. Preparation of Honey Samples
A known weight of each of honey sample and the reference drug (ranitidine) was dissolved in 3% v/v Tween 80 to produce solutions of 10% concentration. The ulcerogenic agent, ethanol (Merck), was diluted to 50% (v/v, in distilled water).
2.5.2. Doses
In the absence of LD50 values for the honey samples, an experimental dose of 100 mg·kg−1 was selected in this investigation to be administered orally to rats. The reference drug; ranitidine was administered orally at a certain dose (30 mg·kg−1). This dose was calculated by converting the therapeutic dose used in human to rat’s dose according to the findings of Paget and Barnes [11]. Ethanol (50%) was administered orally to the rats ata dose of 10 mL·kg−1.
3. Phytochemical Analysis
3.1. Phytochemical Screening
The preliminary phytochemical screening of the 13 honey samples indicated the presence of phenolic compounds (flavonoids, phenolic acids, and coumarins.), amino acids, and carbohydrates. One percent of each successive ethyl acetate and water extracts were chromatographed on pre-coated silica gel plates by using the following solvent systems:
a—Chloroform—Methanol (95:5 v/v.).
b—Ethyl acetate—Methanol—Water (30:5:4 v/v/v.).
c—Benzene—Ethyl acetate (80:20 v/v/).
Solvent systems a and b achieved the most effectiveseparation, and the chromatograms from these systems were visualized by using UV lamp (short and long wave length) before and after spraying with AlCl3, (a spray reagent for detecting flavonoids). The presence of amino acids was determined by spraying with ninhydrin on TLC plates.
3.2. Amino Acids
Sixteen amino acids or related compounds were identified in the honey samples by using HPLC. Proline, aspartine, threonine, serine, glutamine, glycine, alanine, valine, isoleucine, leucine, tyrocine, phenylalanine, lycine, argenine, and histidine, in addition to aspartic acid and glutamic acid, were found in all of the honey samples (Table 2).
3.3. Flavonoids
The flavonoids and phenolic acids of honey samples from different seasons and geographical regions were analyzed by using HPLC. More than eight flavonoids were identified in honey (Table 3), with an average content of 6.68 mg/100 g of honey. Luteolin (5,7,3’,4’-tetrahydroxy flavone) tricetin (5,7,3’,4’,5’-pentahydroxy flavone), apigenin, chrysin (5,7-dihydroxyflavone),and myricetin (3,5,7,3’,4’,5’-hexahydroxy flavone) were the main flavonoids identified in summer honeys, whereas quercetin (3,5,7,3’,4’-pentahydroxy flavone), isorhamnetin (3,5,7,4’- tetrahydroxy flavone 3’-methyl ethyl), ruten, and kaempferol were the main flavonoids identified in winter honey. The mean content of total phenolic acids in both honey samples was arranged from 3.14 - 4.34 mg/100 g of honey, with gallic, caffic, and coumaric acids determined to be the potential phenolic acids. The content of total phenolic acids was as much as 10.08 mg/100 g of honey, with gallic acid as the main component.
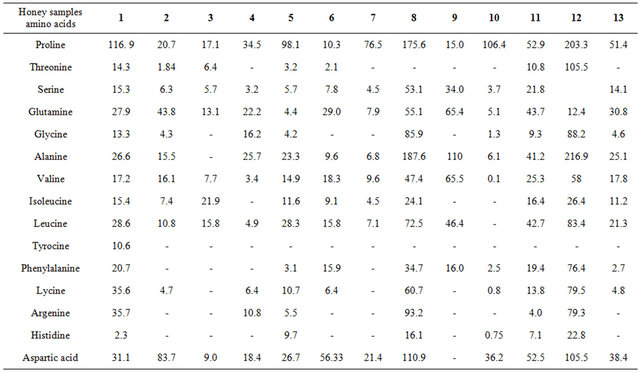
Table 2. HPLC analysis of amino acids in 13 honey samples.
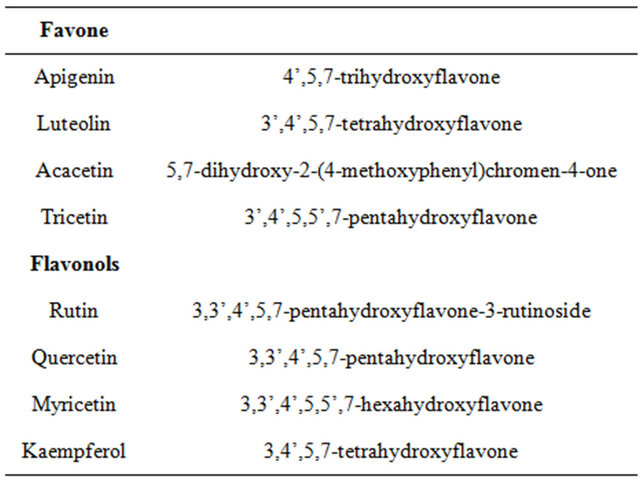
Table 3. Systematic names of the standard flavonoids used in this study.
3.4. Carbohydrates
Table 4 lists the results obtained from performing HPLC analysis to determine the carbohydrate content in the 13 honey samples. In all of the honey samples, 5 carbohydrates were evaluated and quantified: monosaccharides (fructose, glucose, arabinose, and galactose) and disaccharides (maltose). Regarding the galactose contents in all of the 13 honey samples, three of the samples (Samples 3, 5, and 8) had a higher galactose content than the others did. Significant differences were found for the carbohydrate content in the honey samples. The main distinguisher for these products was fructose content (found only in Sample 11, 0.06 mg/1 ml of honey) and high galactose content (more than 2.58 mg/1 ml of honey). The lowest glucose values were found in Sample 7 honey (averaging), whereas the average value for the other samples was 0.22 mg/1 ml.
4. Anti-Ulcer Activity
4.1. Determination of LD50
LD50 of the honey samples was estimated in albino mice (25 - 30 g) according to the method proposed by Finney [12]. In a preliminary test, animals in groups of three received one of the honey samples (i.e., 100 mg·kg−1, 500 mg·kg−1, 1000 mg·kg−1, 2000 mg·kg−1, or 4000 mg·kg−1) orally. The animals were observed for 24 h for signs of toxicity and death. Based on the results of the first test, doses between the minimal dose that kills all mice and the maximal dose that fails to kill any animal were administered orally to fresh groups of mice. The control animals that received the vehicle (10 mL·kg−1) were kept under the same conditions without any treatment. Signs of toxicity and number of deaths per dose in 24 h were recorded, and the LD50 of the honey samples was calculated as the geometric mean of the dose that resulted in 100% mortality and that which caused no lethality at all.
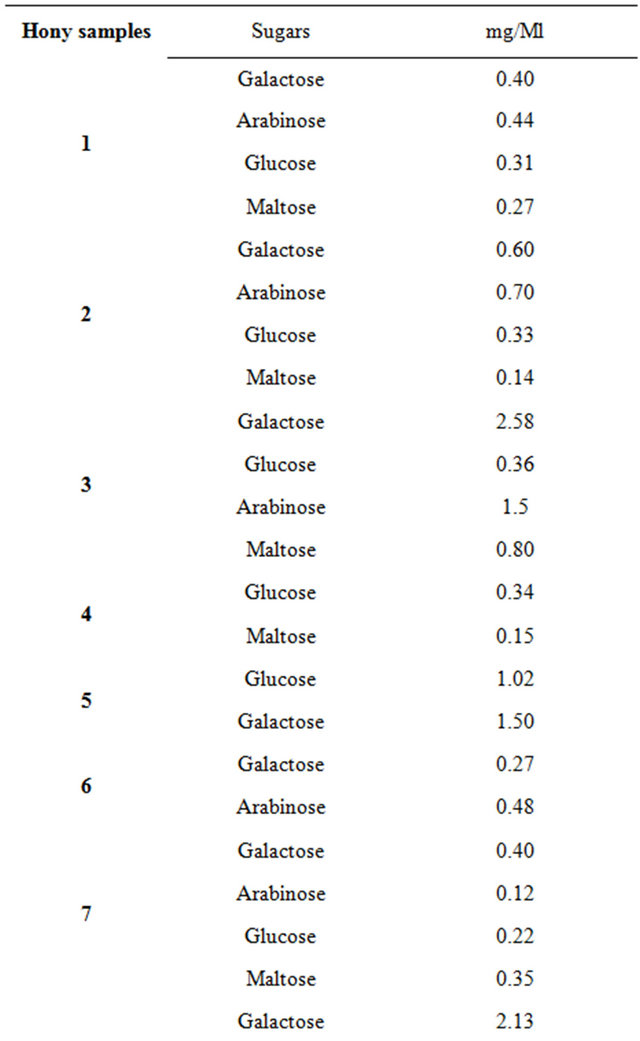
Table 4. HPLC analysis of sugar in honey samples from Saudi.
4.2. Ethanol Induced Gastric Ulcers
The anti-ulcer activity of ranitidine and the honey samples was carried out according to the method described by Garg et al. (1993) [13]. Eighty-five male albino rats weighing 220 - 230 g were divided into 17 equally numbered groups. All of the animals were fasted for 48 h before use to ensure an empty stomach. During the fasting period, the rats were administered a nutritive solution of 8% sucrose in 0.2% NaCl to avoid excessive dehydration [14]. The nutritive solution was removed 1 h before the experiment. The first and second groups received the vehicle only and were kept as the normal control and ulcer control groups, respectively. The animals in the third group (reference) were administered ranitidine (30 mg·kg−1). Other groups were administered honey samples in a dose of 100 mg·kg−1b.wt. All medications were administered orally via a stainless steel intubation needle. Two doses were administered in the first day at 8:00 and 16:00 O’ clock and a third dose was administered on the second day, 1.5 h before induction of gastric ulceration.
4.3. Induction of Gastric Ulcers
Gastric ulcers were induced in all of the rats (except for the normal control) following oral administration of 50% ethanol ata dose of 10 mL·kg−1 [15]. In the normal control rats, an equivolume of distilled water was dosed instead of ethanol. One hour after ethanol administration, all rats were euthanized by an overdose of ether anesthesia and the stomachs were rapidly excised. Each stomach was then opened along the greater curvature and gently rinsed under running tap water to remove gastric contents and blood clots. The stomachs were then fixed with 10% formaldehyde in saline and spread on a paraffin plate.
4.4. Assessment of Gastric Damage
Long lesions in the glandular part of the stomachs were counted and measured along their greater length by using a hand lens. Petechial lesions were counted then each five petechial lesions were taken as 1 mm of ulcer. Ulcer scoring was performed according to Nwafor et al. [16].
The scores were:
0, normal tissue; 1, the presence of one ulcer and generalized erythema; 2, at least two ulcers of approximately 2 mm in length; 3, lesions that followed approximately 80% of the fold; and 4, multiple ulcers along the entire length of the gastric fold.
Theulcer index (mm) was calculated as the sum of the total length of long ulcers and petechial lesions in each rat divided by their numbers (1 - 4). The ulcer area (UA) in each stomach was assessed using a scaled glass square. The area of each cell on the glass square was 1 mm2; thus, the number of cells was counted and the ulcer area was determined [17]. The percentage of protection (P%) availed to the animals through various treatments was calculated using the following formula:

4.5. Statistical Analysis
The data were analyzed by using a one-way ANOVA with SPSS 14.0 statistical software, followed by a post hoc Scheffe test. The results are expressed as the mean ± SEM. The minimal level of significance was identified at P < 0.05 and P < 0.01.
5. Results and Dissections
5.1. Chemical Constituent
In general, higher amounts of amino acids were found in the summer samples than in those of the winter samples. This may be an indication that the metabolic activities of bees were lower in winter, which also might be the result of nutritional starvation in winter. No pattern of amino acids was apparent in the samples of either the winter or summer honey, which might indicate a nutritional balance that could be used to understand these results.
In general, the honey samples from the summer season (i.e., Samples 2, 6, 8, 11, and 13) showed flavonoid profiles characterized by the presence of flavones. Bycontrast, the honey samples from winter (i.e., samples 1, 3, 4, 7, 9, and 10) showed only flavonoids with flavonols, whereas the mixed samples have mixed flavonoid types. These preliminary results show that flavonoid analysis in honey, could be used as an adjunct to studies on honey regarding season and geographical origin.
However, research has shown that the carbohydrates of honey are nearly identical, and feature a sugar mainly galactose in almost all samples, suggesting that the geographical environment may clearly indicate the sugarcomposition of honey.
5.2. Determination of LD50
All rats treated with different doses of the honey samples (up to 4000 mg·kg−1) were alive during the 24 h of observation. The animals did not show visible signs of acute toxicity, suggesting that the oral LD50 of each of the honey samples was higher than 4 g·kg−1. The tested compounds are considered to be highly safe because substances possessing LD50 higher than 50 mg·kg−1 are nontoxic [18].
5.3. Anti-Ulcerogenic Effect
Macroscopic examination of the gastric mucosa of ulcer control rats after ethanol treatment revealed edema, ulcerations, petechial lesions, and long hemorrhagic bands of different sizes. No pathological changes were observed in the normal control group, suggesting that the handling procedure did not interfere with the experimenttal results.
It was noticed that oral medication with the Samples 2, 6, 8, 11, and 13 (100 mg·kg−1), prior to ulcer induction, significantly reduced the intensity of ulcer scores into 3.3, 3.6, 3.7, 3.5, and 3.4, respectively (P < 0.05 and P < 0.01), as compared to 4.8 in the ulcer control group (Table 5). Similarly, there is a high significant reduction in the values of the ulcer indices and areas in rats that received the honey samples (P < 0.05 and P < 0.01) in comparison with those in the ulcer control rats.
Conversely, Samples 3, 10, and 12 exhibited a lower anti-ulcerogenic efficacy, reducing the ulcer scores, indices, and areas (P < 0.05) when dosed orally to rats prior to ulcer induction. Moreover, Samples 2, 6, 8, 11, and 13 induced a protection against ulcers ranging between 27.6% and 34.2%. Toa lesser extent, oral administration of Samples 3, 10, and 12 produced protection ata ratio between 18.4% and 21.0%. The other honey samples (Samples 1, 4, 5, 7, and 9) failed to improve the gastric damage.
6. Antioxidant Activity
The results of this experiment showed that the anti-oxidative activity in all honey samples was very high it has been shown that summer samples (2, 6, 8, 11, and 13), has highly effective than the others (Figure 1), whereas the rest of the samples slightly lower than the summer honey samples, possibly because of the types of flavonoid compounds that have high oxygenation patterns.
7. Conclusion
The findings of this study indicate that the geographical area of harvested honey plays a role in determining the traits of honey and its activity. Previous research has
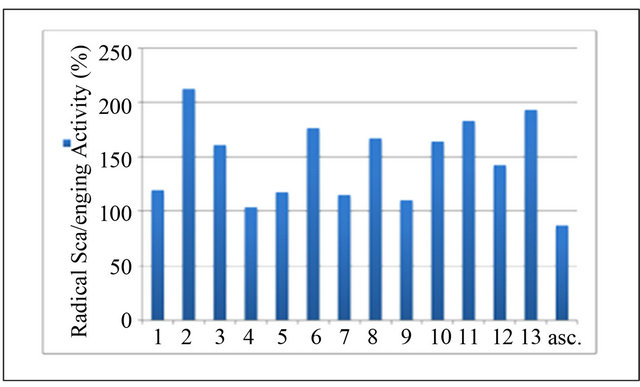
Figure 1. Antioxidant activity (%) of summer and winter honey samples.
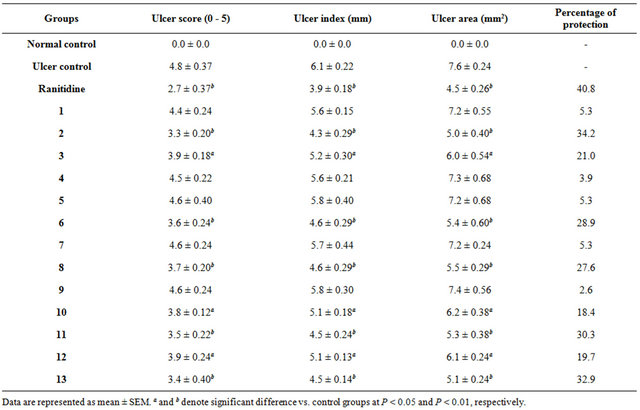
Table 5. Effects of honey samples on the macroscopic parameters of gastric ulcers induced by 50% ethanol in rats (n = 5).
shown that honey harvested in the summer has characteristics that differ from honey harvested in winter, possibly because of bees being idle in winter. Furthermore, honey that demonstrates high anti-oxidant activity and contains certain types of flavonoids can be used to treat stomach ulcers effectively.
8. Acknowledgements
This research project was supported by a grant from the “Research Center of the Center for Female Scientific and Medical Colleges”, Deanship of Scientific Research, King Saudi University.
REFERENCES
- D. Anupama, K. K. Bhat and V. K. Sapna, “Sensory and Physico-Chemical Properties of Commercial Samples of Honey,” Food Research International, Vol. 36, No. 2, 2003, pp. 183-119. doi:10.1016/S0963-9969(02)00135-7
- J. Lachman, A. Hejtmánková, J. Sýkora, J. Karban, M. Orsák and B. Rygerová, “Contents of Major Phenolic and Flavonoid Antioxidants in Selected Czech Honey,” Czech Journal of Food Science, Vol. 28, No. 6, 2010, pp. 412- 426.
- P. Krystyna and M. Biesaga, “Analysis of Phenolic Acids and Flavonoids in Honey,” TrAC Trends in Analytical Chemistry, Vol. 28, No. 7, 2009, pp. 893-902. doi:10.1016/j.trac.2009.03.015
- S. Z. Makawi, E. A. Gadkariem and S. M. H. Ayoub, “Determination of Antioxidant Flavonoids in Sudanese Honey Samples by Solid Phase Extraction and High Performance Liquid Chromatography,” E-Journal of Chemistry, Vol. 6, No. 1, 2009, pp. 429-437.
- T. Mizui, H. Sato, F. Hirose and M. Doteeuchi, “Effect of Anti-Peroxidative Drugs on Gastric Damage Induced by Ethanol in Rat,” Life Science, Vol. 41, No. 10-11, 1987, pp. 755-763.
- J. Nash, L. Lynn and M. Deakin, “Histamine H2-Receptor Antagonist in Peptic Ulcer Disease. Evidence for a Prophylactic Use,” Drugs, Vol. 6, No. 47, 1994, pp. 862- 871.
- M. D. Basil and M. S. Howard, “Clinical Gastroenterology,” 4th Edition, McGraw-Hill, New York, 1995.
- K. R. McQuaid, “Alimentary System,” In: L. M. Tierney, S. J. McPhee and M. A. Papadakis, Eds., Current Medical Diagnosis and Treatment, 41st Edition, Lange Medical Books, McGraw Hill Company, New York, 2002, pp. 616-621.
- R. K. Goel and K. Sairam, “Anti-Ulcer Drugs from Indigenous Sources with Emphasis on Musa Sapientum, Tamrabhasma,” Asparagus Racemosus and Zingiberofficinale. Indian Journal of Pharmacology, Vol. 34, No. 2, 2002, pp. 100-110.
- F. Borrelli and A. A. Izzo, “The Plant Kingdom as a Source of Anti-Ulcer Remedies,” Phytotherapy Research, Vol. 14, No. 8, 2000, pp. 581-591. doi:10.1002/1099-1573(200012)14:8<581::AID-PTR776>3.0.CO;2-S
- A. Fabiani, A. Versari, G. P. Parpinello, M. Castellari and S. Galassi, “High-Performance Liquid Chromatographic Analysis of Free Amino Acids in Fruit Juices Using Derivatization with 9-Fluorenylmethyl-Chloroformate,” Journal of Chromatographic Science, Vol. 40, No. 1, 2002, pp. 14-18. doi:10.1093/chromsci/40.1.14
- D. J. Finney, “Statistical Methods in Biological Assay,” Charles Griffin and Company Ltd., London, 1964, p. 597.
- G. P. Garg, S. S. Nigma and C. W. Ogle, “The Gastric Antiulcer Effects of the Leaves of the Neem Tree,” Planta Medica, Vol. 59, No. 5, 1993, pp. 215-217. doi:10.1055/s-2006-959654
- G. B. Glavin and A. A. Mikhail, “Stress and Ulcer Etiology in the Rat,” Physiological Behavior, Vol. 16, No. 2, 1976, pp. 135-139. doi:10.1016/0031-9384(76)90296-1
- A. Alkofahi and A. AH, “Pharmacological Screening of Anti-Ulcerogenic Effects of Some Jordanian Medicinal Plants in Rats,” Journal of Ethnopharmacology, Vol. 67, No. 3, 1999, pp. 341-345. doi:10.1016/S0378-8741(98)00126-3
- P. A. Nwafor, F. K. Okwuasaba and L. G. Binda, “Antidiarrhoeal and Antiulcerogenic Effect of Methanolic Extracts of Asparagus Pubescensroot in Rats,” Journal of Ethnopharmacology, Vol. 72, No. 3, 2000, pp. 421-427. doi:10.1016/S0378-8741(00)00261-0
- S. Szabo, “Mechanisms of Mucosal Injury in the Stomach and Duodenum: Time-Sequence Analysis of Morphologic, Functional, Biochemical and Histochemical Studies,” Scandinavian Journal of Gastroenterology, Vol. 22, No. S127, 1987, pp. 21-28. doi:10.3109/00365528709090946
- W. B. Buck, G. D. Osweiter and A. Van Gelder, “Clinical and Diagnostic Veterinary Toxicology,” 2nd Edition, Kendall/Hunt Publishing Co., Iowa, 1976, p. 5211.