Food and Nutrition Sciences
Vol.3 No.11(2012), Article ID:24607,9 pages DOI:10.4236/fns.2012.311206
Body Composition, Dietary Intake and Physical Activity Level of Sedentary Adult Indian Women
![]()
Punjab Agricultural University, Ludhiana, India.
Email: kiranbains68@hotmail.com, gurpreet_kaur881@yahoo.com
Received September 8th, 2012; revised October 8th, 2012; accepted October 15th, 2012
Keywords: Lean Body Mass; Fat Mass; Dietary Factors; Physical Activity Level
ABSTRACT
Age related changes in body composition are associated with long term dietary intake profiles. Age related increase in body fat is primarily attributed to decline in physical activity and basal metabolic rate as well as dietary intake. The study was designed to assess the body composition, dietary intake and physical activity level of sedentary adult women of different age groups. A cross-sectional study was conducted on 152 sedentary adult women comprised of students and faculty from Punjab Agricultural University, Ludhiana. The relationship of body composition with dietary factors and physical activity level of women in four age groups i.e. 21 - 30, 31 - 40, 41 - 50 and 51 - 60 years was determined. A gradual increase (p ≤ 0.05) in anthropometric and body composition parameters such as weight, waist circumference, hip circumference, body mass index, fat mass and visceral fat rating was observed with the advancement of age. The lean body mass was decreased significantly (p ≤ 0.05) as the age progressed, the values for four age groups being 74.9, 68.9, 62.8 and 60.9%, respectively. Contrary to this fat mass increased with age, the corresponding values for four age groups being 15.7, 21.4, 26.6 and 29.2 kg, respectively. The percent adequacy of protein by four age groups was 69.6, 78.2, 80.0 and 66.3, respectively when compared to RDA while fat intake was much higher i.e. 245.5, 271.8, 288.4 and 250.8%, respectively. The energy intake was inadequate among all age groups, however, a significant (p ≤ 0.05) difference was observed in daily energy consumption between the age groups. The mean physical activity level (PAL) of the subjects ranged between 1.49 - 1.60. The physical activity level values showed that majority of the subjects (87% - 94%) were having sedentary life style. Age is a crucial factor associated with body composition. A high fat mass and low lean body mass of the subjects was observed. Their diets were low in protein but high in fat. Majority of the subjects from different age groups had sedentary life style. A diet with higher protein and lesser fat combined with exercise can help in sustaining optimum body composition.
1. Introduction
The recent worldwide increase in the prevalence of obesity complicates the relationship between weight change, muscle mass and decreasing strength with age. In aging men and women, the percentage of fat mass increases, such change has been attributed to accelerated decrease in lean mass. Multivariate analysis suggested that the association between lean mass and fat mass was attributed to hereditary, dietary factors and physical activity levels [1]. Therefore, it is evident that ageing is associated with changes in body composition which includes an increase in fat mass and decrease in lean mass. Loss of lean body mass may lead to a greater risk of functional impairment and mortality and is an important public health problem.
Several international and regional studies indicated that factors causing obesity are multi-factorial in origin.
These factors may include biological and non-biological factors such as hereditary, age, sex, education, socioeconomic level, physical activity, eating habits and psychological factors [2]. Until recently, obesity was viewed as deriving from the intake of calories in relation to consumption. Nowadays, however it has been demonstrated that genetic, environmental and psychological factors participate in this equation. The risk factors may vary within and among population groups exposed to different environmental and biological influences [3].
Relationship between diet and age-related changes in lean and fat mass may become clearer if concurrent changes are studied together. Age-related changes in body composition are associated with long-term dietary intake profiles. Age-related increase in body fat is primarily attributed to decline in physical activity and basal metabolic rate as well as dietary intake [4]. Throughout much of 20th century, energy intake remained largely unchanged, even with economic development. Yet prevalence of obesity began to escalate and while the quantity and quality of food intake have become important issues, most of the obesity epidemic could probably have been avoided if physical activity levels had remained unchanged.
Asian Indian phenotypes have high body fat with relatively less BMI, less lean body mass and marked abdominal obesity [5]. A growing number of urban women aged above 35 years with gradual slowing down of metabolic rate are falling victim to sedentary life styles, rich food, lack of exercise and diets with increased protein and reduced carbohydrates have been shown to improve body composition, lipid and lipoprotein profiles and glycemic regulations associated with treatment of obesity and weight loss [6]. Derived from these outcomes, high-protein, low-carbohydrate diets are also being examined for treatment of heart disease, metabolic syndrome, and type II diabetes [7]. Large proportions of Indian women are lacto-vegetarian and hence depend on plant foods for obtaining essential amino acids. Optimum protein quality with restricted fat intake, along with a physically active life style, may help these women to have right proportion of fat and lean mass.
The importance of measuring body composition has increased due to the need to evaluate changes in the nutritional status, which can affect body reserves differenttially. Subjects can gain body fat, fat-free mass, cellular mass components as a result of overeating and sedentary lifestyle. These changes can only be detected by using valid body composition techniques. One of the important aspects of health of individuals is their nutritional status, which is defined as a result of interaction of body composition, energy balance and body functionality. Body composition assessment in terms of lean body mass and fat mass is the best long-term indicator of nutritional status. The present study is aimed at understand the role of dietary factors and physical activity levels to alter the body composition of working women especially in terms of lean body mass and fat mass.
2. Methods
2.1. Selection of Subjects
The volunteer students and women faculty members working as in Punjab Agricultural University, Ludhiana, and were in the age-range of 21 - 60 years were recruited for this cross sectional study. Women who were pregnant, lactating, hypertensive, diabetic or diagnosed for any hormonal imbalance were not included in the study. A total of 152 subjects participated in the study. A prior written consent of the subjects to participate in the study was obtained. The subjects were then divided into four groups on the basis of their age i.e. 21 - 30, 31 - 40, 41 - 50 and 51 - 60 years and number of subjects in each group was 44, 36, 42 and 30, respectively.
2.2. Dietary Survey
A structured “24 Hour Recall” questionnaire to collect the information regarding food intake was developed and pre tested. The researchers interviewed the subjects regarding their diets for three consecutive days i.e. one holiday and two working days. The subject was asked about the types of food preparations made at breakfast, lunch, afternoon tea and dinner. An account of raw ingredients used for each of the preparation was obtained and information on total cooked amount of each preparation was noted in terms of standardized cups. The intake of each food item by the subject was assessed by using the cups. The major nutrients were then calculated using MSU Nutriguide Computer Software [8]. The percent contribution of these nutrients to total energy intake was determined. The adequacy of nutrients was evaluated by comparing the intakes with Recommended Dietary Allowances (RDA) [9].
2.3. Physical Activity
PADM (Physical Activity Diary Method) was used to record the time spent on different activities for the days during which dietary survey was carried out. The daily activities were classified into sleep, light, moderate and heavy activities according to MSU Nutriguide Computer Software [8]. Basal metabolic rate (BMR), total daily energy expenditure (TDEE) was calculated using MSU Nutriguide Computer Software [8]. Physical activity level (PAL) was calculated using the following formula:
PAL = Total daily energy expenditure (TDEE)/Basal metabolic rate (BMR)
The life style of the subjects was determined on the basis of PAL values. The subjects of different age groups were classified into three following lifestyle categories: 1) Sedentary or light activity lifestyle 1.40 - 1.69; 2) Active or moderately active lifestyle 1.70 - 1.99; 3) Vigorous or vigorously active lifestyle 2.00 - 2.40 [10].
2.4. Anthropometry and Body Composition
Basic anthropometric measurements such as height, waist and hip circumference measurements were taken using standard methods [11]. The derived anthropometric measurements viz. body mass index and waist-to-hip ratio were calculated using standard procedures. Weight and body composition of the subjects was determined using bioelectrical impedance using Body Composition Analyzer BC-420MA [12].
2.5. Statistical Analysis
Mean and standard deviations for various parameters were computed. Analysis of variance was employed to assess the difference of dietary factors and physical activity levels of the subjects in four age groups.
3. Results and Discussion
3.1. Weight and Body Composition
Anthropometric measurements and body composition parameters of the subjects have been shown in Table 1. The weight of the subjects in four age groups ranged between 33.0 - 87.5, 40.0 - 82.4, 57.7 - 87.2 and 48.9 - 112.3 kg with mean values of 56.3, 63.3, 70.7 and 72.6 kg, respectively. The results revealed that there was a gradual increase in body weight with an advancement of age. BMI of the subjects revealed that the women in group II, III and IV were overweight by 1.6, 9.1 and 15%, respectively when compared to an ideal BMI of <25 kg/m2 [13]. The mean waist circumference of the subjects in four age groups was 80.9, 88.7, 94.2 and 94.9 cm, respectively. There was a significant (p ≤ 0.05) difference in the waist circumference of group I with that of group II, III and IV. Similarly, group II had significantly (p ≤ 0.05) lesser waist circumference when compared to group III and IV. The older age groups i.e. III and IV had significantly (p ≤ 0.05) higher hip circumference as compared to younger age groups. There was no significant increase in the hip circumference till the age of 40 years; however the hip circumference increased significantly (p ≤ 0.05) after 40 years. The waist-to-hip ratio was maximum in group II (0.89) followed by group III (0.85) and group IV (0.84), the reason being higher hip circumferences in the older age-groups i.e. 41 - 50 and 51 - 60 years. The ideal waist-to-hip ratio for women should be <0.8 [14], the subjects, except in group II had waist-to-hip ratio close to the ideal values.
An increase in body weight with an advancement of age had been reported by Ursula et al. [15]. Mean body weight of 20 - 29, 30 - 39, 40 - 49 and 50 - 59 years old professional women employed in an electronic industry of Bangalore, India were 53.2, 56.2, 57.4 and 62.1 kg, respectively [16]. The body weights were higher in the Punjabi women as compared to their counterparts from Bangalore, India. Average body weights of healthy Caucasian adult women in the age group of 18 - 34, 35 - 54 and 55 - 74 years were 73.3, 74.7, 75.1 kg [17]. The body weights of the older age group subjects in the present study were closer to the reported study. The mean BMI of professional women (20 - 50 years) from Rajasthan ranged between 27.8 - 28.9 kg/m2 [18]. BMI of 20 - 40 y old underweight, normal and overweight women from Bangalore was 17.0, 20.7 and 26.6 kg/m2, respectively [19]. The mean BMI of 18 - 74 years old Caucasian adult women ranged between 21.3 - 24.9 kg/m2 [17]. A higher BMI of the subjects was observed in the present study when compared to reported values in literature. A lower prevalence of obesity among women from three Indian
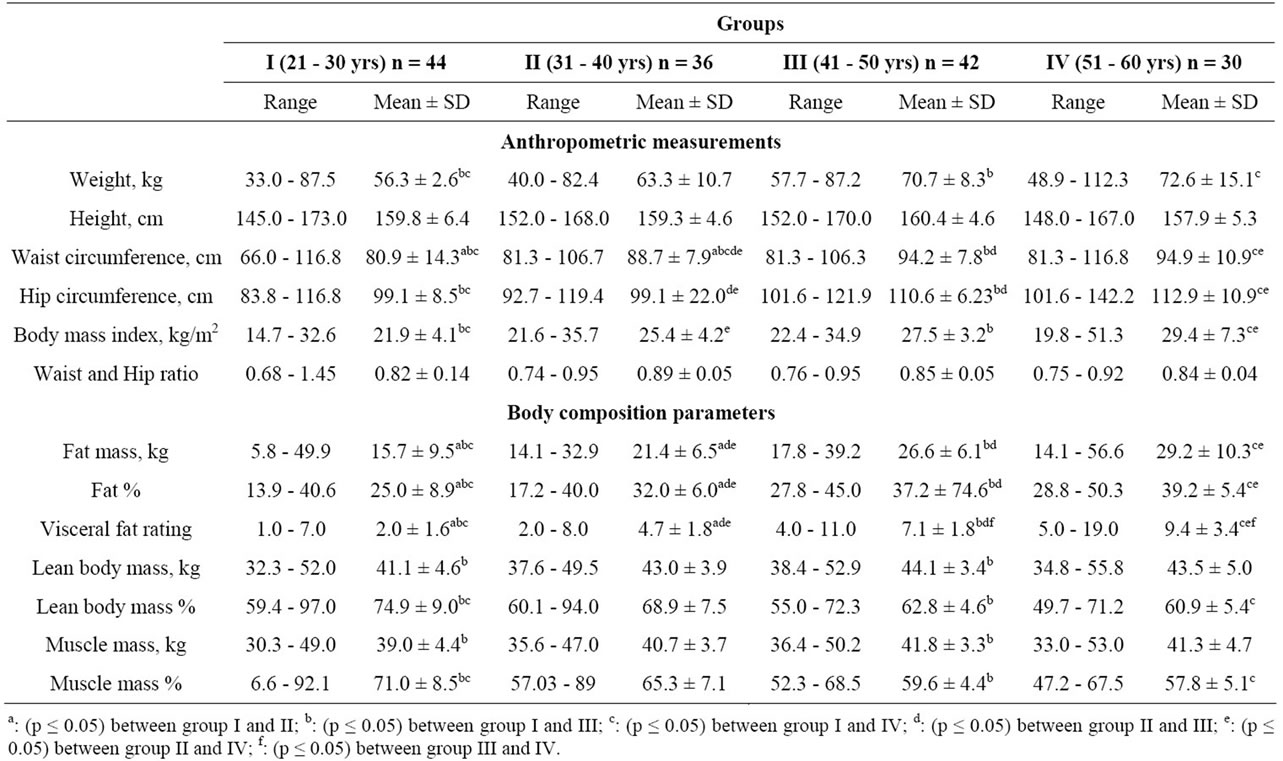
Table 1. Weight and body composition measurements of the subjects.
states i.e. Rajasthan, Tamil Nadu and Kerala was reported when compared to obesity found in the present study. Jain and Singh [18] and Joseph at al [20] reported a lower prevalence of obesity among women from Rajasthan and Tamil Nadu. The results highlighted alarming proportion of obesity in the Punjabi women especially in the older age groups. Another study reported that the waist circumferences of 18 - 50 years old obese and non-obese Rajasthani women were 83.2 and 67.7 cm, respectively. The hip circumference of normal Rajasthani women in the age-group of 18 - 50 years was 89.3 cm, whereas it was 76.2 and 105.1 cm in underweight and obese women, respectively [21]. The hip circumference of normal, overweight, obese grade I and obese grade II housewives in the age-group of 19 - 70 years from Maharashtra was 99.6, 109.4, 112.3 and 126.0 cm, respecttively [22]. The mean hip circumference of professional women from Bangalore was 93.6 cm [13]. The hip circumference of women in the present study was much higher than their women counterparts from other states of India. The waist-to-hip ratio of professional women from Bangalore ranged between 0.83 - 0.89 [16]. The women in 45 - 50 years age-group had mean waist-to-hip ratio of 0.85 [18]. The mean waist-to-hip ratio of normal, overweight, obese I and obese II women was 0.83, 0.82, 0.81 and 0.82, respectively as reported by Jain and Singh [18]. The waist-hip ratio of the subjects were close to those reported in the literature.
A significantly (p ≤ 0.05) lesser fat mass was observed among the subjects in group I when compared to group II, III and IV. Similarly, group II had significantly (p ≤ 0.05) lesser fat mass, when compared to group III and IV. Fat percentage increased significantly (p ≤ 0.05) as the age progressed. The prevalence of excess of fat mass i.e. more than suggested value of 38% [23] was found among 43, 94, 100 and 93% of the subjects of four age groups. A significant (p ≤ 0.05) increase in visceral fat rating of the subjects was observed with the advancement of age. The mean visceral fat rating of the subjects in all four groups was below 12, which indicated that the subjects were at low risk of degenerative diseases.
Group I and III showed a significant (p ≤ 0.05) difference in lean body mass (LBM). There was no significant difference in values of LBM in other age groups. The youngest age category i.e. (21 - 30 years) showed highest percent LBM as compared to other four age groups. There was a significant (p ≤ 0.05) difference in percent LBM of subjects in I and III and in I and IV age groups. The mean values of muscle mass % showed that with the advancement of age, there was a significant (p ≤ 0.05) decrease in muscle mass. The results revealed that the percent muscle mass reduced significantly (p ≤ 0.05) after 40 years of age.
Body fat of adult Caucasian women ranges between 4.8 - 60.2 kg with the mean values of 17.6 kg [17]. The mean body fat of normal and obese women from Andhra Pradesh was 14.1 and 22.6 kg, respectively [21]. The results of above mentioned both the studies revealed that the subjects in the present study had higher fat mass. Total body fat % of 20 - 59 years old professional women from Bangalore ranged between 28.7% - 35.1% [16]. The urban women from Tamil Nadu, who were normal, overweight and obese had fat percentage of 26.9, 34.8 and 41.86, respectively [20]. The mean body fat % of normal, overweight, obese grade I and obese grade II women in the age-group of 18 - 70 years from Maharashtra was 27.2, 30.9, 37.6 and 38.0%, respectively [22]. The body fat % of Caucasian adult women ranged between 11.6% - 53.7% with the mean values of 28.7% [17]. The excessive fat mass among the subjects especially among three older age groups is a matter of grave concern. The mean lean body mass of Caucasian women ranges between 26.6 - 67.2 kg which was higher than the results obtained in the present study [17]. Lean body mass of Indian women in literature ranges between 36.4 - 47.7 kg [16,19,21,22] and was close to results of the present study. The study indicated that Punjabi women similar to women from other states of India had lesser LBM whereas; their European counterparts had higher values of LBM.
3.2. Dietary Intake
Self reported energy intake and macronutrient composition has been depicted in Table 2 and Figure 1.
3.2.1. Energy Intake
The daily intake of major nutrients viz. carbohydrates, fat, energy and protein has been shown in Table 2. There was no significant variation observed in the carbohydrate intake of the subjects from four groups. The percent adequacy of intake of fat by the subjects in four age groups was 245.5, 271.8, 288.4 and 250.8%, respectively. A significant (p ≤ 0.05) difference was observed in daily energy consumption between the age groups. All the groups had lower energy intake than the recommended daily allowances [24], the percent adequacy being 68.7, 75.4, 75.4 and 69.8. There was no significant difference in the protein intake between the groups. The percent adequacy of protein by four age groups was 69.6, 78.2, 80.0 and 66.3, respectively.
The energy intake of the subjects in the present study was lower than the RDA. The reported mean daily intake of energy in urban Punjabi women ranged from 1444 - 1509 kcal, which was also inadequate [25]. In another study, an even lower mean value of energy intake (1143 kcal) among Indian women was reported [26]. The average carbohydrate intake of women in the age group of 25 - 35, 35 - 45 and 45 - 50 years, working in a sedentary
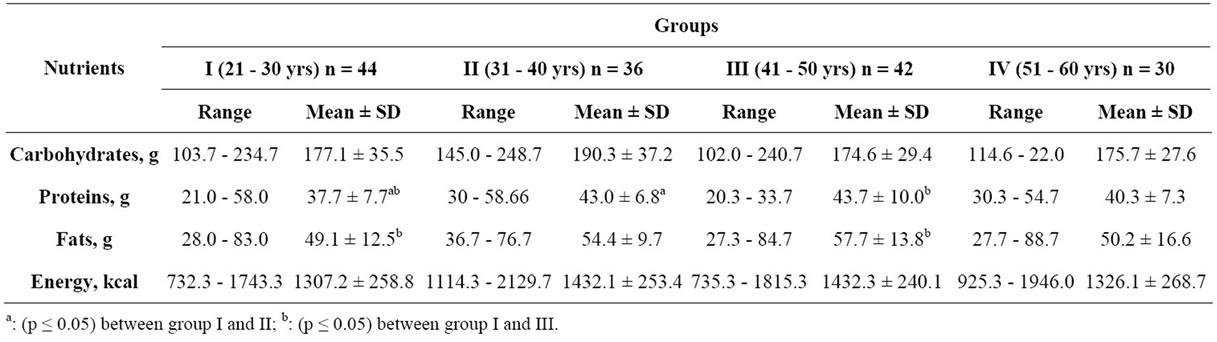
Table 2. Daily energy intake by the subjects.
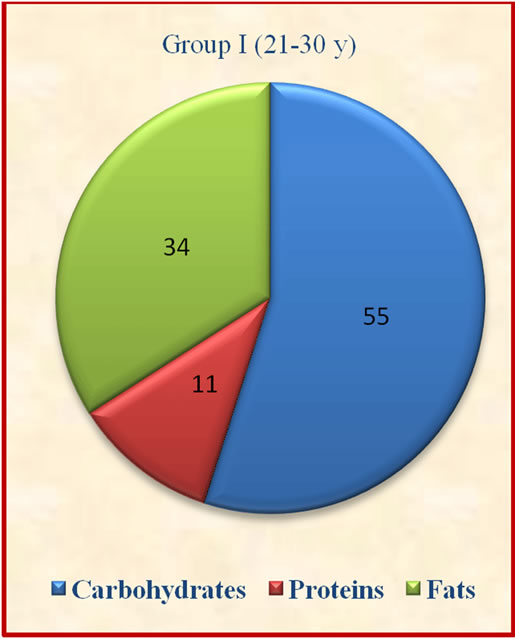
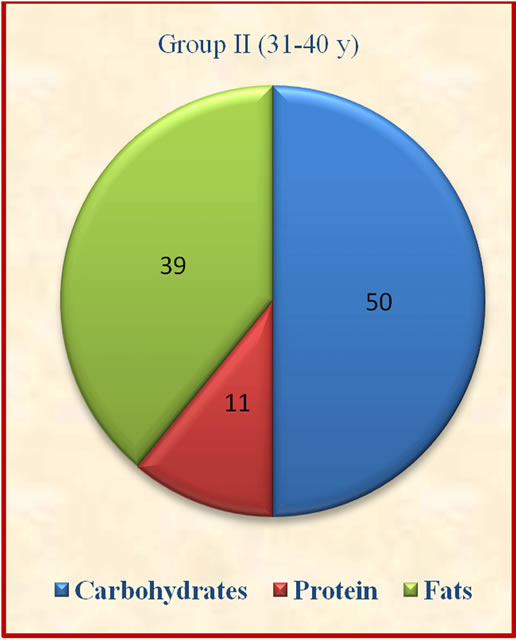
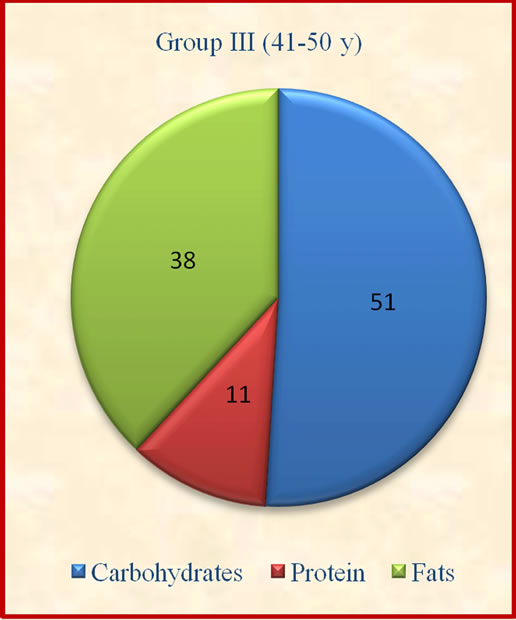
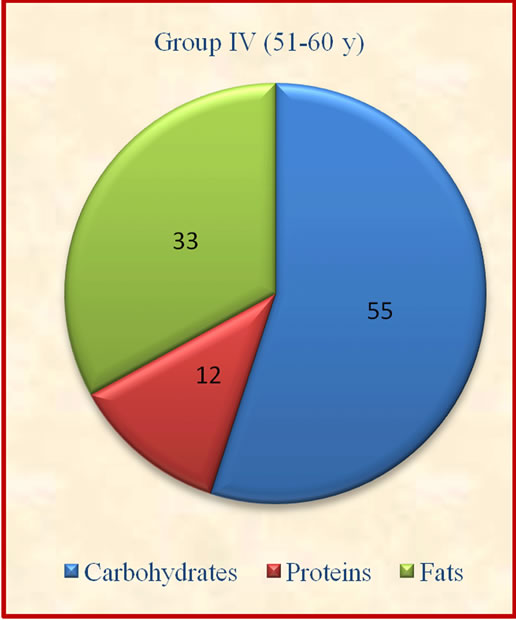
Figure 1. Contribution of carbohydrates, protein and fats to total energy.
job in Jaipur city was 227.8, 326.7 and 262.0 g/d, respectively, the corresponding values for fat were 79.2, 69.3 and 61.6 g [18]. The carbohydrate intake was less while fat intake was more in case of present study when compared to the reported study. The percent adequacy of protein by four age groups was 69.6, 78.2, 80.0 and 66.3, respectively. The average protein intake of 53.6 - 59.3 g was reported in sedentary women from Jaipur [18]. However, a deficient protein intake (46.5 g) among adult Punjabi women was reported [25,27]. A low protein intake i.e. 40.7 g was reported among Indian women from Mysore [26]. The results revealed that the Punjabi women had lesser protein intake similar to their counterparts from other states of India which may affect their body composition. Low-fat, energy-restricted diets of varying protein content (15% or 30% energy) promoted healthful weight loss, but diet satisfaction was greater in those consuming the high-protein diet [28]. A diet with higher protein and reduced carbohydrates combined with exercise additively improves body composition during weight loss program [29]. Another study reported that dietary protein is more satiating than carbohydrate or fat [30]. Higher protein dietary patterns that are low in saturated fat may be considered as a legitimate option for weight management.
3.2.2. Macronutrient Composition
The results showed that group II derived significantly (p ≤ 0.05) lesser percent calories from carbohydrates when compared to group I and IV. The contribution of protein to total energy intake was lesser while fat was above the suggested values of 10% - 15% for protein and 15% - 30% for fat [14].which may not be desirable for optimum body composition of the subjects (Figure 1). There was no significant variation observed in contribution of carbohydrates, proteins and fats to total energy among different age groups.
3.3. Physical Activity
The daily average time allocation (minutes) for different activities is shown in Table 3.
The longer sleep time for the youngest age-group was observed. Group II spent significantly (p ≤ 0.05) longer time on light activity than group I and IV. Group III also spent significantly (p ≤ 0.05) longer time on light activities when compared to group I. The younger age-group was less active as they spent significantly (p ≤ 0.05) lesser time on moderate activity when compared to group II, III and IV. The least time spent on heavy activity was among group II (21 min/d) followed by group I (25 min/d), group III (29 min/d) and group IV (29 min/d). There is easy availability of hired help for Indian women. The most prevalence practice was to hire a “part time” domestic help, the percent of subjects with “part time” domestic help in four age groups was 45%, 78%, 74% and 57%. The “full time” domestic helps was more common in older age groups i.e. 37% and 24% in group IV and III, respectively. Thirty nine percent of the subjects in group I were residing in hostels, so this factor was not applicable to them.
There was lesser sleep in the subjects above 30 years, which could be due to busy life style. The busy life style of the subjects to get ready for work at the prescribed time could be the reason for lesser time allocation for this activity. The more time spent on moderate activities like general household work in group II could be due to busy household activity pattern governed by the composition of the family i.e. more number of preschoolers or school going children. The oldest age-group spent more time in heavy activities mainly the exercise as compared to other groups which could be due to more time available to them for this activity or could be due to awareness regarding importance of exercise. Women in the age group of 25 - 50 years working in sedentary jobs in Jaipur spend 505, 539, 373, 121, 7 and 2 minutes in sleeping, sedentary, light, moderate, vigorous and strenuous activities, respectively. The study further revealed that the subjects in the age group of 35 - 45 years spent more time in sleeping (554 minutes) followed by 25 - 35 years (491 minutes) and 45 - 50 years (472 minutes). The younger

Table 3. Physical activity of the subjects.
age group (25 - 35 years) spent maximum time in moderate activities (163 minutes) while 45 - 50 years old women spent maximum time in light activities [18]. The older age group spent more time on vigorous activities involving exercise and sports as compared to their younger counterparts [18]. The results of the present study are in line with the reported study. Dietary intake and physical activity in the present study is self-reported by the subjects. Therefore, the younger participants may be underreported while the older participants over reported.
3.3.1. Energy Expenditure on Activities
Energy expenditure on sleep, light, moderate and heavy activities have been shown in Table 4.
Group I had significantly (p ≤ 0.05) more energy expenditure on sleeping and significantly (p ≤ 0.05) lesser energy expenditure on moderate activities when compared to group II, III and IV. In case of light activities group I had lesser energy expenditure as compared to group II and III. Group I had significantly (p ≤ 0.05) more energy expenditure on heavy activities as compared to group II. The older age group had significantly (p ≤ 0.05) higher energy expenditure on heavy activities as compared to group I and II and group III had signifycantly (p ≤ 0.05) higher energy expenditure on heavy activities as compared to group II.
3.3.2. Estimated Total Energy Expenditure
The mean BMR of the subjects in group I, II, III and IV was 1357, 1361, 1391 and 1357 kcal, respectively. The corresponding TDEE values were 2290, 2446, 22480 and 2392 kcal. Group I had significantly (p ≤ 0.05) lesser TDEE when compared to group II, III and IV. Group I had significantly (p ≤ 0.05) lower PAL when compared to group II, III and IV. Classification of subjects according to lifestyle in relation to intensity of habitual physical activity has been shown in Figure 2. The maximum number of subjects in all four groups was having light activity life style, the range being 87% - 94%, whereas maximum number of moderately active subjects were from group IV (13%) closely followed by group III (12%).
The youngest age group had the least PAL, which might be attributed to less social and household responsibilities in this group. The older age groups had more active life style which could be attributed to better awareness regarding importance of active life style as the age progresses. None of the subjects in the four agegroups had vigorously active life style. PAL values increased with increasing activity grade [31]. Lifestyle changes that increase the level of physical activity may be advantageous in blunting age-related increase in total and central body fatness [32]. The limitation of the study is that BMR is based on the body weight could produce an error, the prediction equations based on body fat mass or muscle mass needs to be derived to accurately determine BMR and TDEE. Moreover, there could be over or under reporting regarding food intake and physical activity.
4. Conclusion
The results revealed that both diet and physical activity had strong relationship with anthropometric and body composition parameters in women as the age progressed. A diet with higher protein and reduced carbohydrates combined with active lifestyle can sustain the optimum weight without reducing the lean body mass. The presser-
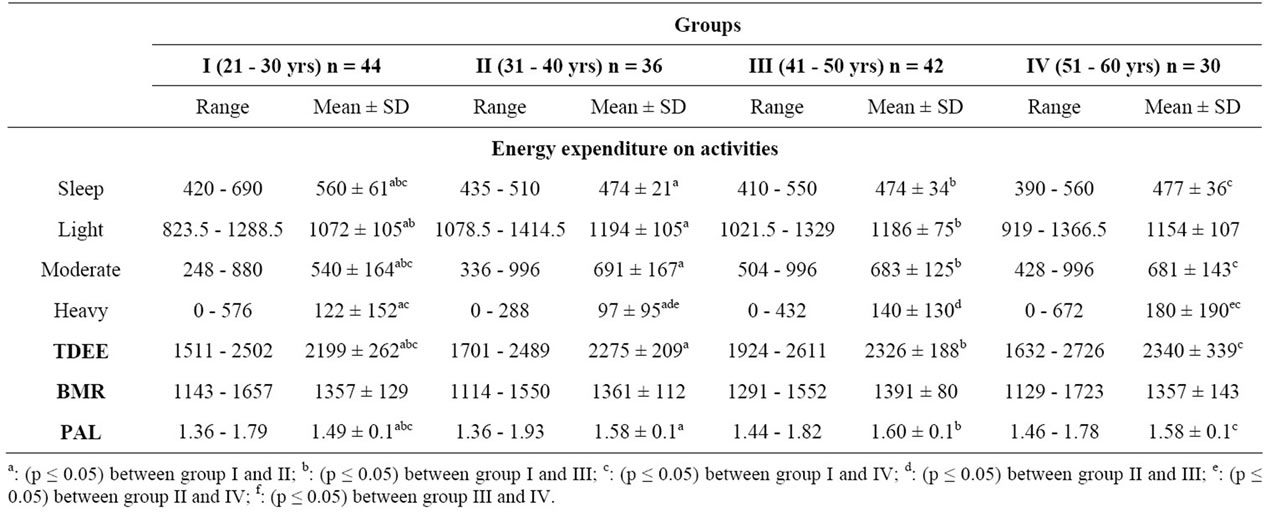
Table 4. Energy expenditure on different activities and total daily energy expenditure (TDEE), basal metabolic rate (BMR) and physical activity level (PAL) of the subjects.
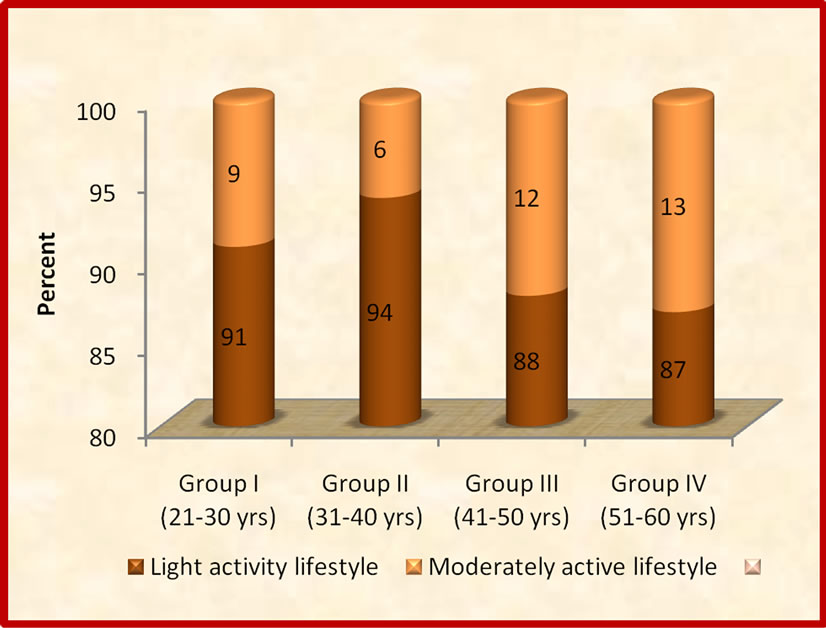
Figure 2. Classification of subjects according to lifestyle in relation to intensity of habitual physical activity.
vation of muscle mass and prevention of sarcopenia can be a useful strategy to increase the functional independence and to decrease the prevalence of chronic diseases among ageing women with sedentary life style.
REFERENCES
- M. Visser, S. B. Kritchevsky and B. H. Goodpaster, “Leg Muscle Mass and Composition in Relation to Lower Extremity Performance in Men and Women Aged 70 to 79 Years: The Health, Aging and Body Composition Stud,” Journal of the American Geriatrics Society, Vol. 50, No. 5, 2002, pp. 897-904. doi:10.1046/j.1532-5415.2002.50217.x
- A. A. Suleiman, O. K. Alboqai, N. Yasein, J. M. El-Qudah, M. F. Bataineh and B. A. Obeidat, “Prevalence of and Factors Associated with Overweight and Obesity among Jordon University Students,” Journal of Biological Sciences, Vol. 9, No. 7, 2009, pp. 738-745. doi:10.3923/jbs.2009.738.745
- I. H. C. F. Menezes, M. B. Neutzling and J. A. A. C. Taddei, “Risk Factors for Overweight and Obesity in Adolescents of a Brazilian University: A Case-Control Study,” Números Disponibles, Vol. 24, No. 1, 2009, pp. 17-24.
- J. D. Stookey, L. Adair, J. Steven and B. M. Popkin, “Patterns of Long Term Change in Body Composition Are Associated with Diet, Activity, Income and Urban Residence among Older Adults in China,” The Journal of Nutrition, Vol. 131, No. 9, 2001, pp. 2433-2440.
- R. Kasliwal, M. Banasal and V. Agarwal, P. Dardon, R. Mehrotia and Garg R, “Brief Report: Metabolic Syndrome and Cardiovascular Risk Factors among the Affluent Asian Indians Living in India,” Metabolic Syndrome Related Disorders, Vol. 2, No. 3, 2004, pp. 169- 171. doi:10.1089/met.2004.2.169
- A. Ramachandran, C. Snehalatha and K. Satyavan, “Metabolic Syndrome in Urban Asian Indian Adults—A Population Study Using Modified ATP III Criteria,” Diabetes Research and Clinical Practice, Vol. 60, No. 3, 2003, pp. 199-204. doi:10.1016/S0168-8227(03)00060-3
- K. L. Donald, C. Peter, C. G. Mary, M. K. Ronald and Q. N. Frank, “Protein in Optimal Health Heart Disease and Type II Diabetes,” The American Journal of Clinical Nutrition, Vol. 87, No. 5, 2008, pp. 1571-75.
- W. O. Song, S. K. Mann, S. Sehgal and P. R. Devi, “Gudaru S, Kakarala M. Nutriguide: Asian Indian Foods,” Nutritional Analysis Computer Programme, Michigan State University, East Lansing, 1992.
- Indian Council of Medical Research, “Nutrient Requirements and Recommended Dietary Allowances for Indians,” National Institute of Nutrition, Hyderabad, 2010.
- FAO/WHO/UNU, “Human Energy Requirements,” Report of a Joint FAO/WHO/UNU Expert Consultation, Rome, 2004.
- D. B. Jelliffe, “The Assessment of Nutritional Status of Community,” WHO, Geneva, 1966.
- Tanita Body Composition Analyzer, “Tanita Body Composition Analyzer—Model: BC-420MA,” Tokyo, 2010.
- J. S. Garrow, “Treat Obesity Seriously, A Clinical Manual,” Chutchill Livingstone, London, 1981.
- Ghafoorunissa and Krishnanurthy, “Fatty Acid Composition and Food Items,” Diet and Heart Diseases, 2000, pp. 32-34.
- G. K. Ursula, M. Katarina, K. Bengt, M. Picard-Kossovsky, G. Gremion and C. Pichard, “Eight-Year Longitudinal Changes in Body Composition in Healthy Swiss Adults,” Journal of the American College of Nutrition, Vol. 25, No. 5, 2006, pp. 493-501 .
- S. Sharan and S. Puttaraj, “Prevalence of Upper Body Obesity as Determinant by Waist Hip Ratio (WHR) and Risk Factors Associated with It,” Indian Journal of Nutrition and Dietetics, Vol. 43, No. 9, 2006, pp. 378-384.
- Y. Schutz, U. U. G. Kyle, C. Pichard, “Fat-Free Mass Index and Fat Mass Index Percentils in Caucasians Aged 18-98 y,” Indian Journal of Nutrition and Dietetics, Vol. 26, No. 7, 2002, pp. 953-960.
- H. Jain and N. Singh, “A Study on Nutritional Status of Women in the Age Group of 25-50 Years Working in a Sedentary Job in Jaipur City,” Indian Journal of Nutrition and Dietetics, Vol. 40, No. 3, 2003, pp. 91-98.
- R. Kuriyan, P. Easwaean and A. V. Kurpad, “Basal Metabolism Rate in Indian Male and Female Subjects of Different Body Mass Index,” Indian Journal of Nutrition and Dietetics, Vol. 42, No. 9, 2005, pp. 392-402.
- A. Joseph, E. H. Poojara, S. Kowsalya and R. S. Devi, “Prevalence and Epidemiological Factor Associated with Obesity among Adults in Ernakulam District, Kerala,” Indian Journal of Nutrition and Dietetics, Vol. 45, No. 10, 2008, pp. 399-409.
- B. Babitha and D. L. Kusuma, “Chronic Energy Deficiency and Obesity among Rural Women—Relationship between BMI and Selected Body Composition Parameters,” Indian Journal of Nutrition and Dietetics, Vol. 46, No. 9, 2009, pp. 386-392.
- P. Nande, M. Hussain and S. Vali, “Influence of Obesity on Body Measurements and Composition in Adult Women Belonging to Minority Community,” Indian Journal of Nutrition and Dietetics, Vol. 47, No. 4, 2009, pp. 137-151.
- R. N. Baumgartner, K. M. Koehler and D. Gallagher, “Epidemiology of Sarcopenia among the Elderly in New Mexico,” American Journal of Epidemiology, Vol. 147, No. 8, 1998, pp. 755-763. doi:10.1093/oxfordjournals.aje.a009520
- B. S. N. Rao, “Nutrient Requirement and Safe Dietary Intake for Indians,” Bulletin of Nutrition Foundation of India, Vol. 31, No. 1, 2010, pp. 1-8.
- U. Goya, “Fat and Fatty Acid Intake by Women from Urban and Semi-Urban Areas,” M.Sc. Thesis, Punjab Agricultural University, Ludhiana, 2003.
- L. Deepti, L. Joyti and J. Parkash, “Diet Related Risk Factors for Osteoporosis in Peri and Post Menopausal Indian Women,” Indian Journal of Nutrition and Dietetics, Vol. 43, No. 8, 2006, pp. 341-349.
- H. Sodhi, “Nutritional Status of Rural and Urban Families in Relation to Household Food Security,” M.Sc. Thesis, Punjab Agricultural University, Ludhiana, 2000.
- C. S. Johnston, L. T. Sherrie and D. Pamela, “High Protein Low Fat Diets Are Effective for Weight Loss and Favourably Alter Biomarkers in Healthy Adults,” Journal of Nutrition, Vol. 134, No. 3, 2004, pp. 586-591.
- D. K. Layman, E. Evans, J. I. Baum, J. Seyler, D. J. Erickon and R. A. Boileau, “Dietary Protein and Exercise Have Additive Effect on Body Composition during Weight Loss in Adult Women,” Journal of Nutrition, Vol. 135, No. 8, 2005, pp. 1903-1910.
- M. Noakes, “The Role of Protein in Weight Management,” Asia Pacific Journal of Clinical Nutrition, Vol. 17, Suppl. 1, 2008, pp. 169-171.
- I. Larsson, L. Lissner, I. Näslund and A. K. Lindroos, “Leisure and Occupational Physical Activity in Relation to Body Mass Index in Men and Women,” Scandinavian Journal of Nutrition, Vol. 48, No. 4, 2004, pp. 165-172. doi:10.1080/11026480410003785
- E. T. Poehlman , M. J. Toth, L. B. Bunyard, A. W. Gardner, K. E. Donaldson, E. Colman E, T. Tekum Fonong and P. A. Ades, “Physiological Predictors of Increasing Total and Central Adiposity in Aging Men and Women,” Archives of Internal Medicine, Vol. 155, No. 22, 1995, pp. 2443-2448. doi:10.1001/archinte.1995.00430220101011