American Journal of Plant Sciences
Vol.08 No.09(2017), Article ID:78500,19 pages
10.4236/ajps.2017.89149
Downregulation of the DST Transcription Factor Using Artificial microRNA to Increase Yield, Salt and Drought Tolerance in Rice
Ar-Rafi Md. Faisal*, Sudip Biswas*, Tasnim Zerin, Tania Rahman, Zeba Islam Seraj#
Plant Biotechnology Laboratory, Department of Biochemistry and Molecular Biology, University of Dhaka, Dhaka, Bangladesh

Copyright © 2017 by authors and Scientific Research Publishing Inc.
This work is licensed under the Creative Commons Attribution International License (CC BY 4.0).
http://creativecommons.org/licenses/by/4.0/


Received: July 26, 2017; Accepted: August 14, 2017; Published: August 17, 2017
ABSTRACT
Abiotic stresses like salinity and drought directly affect plant growth and water availability, resulting in lower yield in rice. So, a combination of stress tolerance along with enhanced grain yield is a major focus of rice breeding. It was reported earlier that loss in function of the drought and salt tolerance (DST) gene results in increase in grain production through downregulating Gn1a/OsCKX2 expression. Moreover, dst mutants also showed enhanced drought and salt tolerance in rice by regulating genes involved in ROS homeostasis. In the present study, we proceeded to test these reports by downregulating DST using artificial microRNA technology in the commercial but salt sensitive, high-yielding, BRRIdhan 28 (BR28). This cultivar was transformed with DST_artificial microRNA (DST_amiRNA) driven by the constitutive CaMV35S promoter using tissue culture independent Agrobacterium mediated in planta transformation. DST_amiRNA transgenic plants were confirmed by artificial microRNA specific PCR. Transformed plants at T0 generation showed vigorous growth with significantly longer panicle length and higher primary branching resulting in higher yield, compared to the wild type (WT) BR28. Semi-quantitative RT PCR confirmed the decrease in DST expression in the BR28 transgenic plants compared to WT. T1 transgenic plants also showed improvement in a number of physiological parameters and greater growth compared to WT after 14 days of 120 mM salt (NaCl) stress at seedling stage. Therefore, DST downregulated transgenic plants showed both higher stress tolerance as well as better yields. Furthermore, stable inheritance of the improved phenotype of the DST_amiRNA transgenics will be tested in advanced generations.
Keywords:
Drought and Salt Tolerance (DST) Transcription Factor, Artificial microRNA Technology, In Planta Transformation, Yield, Stress Tolerance

1. Introduction
Feeding a growing population that is expected to reach roughly 9 billion by the middle of this century is among the major challenges of our time [1] . Modern agriculture has greatly improved food production, but progress towards mitigating the negative effects of climate change has been insufficient [2] . Most worryingly, many of the plants upon which we depend for food production, like rice, are particularly sensitive to environmental stresses like drought and salinity [3] . Drought is one of the most common environmental factors that limit crop productivity, especially in Asia where at least 23 million hectares of rice (20% of the total world rice area) are drought prone [4] . It affects rice at morphological, physiological and molecular levels and thereby affects its yield [5] . Moreover, production of rice is under pressure due to increase in soil salinity stress as more cultivable areas are becoming saline due to added anthropogenic contribution and global warming [6] [7] .
Plant adaptation to environmental stresses such as salinity and drought is dependent on the activation of cascades of molecular networks. As a result, engineering of multiple genes or regulatory genes (such as gene for transcription regulators, like SNAC1, HARDY) instead of a single stress related gene can augment better tolerance to environmental stresses [8] [9] . Nevertheless, stress tolerant transgenic lines generally show some loss in grain yield production under stress [10] . So, development of rice which is simultaneously high yielding as well as stress tolerant is crucial to ensure food security.
Furthermore, agriculture currently uses over 70% of available freshwater [11] . One of the approaches that may be adopted to conserve water in agriculture is the development of plants that use less water yet maintain high yields in conditions of water scarcity. As plants lose over 95% of their water via transpiration through stomata, the engineering of stomatal activity is a promising approach to reduce the water requirement of crops and to enhance productivity under stress conditions [12] . To fulfill all these demands, engineering of transcription factors is expected to be the ideal candidates as they regulate a cascade of downstream molecular targets important for fighting stress [13] [14] [15] .
Among various transcription factors, DST has drawn particular attention because of its role in conferring drought and salinity tolerance as well as increased yield in plants. Mutation in the DST gene enhances grain production through downregulating Gn1a/OsCKX2 expression [16] . Rice Gn1a/OsCKX2 (Grain num- ber 1a/Cytokinin oxidase 2) encodes a cytokinin oxidase that catalyzes the degradation of active cytokinin which positively regulates shoot apical meristem (SAM), a major parameter determining grain yield production [17] [18] [19] . Moreover, loss of DST function increases stomatal closure and reduces stomatal density via regulation of genes involved in ROS (Reactive oxygen species) homeostasis. This in turn leads to enhanced drought and salt tolerance in rice [20] .
So, in the current study, we tried to obtain the combination of stress tolerance as well as increase in yield by targeting a single gene, DST. Therefore, to downregulate DST, we selected the commercial but salt sensitive, early maturing, high-yielding rice, BRRIdhan 28 (BR28) having distinctive plant architecture. Artificial microRNA (amiRNA) technology was adopted to downregulate DST because of its exquisite specificity, uniqueness and effectiveness compared to other gene silencing approaches like RNA interference, RNA silencing, mutation, etc. [21] . Like endogenous micro RNA, amiRNA also bind to the DST transcript as a result inhibits DST transcription and hence downregulate its expression. Moreover, it is easy to optimize amiRNA sequences for targeting specific gene expression with minimal off-targets [22] . This technology has already been successfully used in downregulating genes in different plants [23] . However quantitative measures of the level of enhancement in tolerance as well as gain in yield are missing from previous publications. For introducing DST_artificial microRNA (DST_amiRNA) into BR28, a tissue culture-independent Agrobacterium-mediated in planta transformation was used because BR28 belongs to indica sub-species and is recalcitrant to tissue culture [24] . So, the objective of this study was to determine the level of tolerance achieved concomitantly with the amount of grain yield production by downregulating DST.
2. Materials and Methods
2.1. Plant Material
BR28 documented as BRRIdhan 28 was produced by Bangladesh Rice Research Institute (BRRI) in 1994. It is a commercial, high yielding, salt sensitive variety derived from the crossing of IR28 (from IRRI) and Purbachi. This early Boro (winter season) variety is extremely popular all around Bangladesh due to its high-yielding characteristics. This variety is cultivated in relatively high ground and suitable for flood prone areas due to its early harvesting (May) [25] .
2.2. Construction of DST_amiRNA for Downregulating DST Gene
For designing an amiRNA specific for the DST gene, WMD3 (Web MicroRNA Designer 3, website with appropriate software) was used to generate 21 nucleotides of mature amiRNA sequences that resemble natural miRNAs while minimizing possible off-target effects to other transcripts. At first, the target gene sequence (DST) was incorporated in the WMD3 target search tool. A list of probable amiRNA sequences was provided by WMD3 against the particular target gene of interest. To facilitate the selection of amiRNA, specific hybridization energy (−35 and −40 kcal/mole) and a minimal target annealing site was chosen. WMD3 primer designer tool was then used to generate oligos for synthesizing the amiRNA. Four different oligos for each gene were suggested by the program. For amplifying full length DST_amiRNA, overlapping PCR was set up using these four different oligos (amiRNA-I, amiRNA-II, amiRNA-III, amiRNA-IV, amiRNA_full_F, amiRNA_full_R; Table 1, Figure 1) with the plasmid, pNW55. pNW55 was the template containing Osa-MIR528 precursor backbone sequence of Oryza sativa (Osa-MIR528) (Addgene, Cambridge, UK). The DST specific amiRNA and its complementary (amiRNA*) sequences (with AflII cutting site) was introduced into pNW55 by site-directed overlapping PCR amplification replacing the Osa-MIR528 amiRNA and its complementary (amiRNA*) sequence of Oryza sativa (Figure 1(A)). Overlapping PCR analyses were carried out in a 25 μl reaction mixture containing 10 ng of pNW55 vector, 100 μM of each dNTP, 2.4 ng each of primers, 1 unit of Taq DNA polymerase (Invitrogen, USA), 1.5 mM MgCl2, DMSO 2.4%, and 1 × PCR Buffer-MgCl2 (Invitrogen, USA). The reaction was performed in a thermocycler (GeneAtlas of Astec) at 95˚C for 2 min followed by 35 cycles of 30 sec denaturation at 95˚C, 30 sec annealing at 52˚C and 40 sec extension at 72˚C, then a final extension of 7 min at 72˚C. Then a fusion PCR was performed to amplify full length of DST_amiRNA along with sequences for restriction cutting sites at the 5ʹ and the 3ʹ ends (Figure 1(B) and Figure 1(C)). Fusion PCR condition was similar to the condition of overlapping PCR.
2.3. Cloning DST_amiRNA into Destination Vector pCAMBIA1305.2 and Transformed into E. coli and Agrobacterium
Both the insert (DST_amiRNA) and the destination vector (pCAMBIA1305.2) were digested with SpeI and AflII restriction enzymes and extracted from the gel (Figure 1(D)). Ligation reaction was done with the ratio 5:1 (vector: insert) at 16˚C overnightand the mix transformed into E. coli by heat shock method following the protocol by Sambrook et al. (1989) [26] . Specifically a 1893 bp size, GUSPlusTM (β-glucuronidase) sequence was removed from pCAMBIA1305.2 vector with SpeI and AflII and a 296 bp size DST_amiRNA backbone was ligated in its place producing pCAMBIA1305.2_DST_amiRNA (pDST_amiRNA) vector (Figure 1(E)). Positive clones were first screened by PCR using DST_amiRNA specific primers and then by restriction digestion with SpeI and AflII restriction enzymes (NEB, Ipswich, MA, USA). The insert was also confirmed by sequencing by sending the plasmid to 1st Base, Malaysia. Finally, pDST_amiRNA construct was transformed into Agrobacterium tumefaciens (LBA4404 strain) by electroporation using standard protocols [26] . Positive clones were selected based on PCR reactions with DST_amiRNA specific primers.
2.4. Transformation of the Construct into Rice Varieties
Transformed Agrobacterium strain (LBA4404) containing pDST_amiRNA construct was cultured in solid YM media containing kanamycin (20 mg/l) antibiotic and prepared for plant transformation following the standard protocol discussed in Parvin et al. (2015) [27] . According to the protocol, densely grown bacterial cells were inoculated into liquid YM medium (Yeast extract mannitol
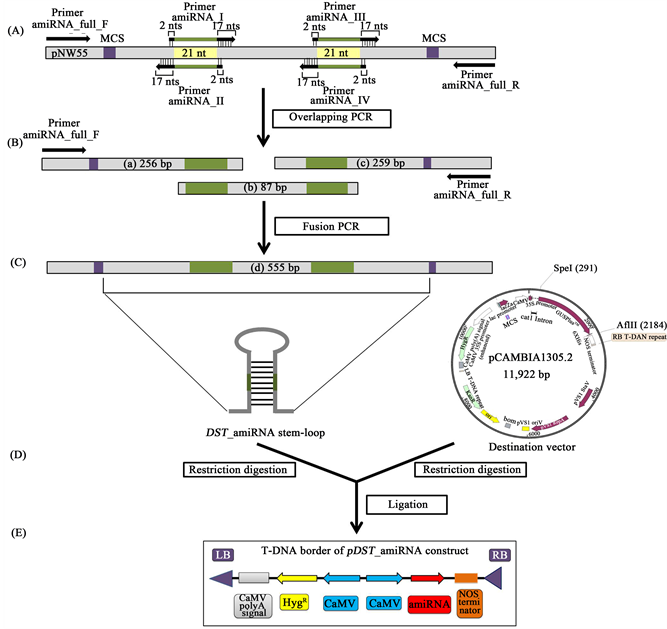
Figure 1. Schematic representation of the generation of the pDST_amiRNA construct. (A) Illustration of the template plasmid, pNW55 with oligonucleotide binding sites indicated; (B)
broth) [28] and incubated at 28˚C overnight, then centrifuged and re-suspended into bacterial re-suspension medium (Sucrose, glucose, AB buffer and AB salt). For improving the transformation efficiency acetosyringone was added to both liquid YM medium and bacterial re-suspension medium. Finally, at OD600 bacterial density was measured and kept fixed at 0.6. For Agrobacterium inoculation two-day-old germinated BR28 seeds were used. During the transformation events, each time embryonic apical meristem of approximately 50 germinated seeds of BR28 were infected with A. tumefaciens containing pDST_amiRNA construct. Infected seeds were transferred onto petri dishes containing wet filter paper followed by incubated in the dark at 28˚C for 6 - 7 days. Seedlings were then treated with carbenicillin solution (250 mg/l) for 1 hour to kill and remove the remnants of Agrobacterium. After that, seedlings were washed well with distilled deionized H2O and transferred to new petri dishes containing wet filter paper and kept in light for 16 hours and in dark for 8 hours at 28˚C. They were subsequently transferred to hydroponic solution [29] when they appeared green and healthy. After 2 - 3 days, the hydroponic pots were transferred to the net house [30] . Matured seedlings (18 - 21 days old) were transferred to soil and allowed to pollinate naturally to set seeds (T1).
2.5. DNA Isolation and PCR Analysis
Genomic DNA was isolated from the upper leaves (flag leaves) of transformants which gave positive result in leaf disk senescence (LDS) assay. Leaves were cut finely, crushed to powder in liquid nitrogen and DNA was isolated using CTAB (Cetyltrimethylammonium bromide) method following the protocol mentioned by Doyle (1991) [31] . PCR was performed with different sets of DST_amiRNA and CaMV35S specific primers to confirm the pDST_amiRNA construct as well as the DST_amiRNA transformed BR28 at T0 generation. PCR analyses were carried out in a 25 μl reaction mixture containing 100 ng of plant DNA, 100 μM of each dNTP, 2.4 ng each of primers, 1 unit of Taq DNA polymerase (Invitrogen, USA), 1.5 mM MgCl2, DMSO 2.4%, and 1× PCR Buffer-MgCl2 (Invitrogen, USA). The reaction was performed in a thermocycler (GeneAtlas of Astec) at 95˚C for 5 min followed by 35 cycles of 1 min denaturation at 95˚C, 1 min annealing at the annealing temperature depending on specific primer and 1.5 min extension at 72˚C, then a final extension of 10 min at 72˚C.
2.6. RNA Isolation and Semi-Quantitative RT-PCR Analysis
Total RNA was extracted from the shoot of matured T1 BR28 DST_amiRNA transgenics and WT BR28 rice under both 0 and 100 mM NaCl stress (24 hours) using Trizol reagent (Ambion, Invitrogen) following the manufacturer’s protocol. First-strand cDNA was synthesized from 1.5 µg of total RNA using the Invitrogen Superscript III reverse transcription (RT)-PCR following the manufacturer’s protocol (Invitrogen, USA). For the optimization of cDNA for both WT and transgenic lines, PCR reactions were conducted using primers specific for house-keeping gene, eEF-1α (eukaryotic elongation factor-1α). After normalization, same level of eEF-1α expression was found in both the transformed and the WT. Then, semi-quantitative RT-PCR was done using DST specific primers with same concentration of cDNAs (normalized with respect to the concentration level of eEF-1α) to see the expression of DST (Table 1). The 1D-Multi tool of Alpha Ease FC imaging system and R programming language were used for the graphical representation of the intensity of the bands in the gel.

Table 1. Description of the primers used in this study.
2.7. Leaf Disk Senescence (LDS) Assay
Leaf squares of ~1.0-cm dimension were excised from healthy and fully expanded rice flag leaves of similar age from both the transgenic lines and WT plants. The disks were floated in a 20 ml solution of 150 mM NaCl for T0 transgenic lines for 4 days at 25˚C. The analysis was carried out with three biological replicates in three independent experiments [10] .
2.8. Salt Stress Screening at Seedling Stage
Seedling stage phenotypic screening of WT BR28 and DST_amiRNA transformed plants at T1 generation was done under salt stress condition by the method described by Amin et al. (2012) [32] . 60 mM salt (NaCl) stress was applied to the fourteen days old T1 seedlings with a gradual increment of 20 mM per day to 120 mM salt stress. Then the seedlings were subjected to 120 mM salt for 14 days. After that, the level of salinity tolerance was evaluated based on various parameters like change in root length, shoot length, electrolyte leakage, chlorophyll content in the stress condition compared to the control.
2.9. Measurement of Relative Electrolyte Leakage
0.1 g weighed plant leaf from the seedlings of both WT and transgenics were placed in a falcon tube containing 25 ml deionized water and kept in shaker for 2 hours. The initial electrical conductivity (C1) of the solution was measured using a conductivity detector. Then the leaf segments in deionized water were autoclaved. After being thoroughly cooled to room temperature, the conductivities (C2) of the resulting solutions were determined. The values of C1 to C2 (C1/C2) were calculated and used to evaluate the relative electrolyte leakage [10] . Percentage increase in relative electrolyte leakage was determined using following formula:

2.10. Measurement of the Chlorophyll Concentration
0.1 g weighed plant leaf from the seedlings of both WT and transgenics were kept in a bottle containing 12 ml of 80% acetone for 48 hours in dark. Absorbance of leaf tissues extract was measured at wavelength 663 and 645 nm after 48 hours [10] . The chlorophyll content was calculated using the following equation:

where,
A = observed absorbance; C = chlorophyll concentration (mg/ml); d = distance of the light path (= 1 cm); E = a proportionality constant (extinction Co-efficient) (=36 ml/cm).
Reduction of chlorophyll content was determined using following formula:

2.11. Measurement of Hydrogen Peroxide (H2O2) Level
0.3 g weighed plant leaf from the seedlings of both WT and transgenics were ground to a fine powder in the presence of liquid nitrogen and 5 ml of 0.1% (w/v) TCA was added to it. The homogenate was centrifuged at 12,000 g for 15 min at room temperature. Then 3 ml of supernatant was collected in a fresh screw capped tube. 0.5 ml of 1 M potassium phosphate buffer (pH 7.0) and 1 ml of potassium iodide (1 M) were added in the tube. Then the absorbance of the mixture was taken at 390 nm using 1 ml of 0.1% (w/v) TCA and 1 ml of potassium iodide in the absence of leaf extract as the blank control [33] .
The amount of H2O2 was calculated using the equation:

Percentage increase in hydrogen peroxide level was determined using following formula:

2.12. Measurement of Root Relative Water Content
Roots were detached and weighed immediately to record the fresh weight (FW), followed by dipping them in distilled water for 24 hours. The roots were then blotted dry, weighed to record the turgid weight (TW), and subjected to oven drying at 70˚C for 24 hours to determine the dry weight (DW) [33] . The root relative water content was calculated using the equation:

Percentage increase in root relative water content was determined using following formula:

2.13. Agronomic Trait Analysis
Agronomic traits like, total tiller number, leaf width, plant height were measured when the plants became mature. After harvesting, parameters like primary branching number, panicle lengths, number of filled grains and numbers of unfilled grains were measured.
2.14. Data Analysis
All statistical analyses were done in R Studio version 1.0.143 and R programming language version 2.14.1. The ANOVA and the Duncan test were performed to compare significant differences (P < 0.05) between the transgenic lines and the WT.
3. Results and Discussion
3.1. Construction and Cloning of DST_amiRNA for Downregulating DST Gene
Using oligos for synthesizing the full length DST_amiRNA (555 bp), first three PCR reactions were performed to amplify three overlapping fragments (256 bp, 87 bp and 259 bp) (Figure 2(A)). Then these individual fragments were gel purified and another fusion PCR was performed to join the three fragments (Figure 2(B)). And finally one PCR was done where only reverse primer at the 5' end was designed with AflII cutting site (Figure 2(C)) and the desired size band (555 bp) was extracted from the gel. Then, the extracted DST_amiRNA and the pCAMBIA1305.2, destination vector were digested using SpeI and AflII restriction enzymes. The pDST_amiRNA construct was developed through the ligation reaction and transformed into E. coli by heat shock method.
3.2. Confirmation of pDST_amiRNA Vector into E. coli
After transformation, the positive bands (211 bp for amiRNA and 809 bp for hpt gene) were confirmed through lysate PCR of different colonies using DST_ amiRNA and hpt specific primers (Figure 2(D) and Figure 2(E); Table 1). Then, plasmids were isolated from lysate positive clones; desired band for DST_ amiRNA plasmid was also found (Figure 2(F)). This positive pDST_amiRNA plasmid was further confirmed by restriction digestion with SpeI and AflII restriction enzymes (Figure 2(G)). By digestion with SpeI and AflII restriction enzymes the expected product size of 296 bp and 10,029 bp were found which confirmed the presence of DST_amiRNA in the pCAMBIA1305.2 expression vector. Finally, the insert was also confirmed by sequencing.
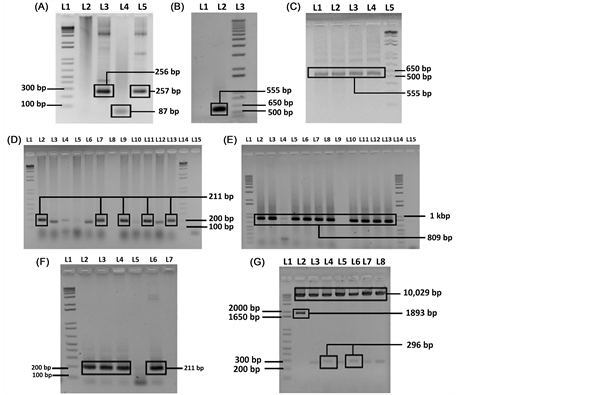
Figure 2. Cloning of DST_amiRNA into pCAMBIA1305.2 and transformation into E. coli. (A) Amplification of the three fragments of DST_amiRNA from pNW55 vector; L1:1kb+ ladder, L2: negative control, L3: fragment-A with desired product size 256 bp using amiRNA_full_F and amiRNA-II (Table 1), L4: fragment-B with desired product size 87 bp using amiRNA-I and amiRNA-IV (Table 1), L5: fragment-C with desired product size 259 bp using amiRNA-III and amiRNA_full_R (Table 1); (B) Amplification of full length of DST_amiRNA; L1: negative control, L2: full length of DST_amiRNA with desired product size 555 bp using amiRNA_full_F and amiRNA_full_R (Table 1), L3:1 kb + ladder; (C) Amplification of full length of DST_amiRNA with restriction cutting site; L1 - L4: full length of DST_amiRNA with restriction cutting site using amiRNA_full_F and amiRNA_AflII_R (Table 1), L5:1 kb + ladder; (D) Confirmation of positive colony containing pDST_amiRNA by lysate PCR after transformation into E. coli using DST_ amiRNA specific primers; L1 and L14: 1 kb + ladder, L8 and L15: negative control, L2, L7, L9, L11 and L13: positive colony containing pDST_amiRNA; (E) Confirmation of positive colony containing pDST_amiRNA by lysate PCR with hpt specific primers (Table 1) after transformation into E. coli; L1 and L14: 1 kb + ladder, L9 and L15: negative control, L2 - L8 and L10 - L13: positive colony containing pDST_amiRNA. (F) Confirmation of positive pDST_amiRNA plasmid after isolation from lysate positive colonies. L1: 1 kb + ladder; L2 - L4: positive pDST_amiRNA construct with desired band size 211 bp, L5 and L7: negative control, L6: positive control; (G) Confirmation of positive pDST_amiRNA plasmid by restriction digestion with SpeI and AflII restriction enzyme. L1: 1 kb + DNA ladder, L2: blank vector (pCAMBIA1305.2), L4, L6: positive pDST_amiRNA plasmid with desired band size of 296 bp and 10,029 bp.
3.3. Transformation and Confirmation of pDST_amiRNA Vector into Agrobacterium
Finally, the vector pCAMBIA1305.2 containing DST_amiRNA was electroporated into Agrobacterium and positive transformed Agrobacterium was confirmed by PCR using two sets of primers (Set 1: amiRNA_full_F and amiRNA_AflII_R; Set 2: CaMV35S_F and amiRNA_R2; Table 1). Desired band size of 211 bp and 1.1kbp were found (Figure 3).
3.4. Agrobacterium Mediated Transformation and Selection of Transformed Plants
In this study, germinating seeds of BR28 were subjected to in planta transformation where they were directly infected with Agrobacterium containing the pDST_amiRNA construct. Then they were allowed to grow and set T1 seeds as described in methods. When the plants were matured and grains were set, leaf disk senescence (LDS) assay on flag leaves was done.
3.5. Leaf Disk Senescence (LDS) Assay at T0 Generation
Positive transformed DST_amiRNA BR28 was identified by leaf disk senescence (LDS) assay under 150 mM salt stress. As downregulation of DST results in gain in salt tolerance characteristics, the transformed plants should perform better under salt stress. During the assay, flag leaf pieces of non-inoculated BR28 (control) showed dark brown stripes and necrosis after 4 days (Figure 4(A)) whereas
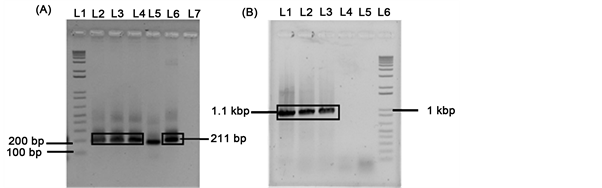
Figure 3. PCR confirmation of pDST_amiRNA plasmid into Agrobacterium. (A) L1: 1 kb + DNA ladder, L2 - L4: pDST_amiRNA plasmid, L6: positive control, L7: negative control; (B) L1 and L2: pDST_amiRNA plasmid, L3: positive control; L4, L5: negative control; L6: 1 kb + DNA ladder.
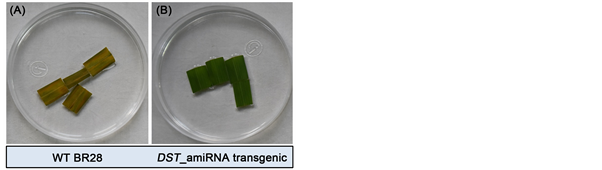
Figure 4. Leaf disk senescence assay of flag leaves from T0 transformants. Transformed plant’s leaf showed healthier and greener appearance whereas WT leaves showed necrosis and dark-brown stripes after 4 days in 150 mM NaCl solution.
flag leaf of 12 out of 41 plants of infected BR28 using DST_amiRNA construct remained largely green and healthy (Figure 4(B)). These plants were assumed to be putatively transformed and used for further analysis.
3.6. Transformation Efficiency of the in Planta Method
The transformation efficiency for indica rice varieties as reported earlier was about 6.0% [24] . Due to some modifications of this published method as discussed in Parvin et al. (2015) [27] our transformation efficiency was enhanced from the reported 6 to 29% (Table 2).
3.7. Selection of the Transgenic Lines through Molecular Analysis
For confirmation of the T0 transformants at molecular level, DNA was isolated from the plants that showed better result in LDS assay (putatively transformed plants) and PCR analysis was done for the presence of the DST_amiRNA. The desired band (430 bp) for DST_amiRNA specific primer was found only in the transformed plants that confirmed the presence of desired transgene (Figure 5).
3.8. Agronomic Trait Analysis at T0 Generation
In rice breeding programs, enhanced grain yield is a major focus which is determined by various components. Among them, grain number per panicle is highly variable and contributes the most to yield formation [16] .
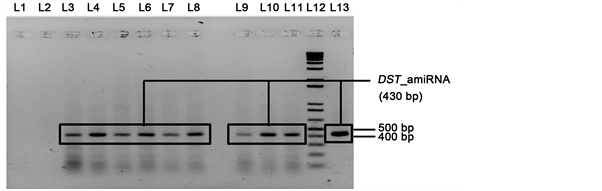
Figure 5. PCR analysis for the detection of DST_amiRNA at T0 BR28 transformed plants. L1: negative control; L2: WT BR28; L3 - L11: transformed BR28; L12: 1 kb + DNA ladder; L13: positive control. The transformed samples showed the correct band size of 430 bp.
Table 2. Transformation efficiency of in planta transformation at T0 generation (based on LDS assay).
Results from an average of three independent experiments.
In the study, BR28 transformed plants showed significantly strong phenology with broader leaves, greater height, higher total tiller number, higher primary branching, and higher spikelet numbers and hence higher yield, compared to WT (Figure 6(A)). The number of filled grains per panicle was also significantly increased in the transformed plants (Figure 6(B)). Among all the transformed plants, four plants (P2, P6, P11 and P17) showed significantly higher panicle length as well as higher primary branching and hence higher yield compared to the WT BR28 (Figure 7). Among these four plants, average grain yield production in P11 plant was increased more than 2.5 folds compared to the average grain yield production of WT (0.65 g yield per panicle in P11 compared to 0.24 g in WT BR28). So, BR28 transformed plants showed significantly higher yield compared to the WT and demonstrated the positive effect of downregulation of the DST on increasing yield parameters.
3.9. Effect of Salt Stress at Seedling Stage
Transformed lines at T1 generation that showed positive results in leaf disk senescence (LDS) assay, PCR analysis and better agronomic traits were selected for the salt stress screening at the seedling stage. Among the selected eight lines, three lines (line P11-1, P11-3 and P6-2) performed extremely well with strong vigor along with significantly higher percentage increase in root length and low-
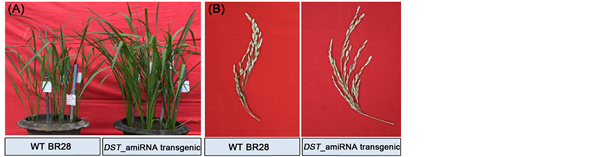
Figure 6. Pictorial view of BR28 transformed plant (A) and their panicle (B) along with the WT (Non-stressed). Transformed plants show better phenology with significantly higher filled grains and primary branches compared to the WT.
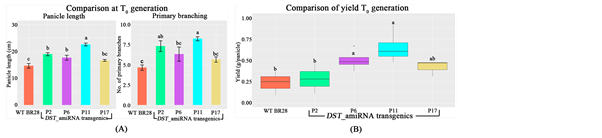
Figure 7. Comparison of agronomic traits of BR28 transgenics with the WT at T0 generation. (A) Comparison of panicle length and primary branches of the transformed plants with WT; (B) Comparison of yield of the transformed plants with WT. Each bar re- presents the mean ± SE (n = 5). Different letters in each graph ((a)-(c)) indicate significant differences (P < 0.05, ANOVA and Duncan test).
er percentage reduction in shoot length even after 14 days of 120 mM NaCl treatment whereas non-transformed WT plants turned yellow and then brown (Figure 8).
After 14 days of 120 mM salt stress, it was observed that the transgenic lines showed better performance with significantly lower electrolyte leakage, lower reduction of chlorophyll content, higher increase in root relative water content and in hydrogen peroxide (H2O2) level indicating the significantly higher stress tolerance of transgenics compared to the WT (Figure 9).
However, hydrogen peroxide level at the seedling stage showed that transgenic line P11-1 contained significantly higher level of H2O2 compared to WT in control condition (Figure 10). Again, higher accumulation of H2O2 results in increased stomatal closure that plays crucial role in preventing water loss and maintaining water content and hence provide drought tolerance in plants [20] . As DST_amiRNA transgenic showed higher level of H2O2 in control condition, therefore, the result of this experiment is a proof of concept that DST_amiRNA transgenics would provide drought tolerance as well.
So, in all the tests performed to compare the stress tolerance in transgenic lines with respect to WT, transgenic lines showed significant better performance validating the gain in the salt tolerance characteristics in DST_amiRNA transgenics.
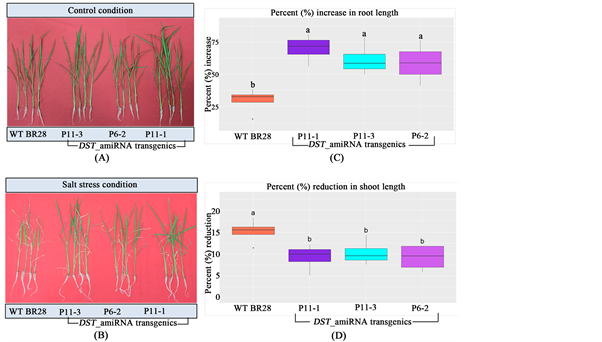
Figure 8. Seedling stage salt stress screening at T1 generation. (A) in control condition (in hydroponic solution without salt treatment); and (B) after 14 days of 120 mM salt (NaCl) stress in hydroponics. The transgenic lines performed better compared to WT with significantly higher percentage increase in root length (C) and lower percentage reduction in shoot length (D) even after 14 days of 120 mM NaCl treatment. Different letters in each graph ((a) and (b)) indicate significant differences (P < 0.05, ANOVA and Duncan test).
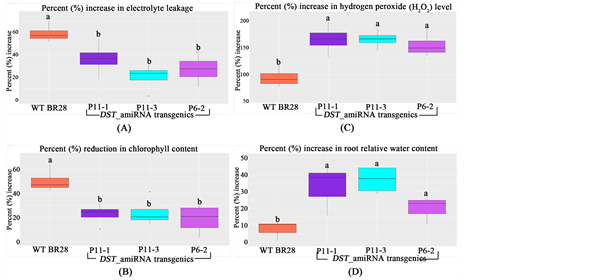
Figure 9. (A) Percentage increase in electrolyte leakage; (B) Percentage reduction in chlorophyll content; (C) Percentage increase in hydrogen peroxide (H2O2) level and (D) root relative water content of transgenic lines and WT BR28 after 14 days of 120 mM salt (NaCl) stress. In all the cases the transgenic lines showed significantly better result compared to the WT. Different letters in each graph ((a) and (b)) indicate significant differences (P < 0.05, ANOVA and Duncan test).
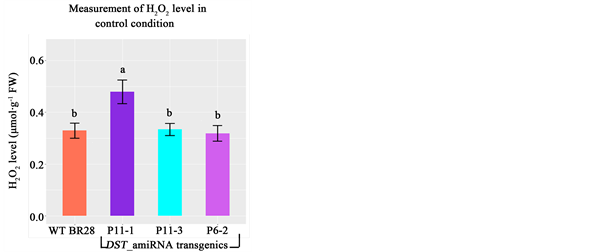
Figure 10. Measurement of hydrogen peroxide (H2O2) level at the seedling stage in control condition at T1. Line P11-1 showed significantly higher H2O2 level compared to WT BR28. Different letters in each graph ((a) and (b)) indicate significant differences (P < 0.05, ANOVA and Duncan test).
3.10. Expression Analysis of DST Gene in T1 Plants by Semi-Quantitative RT-PCR
Based on the salt stress screening, agronomic trait analysis and other physiological screening experiments, we selected best two lines (line P11-1 and line P6-2) to check the expression level of DST gene and to confirm that these stress tolerance and higher grain yield production characters were obtained due to downregulation of DST. Semi quantitative RT (reverse transcriptase) PCR was used to compare the expression of DST gene of T1 transformants of BR28 with WT plants under both control and stress condition (100 mM salt stress). For the optimization of cDNA for both WT and the selected lines (P11-1, P6-2), PCR reactions were conducted using primers specific for house-keeping gene, eEF-1α (eukaryotic elongation factor −1α). After normalization, both the transformed lines (P11-1, P6-2) and the WT showed almost same level of expression in case of eEF-1α in both control and stress condition (Figure 11(A) and Figure 11(C)). Semi-quantitative RT (reverse transcriptase) PCR at 26 cycles was done using DST specific primers with same concentration of cDNAs (normalized with respect to the concentration level of eEF-1α). The desired size of 210 bp bands was found (Figure 11(B) and Figure 11(D)). Intensity of the bands revealed that both the transformed lines (P11-1, P6-2) showed a lower level of expression of DST gene in both the conditions (control and salt stress) compared to the WT indicating the constitutive downregulation of the DST. Therefore, it can be clearly demonstrated that DST_amiRNA successfully and constitutively downregulated the DST gene. Concomitantly it was also shown that the stress toler- ance characteristics and increase in grain yield production of the transgenic lines occurred due to the downregulation of the DST.
4. Conclusion
Most of the studies involving the ectopic insertion of transgenes show some reduction in yield in abiotic stress conditions [10] . Previous studies on DST sepa- rately showed abiotic stress tolerance and enhanced yield in rice [16] [20] . In our
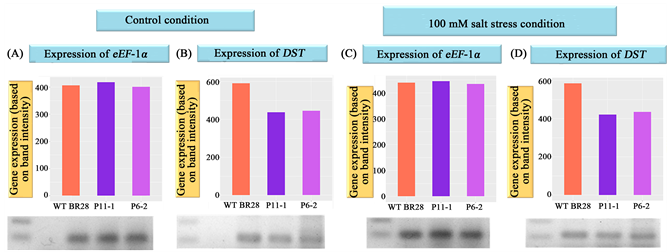
Figure 11. Expression analysis of DST gene in control and salt stress condition, in both wild type and T1 BR28 transformed plants by semiquantitative RT (reverse transcriptase) PCR. PCR amplification of housekeeping gene eEF-1α (A) in control condition and (C) in salt stress condition, in wild type and T1 transformed BR28. PCR amplification of DST gene (B) in control condition and (D) in salt stress condition, in wild type and T1 transformed BR28 (26 cycles). In ((A) and (B)), L1: 1 Kb + ladder, L3: WT BR28; L4: line P11-1; L5: line P6-2. In ((C) and (D)), L1: 1 Kb + ladder, L2: WT BR28; L3: line P11-1; L4: line P6-2. Results showed that the expression level was almost same in both WT and two transgenic lines in case of eEF-1α and lower level of expression of DST gene were found in both the transgenic lines (in both the conditions) compared to WT. 1D-Multi tool of Alpha Ease FC imaging system and R programming language were used for the graphical representation of the intensity of the bands in the gel.
studies, by downregulating DST using amiRNA we showed the combination of simultaneous stress tolerance and improved yield in rice. Moreover, results obtained from the studies at T0 generation are immensely promising. So, we will now need to examine whether there is any loss in yield in the lines shown to be stress tolerant above after subjecting them to stress at the reproductive stage and analyzing the any gains in yield compared to WT.
Acknowledgements
This study received funds from The World Academy of Science (TWAS) and The Bangladesh chapter of USDA (BAS-USDA; BAS: Bangladesh Academy of Sciences, USDA: United States Development of Agriculture). Thanks to Raju Ahmed and Rabin Sarkar for taking care of the rice plants. Special thanks goes to center for bioinformatics learning advancement and systematics training (cBLAST), University of Dhaka and G.M. Nurnabi Azad Jewel for their kind help usage of the R programming language.
Cite this paper
Faisal, A.M., Biswas, S., Zerin, T., Rahman, T. and Seraj, Z.I. (2017) Downregulation of the DST Trans- cription Factor Using Artificial microRNA to Increase Yield, Salt and Drought Tolerance in Rice. American Journal of Plant Sciences, 8, 2219-2237. https://doi.org/10.4236/ajps.2017.89149
References
- 1. Godfray, H.C.J., Beddington, J.R., Crute, I.R., Haddad, L., Lawrence, D., Muir, J.F., Pretty, J., Robinson, S., Thomas, S.M. and Toulmin, C. (2010) Food Security: The Challenge of Feeding 9 Billion People. Science, 327, 812-818.
https://doi.org/10.1126/science.1185383 - 2. Michael, C. and David, T. (2017) Comparative Analysis of Environmental Impacts of Agricultural Production Systems, Agricultural Input Efficiency, and Food Choice. Environmental Research Letters, 12, Article ID: 064016.
https://doi.org/10.1007/s11027-016-9705-0 - 3. Lobell, D.B., Roberts, M.J., Schlenker, W., Braun, N., Little, B.B., Rejesus, R.M. and Hammer, G.L. (2014) Greater Sensitivity to Drought Accompanies Maize Yield Increase in the US Midwest. Science, 344, 516-519.
https://doi.org/10.1126/science.1251423 - 4. Wu, F., Sheng, P., Tan, J., Chen, X., Lu, G., Ma, W., Heng, Y., Lin, Q., Zhu, S. and Wang, J. (2014) Plasma Membrane Receptor-Like Kinase Leaf Panicle 2 Acts Downstream of the Drought and Salt Tolerance Transcription Factor to Regulate Drought Sensitivity in Rice. Journal of Experimental Botany, 66, 271-281.
https://doi.org/10.1093/jxb/eru417 - 5. Mottaleb, K.A., Rejesus, R.M., Murty, M., Mohanty, S. and Li, T. (2017) Benefits of the Development and Dissemination of Climate-Smart Rice: Ex Ante Impact Assessment of Drought-Tolerant Rice in South Asia. Mitigation and Adaptation Strategies for Global Change, 22, 879-901.
https://doi.org/10.1007/s11027-016-9705-0 - 6. Razzaque, S., Haque, T., Elias, S.M., Rahman, M.S., Biswas, S., Schwartz, S., Ismail, A.M., Walia, H., Juenger, T.E. and Seraj, Z.I. (2017) Reproductive Stage Physiological and Transcriptional Responses to Salinity Stress in Reciprocal Populations Derived from Tolerant (Horkuch) and Susceptible (IR29) Rice. Scientific Reports, 7, 14.
https://doi.org/10.1038/srep46138 - 7. Negrão, S., Schmöckel, S. and Tester, M. (2017) Evaluating Physiological Responses of Plants to Salinity Stress. Annals of Botany, 119, 1-11.
https://doi.org/10.1093/aob/mcw191 - 8. Karaba, A., Dixit, S., Greco, R., Aharoni, A., Trijatmiko, K.R., Marsch-Martinez, N., Krishnan, A., Nataraja, K.N., Udayakumar, M. and Pereira, A. (2007) Improvement of Water Use Efficiency in Rice by Expression of HARDY, an Arabidopsis Drought and Salt Tolerance Gene. Proceedings of the National Academy of Sciences, 104, 15270-15275.
https://doi.org/10.1073/pnas.0707294104 - 9. Hu, H., Dai, M., Yao, J., Xiao, B., Li, X., Zhang, Q. and Xiong, L. (2006) Overexpressing a NAM, ATAF, and CUC (NAC) Transcription Factor Enhances Drought Resistance and Salt Tolerance in Rice. Proceedings of the National Academy of Sciences, 103, 12987-12992.
https://doi.org/10.1073/pnas.0604882103 - 10. Amin, U., Biswas, S., Elias, S.M., Razzaque, S., Haque, T., Malo, R. and Seraj, Z.I. (2016) Enhanced Salt Tolerance Conferred by the Complete 2.3 kb cDNA of the Rice Vacuolar Na+/H+ Antiporter Gene Compared to 1.9 kb Coding Region with 5’ UTR in Transgenic Lines of Rice. Frontiers in Plant Science, 7.
https://doi.org/10.3389/fpls.2016.00014 - 11. Water, F. (2009) Water at a Glance: The Relationship between Water, Agriculture, Food Security and Poverty. Water Development and Management Unit, Food and Agriculture Organization of the United Nations, Rome.
- 12. Cominelli, E., Galbiati, M. and Tonelli, C. (2010) Transcription Factors Controlling Stomatal Movements and Drought Tolerance. Transcription, 1, 41-45.
https://doi.org/10.4161/trns.1.1.12064 - 13. Stockinger, E.J., Gilmour, S.J. and Thomashow, M.F. (1997) Arabidopsis Thaliana CBF1 Encodes an AP2 Domain-Containing Transcriptional Activator That Binds to the C-Repeat/DRE, a Cis-Acting DNA Regulatory Element That Stimulates Transcription in Response to Low Temperature and Water Deficit. Proceedings of the National Academy of Sciences, 94, 1035-1040.
https://doi.org/10.1073/pnas.94.3.1035 - 14. Yamaguchi-Shinozaki, K. and Shinozaki, K. (2006) Transcriptional Regulatory Networks in Cellular Responses and Tolerance to Dehydration and Cold Stresses. Annual Review of Plant Biology, 57, 781-803.
https://doi.org/10.1146/annurev.arplant.57.032905.105444 - 15. Haake, V., Cook, D., Riechmann, J., Pineda, O., Thomashow, M.F. and Zhang, J.Z. (2002) Transcription Factor CBF4 Is a Regulator of Drought Adaptation in Arabidopsis. Plant Physiology, 130, 639-648.
https://doi.org/10.1104/pp.006478 - 16. Li, S., Zhao, B., Yuan, D., Duan, M., Qian, Q., Tang, L., Wang, B., Liu, X., Zhang, J. and Wang, J. (2013) Rice Zinc Finger Protein DST Enhances Grain Production Through Controlling Gn1a/OsCKX2 Expression. Proceedings of the National Academy of Sciences, 110, 3167-3172.
https://doi.org/10.1073/pnas.1300359110 - 17. Riefler, M., Novak, O., Strnad, M. and Schmülling, T. (2006) Arabidopsis Cytokinin Receptor Mutants Reveal Functions in Shoot Growth, Leaf Senescence, Seed Size, Germination, Root Development, and Cytokinin Metabolism. The Plant Cell, 18, 40-54.
https://doi.org/10.1105/tpc.105.037796 - 18. Heyl, A., Ramireddy, E., Brenner, W.G., Riefler, M., Allemeersch, J. and Schmülling, T. (2008) The Transcriptional Repressor ARR1-SRDX Suppresses Pleiotropic Cytokinin Activities in Arabidopsis. Plant Physiology, 147, 1380-1395.
https://doi.org/10.1104/pp.107.115436 - 19. Ashikari, M., Sakakibara, H., Lin, S., Yamamoto, T., Takashi, T., Nishimura, A., Angeles, E.R., Qian, Q., Kitano, H. and Matsuoka, M. (2005) Cytokinin Oxidase Regulates Rice Grain Production. Science, 309, 741-745.
https://doi.org/10.1126/science.1113373 - 20. Huang, X.Y., Chao, D.Y., Gao, J.P., Zhu, M.Z., Shi, M. and Lin, H.X. (2009) A Previously Unknown Zinc Finger Protein, DST, Regulates Drought and Salt Tolerance in Rice via Stomatal Aperture Control. Genes & Development, 23, 1805-1817.
https://doi.org/10.1101/gad.1812409 - 21. Tiwari, M., Sharma, D. and Trivedi, P.K. (2014) Artificial microRNA Mediated Gene Silencing in Plants: Progress and Perspectives. Plant Molecular Biology, 86, 1-18.
https://doi.org/10.1007/s11103-014-0224-7 - 22. Schwab, R., Ossowski, S., Riester, M., Warthmann, N. and Weigel, D. (2006) Highly Specific Gene Silencing by Artificial microRNAs in Arabidopsis. The Plant Cell Online, 18, 1121-1133.
https://doi.org/10.1105/tpc.105.039834 - 23. Carbonell, A. (2017) Artificial Small RNA-Based Strategies for Effective and Specific Gene Silencing in Plants. Plant Gene Silencing: Mechanisms and Applications, 5, 110.
https://doi.org/10.1079/9781780647678.0110 - 24. Lin, J., Zhou, B., Yang, Y., Mei, J., Zhao, X., Guo, X., Huang, X., Tang, D. and Liu, X. (2009) Piercing and Vacuum Infiltration of the Mature Embryo: A Simplified Method for Agrobacterium-Mediated Transformation of Indica Rice. Plant Cell Reports, 28, 1065-1074.
https://doi.org/10.1007/s00299-009-0706-2 - 25. Biswas, S., Razzaque, S., Elias, S.M., Amin, U.M., Haque, T., Islam, S.T., Lisa, L.A., Naznin, F., Rasul, N.M. and Seraj, Z.I. (2015) Effect of the Vacuolar Na+/H+ Antiporter Transgene in a Rice Landrace and a Commercial Rice Cultivar after Its Insertion by Crossing. Acta Physiologiae Plantarum, 37, 1730.
https://doi.org/10.1007/s11738-014-1730-6 - 26. Sambrook, J., Fritsch, E.F. and Maniatis, T. (1989) Molecular Cloning: A Laboratory Manual. Cold Spring Harbor Laboratory Press, New York.
- 27. Parvin, S., Biswas, S., Razzaque, S., Haque, T., Elias, S.M., Tammi, R.S. and Seraj, Z.I. (2015) Salinity and Drought Tolerance Conferred by in Planta Transformation of SNAC1 Transcription Factor into a High-Yielding Rice Variety of Bangladesh. Acta Physiologiae Plantarum, 37, 68.
https://doi.org/10.1007/s11738-015-1817-8 - 28. Boumahdi, M., Mary, P. and Hornez, J. (2001) Changes in Fatty Acid Composition and Degree of Unsaturation of (Brady) Rhizobia as a Response to Phases of Growth, Reduced Water Activities and Mild Desiccation. Antonie van Leeuwenhoek, 79, 73-79.
https://doi.org/10.1023/A:1010291818304 - 29. Yoshida, S. (1976) Routine Procedure for Growing Rice Plants in Culture Solution. In: Yoshida, S., Forno, D.A. and Cock, J.H., Eds., Laboratory Manual for Physiological Studies of Rice, International Rice Research Institute, Los Baños, 61-66.
- 30. Yasmin, F., Biswas, S., Jewel, G.N.A., Elias, S.M. and Seraj, Z.I. (2016) Constitutive Overexpression of the Plasma Membrane Na+/H+ Antiporter for Conferring Salinity Tolerance in Rice. Plant Tissue Culture and Biotechnology, 25, 257-272.
https://doi.org/10.3329/ptcb.v25i2.26259 - 31. Doyle, J. (1991) DNA Protocols for Plants. In: Hewitt, G.M., Johnston, A.W.B. and Young, J.P.W., Eds., Molecular Techniques in Taxonomy, Springer, Berlin, 283-293.
https://doi.org/10.1007/978-3-642-83962-7_18 - 32. Amin, M., Elias, S.M., Hossain, A., Ferdousi, A., Rahman, M.S., Tuteja, N., and Seraj, Z.I. (2012) Over-Expression of a DEAD-Box Helicase, PDH45, Confers Both Seedling and Reproductive Stage Salinity Tolerance to Rice (Oryza sativa L.). Molecular Breeding, 30, 345-354.
https://doi.org/10.1007/s11032-011-9625-3 - 33. Negi, N.P., Shrivastava, D.C., Sharma, V. and Sarin, N.B. (2015) Overexpression of CuZnSOD from Arachis hypogaea Alleviates Salinity and Drought Stress in Tobacco. Plant Cell Reports, 34, 1109-1126.
https://doi.org/10.1007/s00299-015-1770-4
NOTES
*Equal contribution.