American Journal of Plant Sciences
Vol.4 No.7(2013), Article ID:34735,9 pages DOI:10.4236/ajps.2013.47177
Assessment of EST-SSR Markers for Evaluating Genetic Diversity in Watermelon Accessions from Zimbabwe
![]()
1Seed Services, Department of Research and Specialist Services, Ministry of Agriculture, Mechanization and Irrigation Development, Harare, Zimbabwe; 2Department of Plant Breeding, Swedish University of Agricultural Sciences, Kristianstad, Sweden.
Email: mujajuclaid@gmail.com
Copyright © 2013 Claid Mujaju et al. This is an open access article distributed under the Creative Commons Attribution License, which permits unrestricted use, distribution, and reproduction in any medium, provided the original work is properly cited.
Received April 14th, 2013; revised May 17th, 2013; accepted June 18th, 2013
Keywords: EST-SSRs; Sweet Watermelon; Cow-Melons; Watermelon; Genetic Diversity
ABSTRACT
Fifteen expressed sequence tag (EST)-derived simple sequence repeats (EST-SSRs) were used to investigate genetic diversity in 139 plants obtained from seeds of 35 watermelon accessions collected from all the geographical provinces of Zimbabwe. In addition, 15 plants representing three commercial varieties developed in the United States (USA) were analyzed for comparison. A total of 65 alleles were detected among all the watermelon accessions. For the 13 polymorphic EST-SSR loci, number of alleles per locus varied from 2 to 13, with an average of 5 alleles per locus. Values for the polymorphic information content increased as the number of alleles increased, and varied from 0.15 to 0.77 with an average of 0.54 suggesting sufficient discriminatory power. Both cluster analysis and principal coordinate analysis (PCA) produced two major clusters; one with the 22 cow-melon accessions and the other with the 16 sweet watermelon accessions. Within the sweet watermelon group, two distinct sub-clusters formed, one of which contained only two of the commercial varieties from USA. Partitioning of genetic variation in the Zimbabwean material using analysis of molecular variation (AMOVA) revealed that 64% of the total variation resides between the two major forms, i.e. sweet watermelons and cow-melons, 28% between accessions within forms and 8% within accessions. The EST-SSR markers revealed a somewhat higher diversity in sweet watermelon accessions compared to that of cow-melons. This finding is contrary to previous reports using other markers (genomic SSR loci or RAPD) and/or a plant material that is likely to have experienced more stringent selection procedures compared to the landraces analyzed in our study.
1. Introduction
Watermelon (Citrullus lanatus) plays a pivotal role in drought-prone semi-arid areas of Africa with an annual rainfall below 650 mm. This crop is grown mainly as an important staple food (edible seeds and fruit flesh that can be used for making porridge or used as a dessert) and for animal feed. In southern Africa, watermelon has been highly connected with traditional agriculture, in particular subsistence farming where farmers rely on the fruit for survival, especially in times of prolonged drought. This region contains wild and domesticated watermelons with extensive morphological variation, and has been postulated to be the centre of origin for watermelon [1]. World-wide, watermelon ranks as the fifth-most economically important vegetable crop [2] and genetic material from Africa plays an important role in breeding programs.
Realizing the continuous loss of genetic diversity of crop plants in farmers’ field and in nature, watermelon has been given a priority status in regional conservation programmes in Southern Africa. Here, it is regarded as an underutilized crop, with a not yet fully explored potential for crop improvement. Farmers’ landraces of watermelon are expected to be drought tolerant and widely adaptable. In addition, the extensive variation in traits like fruit size and shape, colour pattern, rind colour, taste, leaf structure and shape, suggests that valuable breeding gains could be realized if this genetic variation was properly accessed.
Most studies on genetic variation in watermelon have been focused on modern cultivated varieties from the developed world, mostly USA and Asia, especially China and South Korea. There have been few studies on landraces in traditional agro-ecosystems, and most of these have included Southern African material only when encoded as US Plant Introductions and adapted to the US environment. These accessions are therefore not truly representative of the existing diversity in southern Africa.
In recent years, the few studies on genetic diversity carried out within Southern Africa [1,3,4], have indicated considerable amounts of genetic diversity, with sweet watermelon accessions containing almost as much variability as cow-melon accessions. On the contrary, studies of genetic diversity in US Plant Introductions and elite cultivars using isozymes [5] and randomly amplified polymorphic DNA (RAPD) markers [6] have revealed low marker polymorphism in sweet watermelon, despite a wide range of fruit phenotypes.
The phenotypic diversity among watermelon cultivars has been attributed to point mutations in genes controlling fruit colour, which may not be readily detected by dominantly inherited markers [7]. The use of sequencerelated amplified polymorphism (SRAP) markers, known to be associated with gene sequences, produced variable marker profiles suggesting that considerable polymorphism exists in the vicinity of coding regions of the watermelon genome [8]. For this reason, the development of markers related to genes controlling fruit quality in watermelon, by searching for oligonucleotides that occur in high frequency in 4700 watermelon EST-unigenes was initiated [8]. The markers designed from these ESTunigenes included EST (expressed sequence tag)-derived SSR (EST-SSR) markers. Availability of EST-SSR marker sequences for oligonucleotide synthesis, involvement of PCR amplification, the simplicity of protocol that produces reliable and easily detected amplification products, their co-dominance and single locus derivation, constitutes advantages over AFLP, RFLP and RAPD markers [9]. Therefore, these markers are presently gaining momentum for estimating functional genetic diversity in genebank collections [10].
The objective of the present study was to evaluate polymorphism of EST-SSR markers in Zimbabwean watermelon genebank collections to provide an assessment of the potential level of functional genetic diversity in landraces belonging to this crop.
2. Material and Methods
2.1. Plant Material and DNA Extraction
Seeds from thirty-five watermelon accessions, collected in different regions of Zimbabwe, were obtained from the National Genebank (Table 1). These accessions represented the two major forms of watermelons in Zimbabwe: sweet watermelon (always cultivated) and cow-melon including both cultivated types and wild-weedy types that occur mostly in the outskirts of farmers’ fields and are used mainly in times of severe drought. In addition, three commercial varieties of sweet watermelon were obtained from the Harris Morgan Seed Company (Twin Falls, ID, USA) for comparison. Seeds were germinated in a greenhouse at 25˚C at Balsgård, Sweden. A total of 154 plants with an average of 4 plants per accession (the range was 1 - 5 plants per accession), were chosen for this study. DNA was extracted from young leaf tissue (10 µg) using the Qiagen DneasyTM Plant Mini Kit (QIAGEN AB, Sollentuna, Sweden) following the manufacturer’s protocol. DNA concentrations and sizes were estimated visually using the DNA low mass ladderTM (Invitrogen, Life Technologies Carlsbad, CA, USA) by electrophoresis in 2% (w/v) agarose gels stained in 3 µl of ethidium bromide (EtBr).
2.2. PCR Analysis
Fifteen EST-SSR primer pairs (Table 2) were chosen, based on exhibiting high to medium polymorphism when previously evaluated in 25 American watermelon heirloom cultivars and 13 US Plant Introductions (PIs) of Citrullus sp. [8]. The PCR was performed in 10 µl total volume of reactions following previous protocols [11]. The only change was for primer 3X1E06-2 for which a primer concentration of 0.15 µM was used instead of the 0.25 µM used for the rest of the primers. PCR program was as follows: 94˚C at 3 min, 45 times 94˚C at 1 min, X˚C at 1 min and 72˚C at 2 min, and a final elongation step of 72˚C at 60 min. X denotes the different annealing temperatures used for the different EST-SSR primers (Table 2). The PCR products were stored at 4˚C before use. To check for successful amplification of the PCR fragments, fragments were visualized in UV illumination on 2% (w/v) agarose gels stained with ethidium bromide. To separate DNA fragments and determine sizes, all primer-pairs were fluorescently labeled at the 5’-end with either FAM or HEX and samples pooled prior to separation. PCR products were separated and analyzed using capillary gel electrophoresis on an ABI 3130XL Genetic DNA Analyzer (Applied Biosystems, Carlsbad, CA, USA). Size of the amplified products was calculated based on an internal standard (500ROXTM Size Standard, Applied Biosystems) using GeneMarker® Software version 1.85 (SoftGenetics, State College, PA, USA).
2.3. Data Analysis
For single-locus evaluations of the EST-SSR data, all DNA fragments were scored as allele sizes at each locus. The polymorphic information content (PIC) for each locus was then calculated according to the formula: PIC = , where Pi is the frequency of the i-th allele [12]. Data for all fifteen EST-SSR loci in the 154 plants from
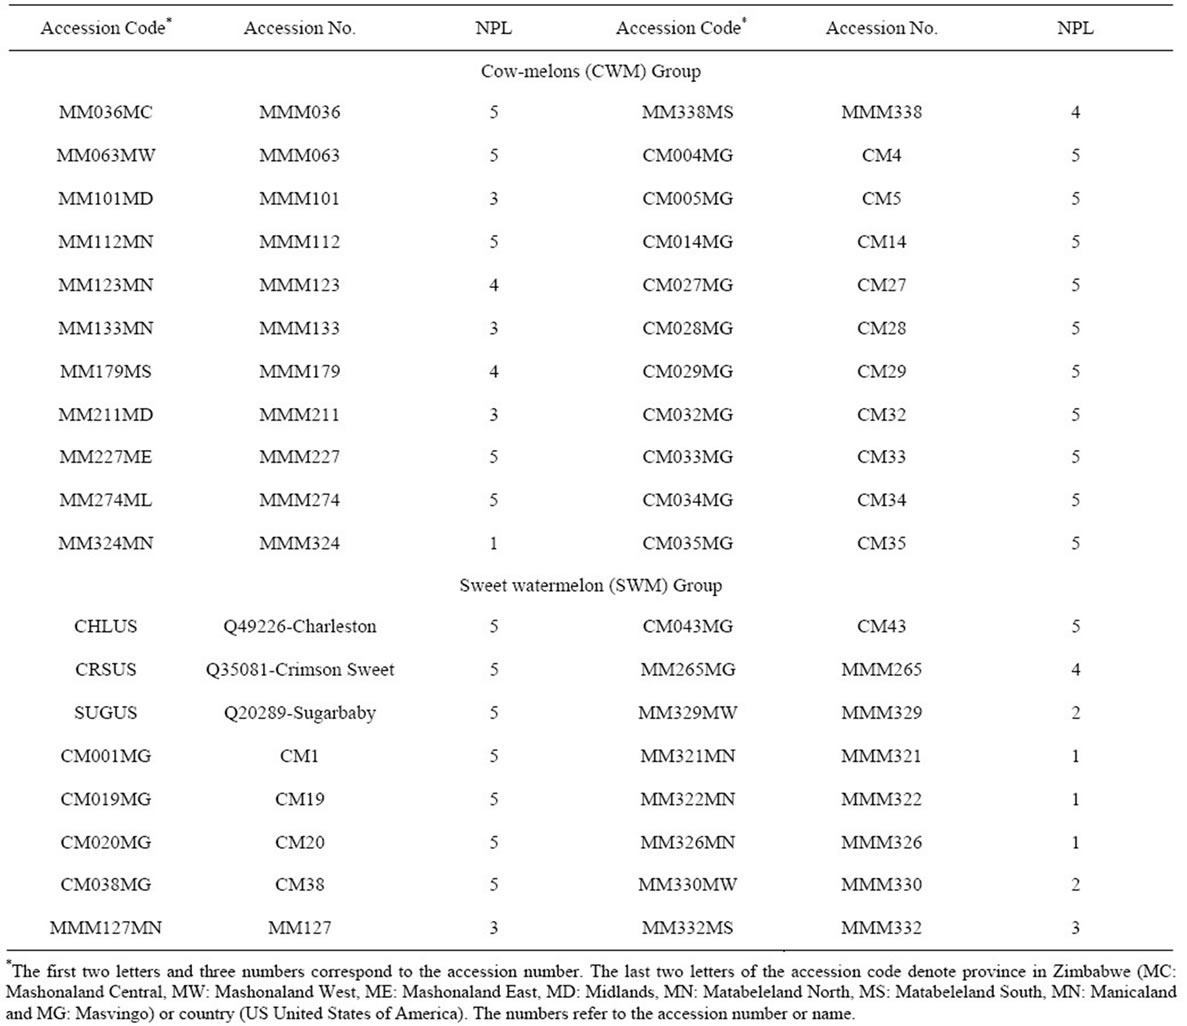
Table 1. Plant materials used in this study, deposited at the Zimbabwe National Genebank, showing accession code, accession number and number of plants sampled (NPL).
38 accessions were then collated into multi-locus profiles of allele size, and the resultant data matrix was used for subsequent analyses. The programme GenAlEx 6 [13] was used to calculate the percentage of polymorphic alleles within each accession (that had at least three plants), allele-specific F-statistics (FIS), expected heterozygosity (HE), observed heterozygosity (HO), and Shannon’s index of diversity (I).
GST values for genetic differentiation among accessions that had at least three plants were calculated on the Zimbabwean material according to the formula: GST = (HT − HS)/HT where HT is the total genetic diversity, and HS is the mean within-accession diversity [14].
Analyses of molecular variance (AMOVA) were calculated on the Zimbabwean material using Arlequin version 3.0 [15], to estimate the partitioning of genetic variation at different levels; between the two major forms sweet watermelons and cow-melons, and between and within accessions within the two major forms. AMOVA calculations yielded an independent estimate (ΦST) of accession differentiation for comparison with Nei’s GST.
Levels of similarity among and within accessions were also investigated using multivariate methods. A Nei’s genetic similarity matrix generated by GenAlEx 6 was used as an input matrix to construct a UPGMA cluster analysis with NTSYS-pc version 1.80 [16]. The distortion effect was estimated using a cophenetic correlation analysis. As a means of verifying groups derived with the cluster analysis, and potentially being more informative for data that lack a strong hierarchical structure, a principal coordinate analysis (PCO) was computed in GenAlEx 6.

Table 2. Description of EST-SSR loci used and PIC values.
3. Results
Thirteen EST-SSR loci generated polymorphic patterns, with a PIC index ranging from 0.15 to 0.77 while two loci (6A2F05-1 and 3X1-A12) produced a monomorphic pattern (Table 2). A total of 65 EST-SSR alleles were detected. The number of alleles ranged from 2 to 13 per locus, with an average of 5 alleles. Significant correlation was found between the PIC values and the number of alleles (r = 0.946, P < 0.001), an indication that the number of alleles can be used to evaluate genetic diversity.
Four different estimators of within-accession variation were calculated on the 29 Zimbabwean accessions that were represented by at least three samples (Table 3). The average values for all the four estimators were slightly higher for sweet watermelon accessions compared to accessions of cow-melons.
Analysis of molecular variance (AMOVA) within and among the 35 Zimbabwean accessions revealed that 64% of the total variation resides between cow-melons and sweet watermelons, 28% between accessions within these two forms, and 8% within accessions (Table 4). The overall GST for between-accession differentiation was 0.75, slightly lower than the AMOVA ΦST value of 0.86. Calculations carried out separately for differentiation among cow-melon and among sweet watermelon accessions, respectively, produced substantially higher values for the former (GST = 0.71 and ΦST = 0.81) compared to the latter (GST = 0.49 and ΦST = 0.56).
Both cluster analysis and principal coordinate analysis retrieved the two major groups of cow-melon (cultivated and wild-weedy types) and sweet watermelon (Figures 1 and 2). The cophenetic correlation between the genetic similarity matrix and the cluster analysis was 0.946, suggesting a very high goodness of fit. Sweet watermelons differentiated from cow-melons at 38% genetic similarity in the dendrogram. Within the sweet watermelons, two major sub-clusters were found, one containing only two of the cultivated accessions (Crimson Sweet and Sugarbaby) from USA, and another containing the remainder. One cultivated accession (Charleston) from USA associated with a smaller subcluster of sweet watermelon accessions from Zimbabwe, being directly linked to accession CM1. Within the two major groups, there was no clustering pattern linked to geographical areas (provinces) in Zimbabwe.
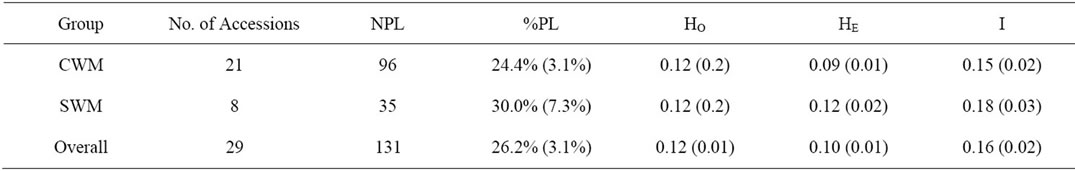
Table 3. Average within-accession genetic variation of watermelon accessions (with at least 3 plants each) represented by the two major groups, cow-melons (CWM) and sweet watermelons (SWM), showing number of plants sampled (NPL), percentage polymorphic alleles (%PL), observed heterozygosity (HO), expected heterozygosity (HE), and Shannon’s index (I). Sampling error of the mean is given within parentheses.
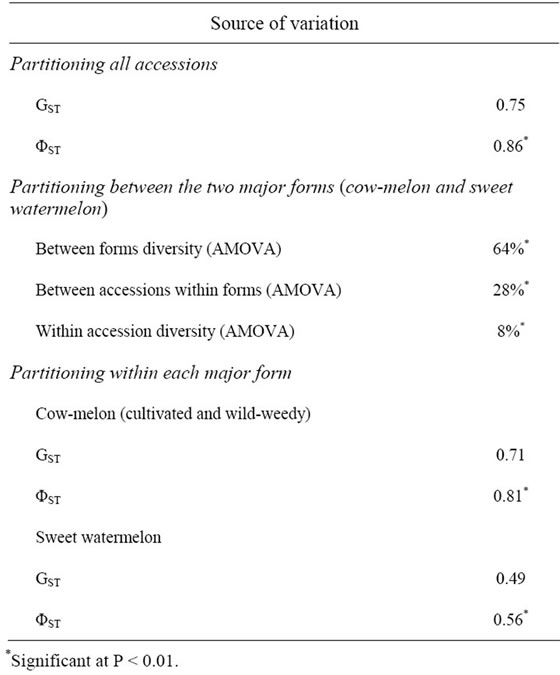
Table 4. Partitioning of EST-SSR-derived genetic variation using GST and AMOVA based on no prior grouping of accessions, and by grouping into the two major forms (cowmelon or sweet watermelon), respectively.
4. Discussion
4.1. Evaluation of EST-SSR Markers
A major reason for using SSR loci developed from EST databases (EST-SSR) when screening germplasm is that these loci may be linked to genes that regulate phenotypic traits. Associations found between EST-SSR genotypes and phenotypic data can therefore lead to the identification of QTLs underlying these traits [17]. Although not yet reported for watermelon, an association between EST-SSR genotypes and phenotypic data has been documented in several other fruit and vegetable crops. While genomic SSR-based patterns of genetic relatedness in European chestnut (Castanea sativa) populations showed only an overall association with geographic distances,
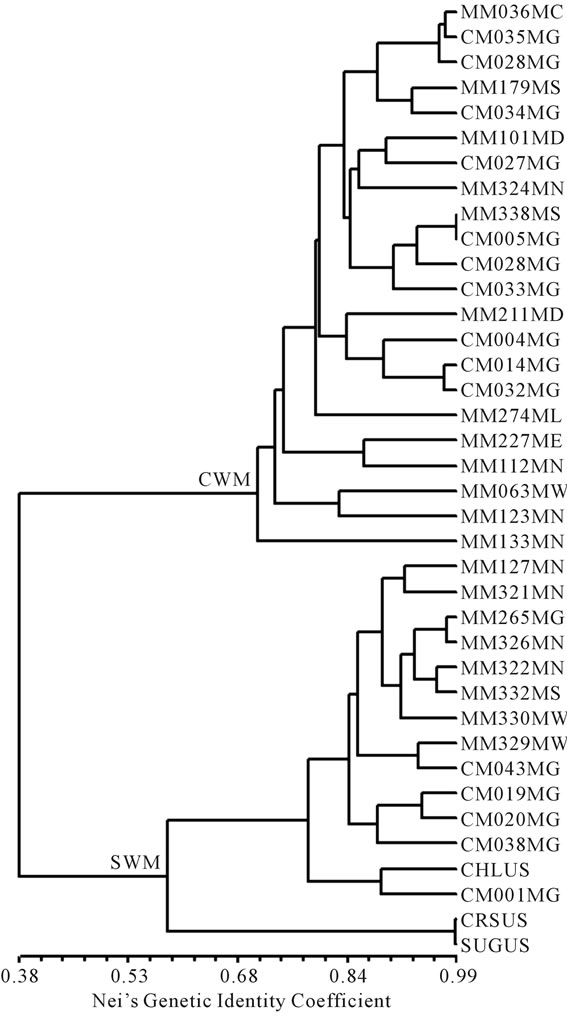
Figure 1. UPGMA dendrogram of watermelon accessions using EST-SSR data, showing two major clusters, CWM cow-melon group (cultivated and wild-weedy) and SWM sweet watermelon group. Initial two letters and three numbers in accession code correspond to the accession number, whereas the last two letters denote province in Zimbabwe (MC Mashonaland Central, MW Mashonaland West, ME Mashonaland East, MD Midlands, MN Matabeleland North, MS Matabeleland South, MN Manicaland and MG Masvingo) or country (US United States of America).
EST-SSR-derived patterns were instead linked to a northsoutherly gradient, possibly connected with adaptive differences in time of bud burst [18]. In cucumber (Cucumis sativus), five accessions with resistance towards downy mildew clustered closely when analyzed with EST-SSR but not when analyzed with genomic SSR loci [19].
However, since EST-SSR are derived from more conserved regions, they are also expected to exhibit lower levels of polymorphism (measured, e.g., as number of alleles per locus, PIC-values and/or expected heterozygosity) than their genomic counterparts. Markedly lower levels of variability after analysis of EST-SSR loci compared to analysis of genomic SSR loci have thus been reported for chestnut [18], cucumber [19] and eggplant (Solanum melongena) [20]. Exceptions do, however, occur; 22 EST-SSR loci exhibited an average PIC value of 0.28 whereas 42 genomic SSR loci only had an average of 0.19 in a screening of potato germplasm [21]. In a study of domesticated almond (Amygdalus communis) and Chinese wild almond (A. nana), EST-SSR loci also produced somewhat higher values for number of alleles (3.14) and expected heterozygosity (0.3520) compared to genomic SSR loci with 2.71 and 0.2338, respectively [22]. This unexpected result was hypothesized to derive from a greater cross-transferability of EST-SSRs compared to genomic SSRs. This would, in turn, result in fewer null-alleles when the EST-SSRs were applied in materials different from those where they had been developed. Considerably fewer null alleles were also encountered using EST-SSRs in cucumber, but total number of detected alleles per locus was still lower than the number of alleles for genomic SSR loci [19].
EST-SSRs have recently been developed for watermelon by at least three research groups. Only 7 out of 31 loci produced polymorphism, and number of polymorphic alleles at these loci was only one or two when applied to 7 watermelon cultivars in India [23]. Considerably higher levels of polymorphism were found in a study of 25 heirloom cultivars and 13 United States Plant Introductions in USA [8]. This latter plant material was, however, more heterogeneous including not just cultivated sweet watermelon forms but also cow-melons and even the wild species C. colocynthis. Sixty-seven percent of 257 EST-SSR primer pairs applied to eight Citrullus samples, including one C. lanatus subsp. citroides and one C. colocynthis, produced polymorphisms, and 79 of these primer pairs were also able to amplify DNA of Cucumis samples [24].
Thirteen of the 15 EST-SSR loci used in our study generated polymorphic patterns with an average of 5 alleles per locus. In addition, a medium high polymorphic information content (PIC) value was obtained for these primers, on average 0.54, suggesting sufficient discriminatory power for differentiating watermelons at the country level. This PIC value is, however, considerably lower than the values of 0.79 and 0.92 previously recorded for genomic SSR loci in studies of African material of watermelon [1,3] as well as the value of 0.66 in a study on 23 SSR loci chosen as a highly informative core set [25]. The PIC value recorded in our study is still higher than the PIC value of 0.34 [26] obtained for genomic SSR loci in another country-level study of watermelon. A comparison between marker types is, however, made ambiguous by differences in the way individual loci are chosen for the studies [27].
4.2. Genetic Diversity in Watermelon
The genetic relationships among watermelon accessions based on the fruit EST-SSR markers (Figures 1 and 2) are consistent with our previous studies based on RAPD and SSR markers [1,3]. The two multivariate analyses used in the present study thus showed strong differentiation between the sweet watermelons and cow-melons. Previous studies using simple sequence repeats [4,25,26, 28], dominant molecular [29-33] and biochemical markers [5], have also demonstrated a strong differentiation between sweet watermelons and cow-melons.
There was significant differentiation between accessions in our study, both when calculated across all accessions and when calculated within each of the two main forms, cow-melons and sweet watermelons. When calculated across all watermelon accessions, the estimates of among-accession differentiation (ΦST = 0.86, GST = 0.75) were higher compared to those obtained for the regional study using genomic SSR loci (ΦST = 0.48, GST = 0.44) [3]. The existence of the two strongly differentiated forms within our material augmented with the effectiveness of EST-SSRs in differentiating among watermelon accessions possibly accounted for this observed discrepancy.
Mean values for expected heterozygosity (0.10) and observed heterozygosity (0.12) within the watermelon accessions were considerably lower than the mean values reported for regional watermelon diversity using genomic SSR loci (HE = 0.42, HO = 0.34) [3]. This could be an effect of the low number of investigated samples in the present study (an average of four plants per accession). Accordingly, an increase in the sample size may result in higher values for the observed and expected heterozygosity, and ultimately resulting in an increased overall variation [34]. Relatively low values were reported also in the West African watermelon C. lanatus oleaginous type (HE = 0.19, HO = 0.13) [35].
Mean value for within-accession observed heterozygosity, expected heterozygosity and Shannon Index in sweet watermelons (HE = 0.12, HO = 0.12, I = 0.18) was slightly higher or similar to values obtained for cow-
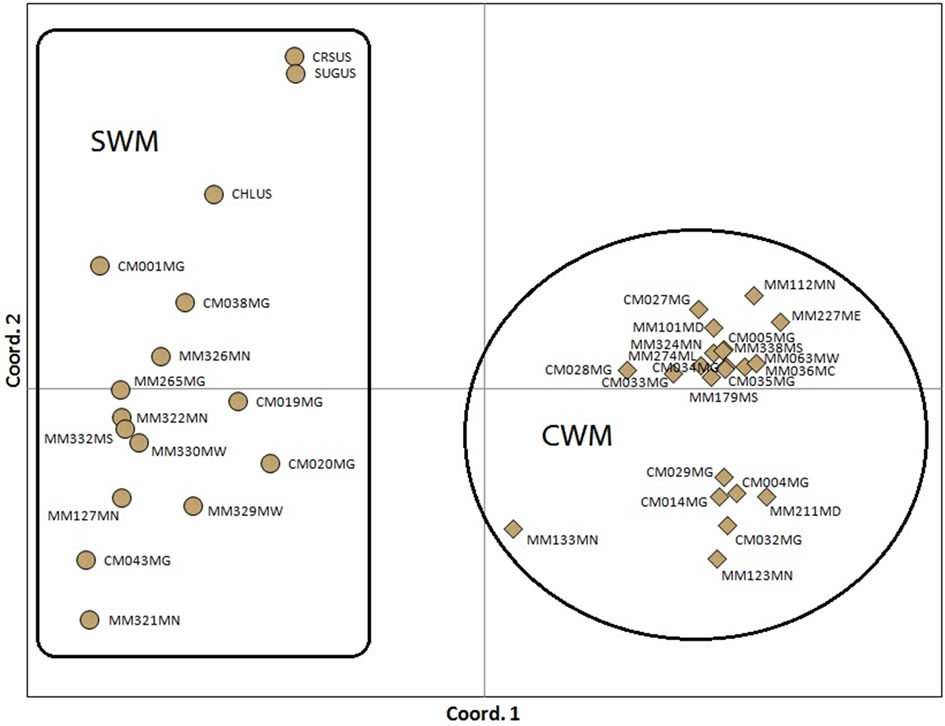
Figure 2. Two-dimensional plot of watermelon accessions using principal coordinate analyses on EST-SSR data. CWM refers to cow-melon group (cultivated and wild forms) and SWM to sweet watermelon group. Initial two letters and three numbers in accession code correspond to the accession number, whereas the last two letters denote province in Zimbabwe (MC: Mashonaland Central, MW: Mashonaland West, ME: Mashonaland East, MD: Midlands, MN: Matabeleland North, MS: Matabeleland South, MN: Manicaland and MG: Masvingo) or country (US United States of America).
melons (HE = 0.09, HO = 0.12, I = 0.15). Contrary to previous studies, where higher levels of genetic diversity have been reported within accessions of C. lanatus var. citroides compared to C. lanatus var. lanatus [5,28], this study revealed that sweet watermelons accessions collected from farmers’ fields may have just as high or even higher within-accession diversity.
Sweet watermelons (ΦST = 0.49, GST = 0.56) were less differentiated than cow-melons (ΦST = 0.81, GST = 0.71). To some extent, this may have been caused by the negative correlation between the mathematically constrained parameters within-population and between-population variation [36].
Although the accessions were highly diverse, the grouping of accessions within the two major forms of watermelon in Zimbabwe was not associated with geographic distances. This implies that considerable heterogeneity exists between landraces collected in different farmers’ fields and between individual plants. Since the genetic marker data was obtained using EST-SSR that are putatively associated with the development and ripening of fruit [8], patterns of similarities and dissimilarities between and within accessions may, to some extent, be linked to fruit genes.
5. Conclusion
This study has shown that EST-SSR markers are useful for elucidating genetic diversity of watermelon accessions in Zimbabwe. Sweet watermelons and cow-melons were strongly differentiated as in previous studies. Within-accession variation was somewhat higher in sweet watermelon than in cow-melons, which has not been reported with other markers. Screening of genebank materials with these markers has the added possible benefit of identifying associations with phenotypic traits.
6. Acknowledgements
Comments received from Prof. Amnon Levi and Dr Larisa Garkava-Gustavsson are greatly appreciated. This work was funded by the NORDIC-SADC Plant Genetic Resources Centre, Lusaka, Zambia.
REFERENCES
- C. Mujaju, J. Sehic, G. Werlemark, L. Garkava-Gustavsson, M. Fatih and H. Nybom, “Genetic Diversity in Watermelon (Citrullus lanatus) Landraces from Zimbabwe Revealed by RAPD and SSR Markers,” Hereditas, Vol. 147, No. 4, 2010, pp. 142-153. doi:10.1111/j.1601-5223.2010.02165.x
- A. Levi, C. E. Thomas, M. Newman, O. U. K. Reddy, X. Zhang and Y. Xu, “ISSR and AFLP Markers Differ among American Watermelon Cultivars with Limited Genetic Diversity,” Journal of the American Society for Horticultural Science, Vol. 129, No. 4, 2004, pp. 553- 558.
- C. Mujaju, A. Zborowska, G. Werlemark, L. GarkavaGustavsson, S. B. Andersen and H. Nybom, “Genetic Diversity among and within Watermelon (Citrullus lanatus) Landraces in Southern Africa,” The Journal of Horticultural Science & Biotechnology, Vol. 86, No. 4, 2011, pp. 353-358.
- P. Munisse, “Diversity and Traditional Uses of Watermelon (Citrullus lanatus) Landraces in Mozambique,” Ph.D. Thesis, Faculty of Life Sciences, University of Copenhagen, Copenhagen, 2011, pp. 1-64.
- N. Navot and D. Zamir, “Isozyme and Seed Protein Phylogeny of the Genus Citrullus (Cucurbitaceae),” Plant Systematics and Evolution, Vol. 156, No. 1-2, 1987, pp. 61-67. doi:10.1007/BF00937202
- A. Levi, C. E. Thomas, T. C. Wehner and X. P. Zhang, “Low Genetic Diversity Indicates the Need to Broaden the Genetic Base of Cultivated Watermelon,” Hortscience, Vol. 36, No. 6, 2001, pp. 1096-1101.
- A. Levi, W. P. Wechter, K. R. Harris, A. R. Davis and Z. Fei, “High-Frequency Oligonucleotides in Watermelon Expressed Sequenced Tags-Unigenes Are Useful in Producing Polymorphic Polymerase Chain Reaction Markers among Watermelon Genotypes,” Journal of American Society of Horticultural Science, Vol. 135, No. 4, 2010, pp. 369-378.
- A. Levi, P. Wechter and A. Davis, “EST-PCR Markers Representing Watermelon Fruit Genes Are Polymorphic among Watermelon Heirloom Cultivars Sharing a Narrow Genetic Base,” Plant Genetic Resources Characterization and Utilization, Vol. 7, No. 1, 2009, pp. 16-32. doi:10.1017/S1479262108014366
- K. F. Salem, R. K. Varshney, M. S. Röder and A. Börner, “EST-SSR Based Estimates on Functional Genetic Variation in a Barley (Hordeum vulgare L.) Collection from Egypt,” Genetic Resources and Crop Evolution, Vol. 57, No. 4, 2010, pp. 515-521. doi:10.1007/s10722-009-9489-0
- R. K. Varshney, A. Graner and M. E. Sorrells, “Genic Microsatellite Markers in Plants: Features and Applications,” Trends in Biotechnology, Vol. 23, No. 1, 2005, pp. 48-55. doi:10.1016/j.tibtech.2004.11.005
- A. Levi, A. Davis, P. Wechter, A. Hernandez and J. Thimmapuram, “Developing Expressed Sequenced Tags (ESTs) for Watermelon Fruit,” Hortscience, Vol. 41, No. 3, 2006, pp. 518-519.
- J. S. C. Smith, E. C. L. Chin, H. Shu, O. S. Smith, S. J. Wall, M. L. Senior, S. E. Mitchell, S. Kresovich and J. Ziegle, “An Evaluation of the Utility of SSR Loci as Molecular Markers in Maize (Zea mays L.): Comparisons with Data from RFLPs and Pedigree,” Theoretical and Applied Genetics, Vol. 95, No. 1-2, 1997, pp. 163-173. doi:10.1007/s001220050544
- R. Peakall and P. E. Smouse, “Genalex 6: Genetic Analysis in Excel. Population Genetic Software for Teaching and Research,” Molecular Ecology Notes, Vol. 6, 2006, pp. 288-295. doi:10.1111/j.1471-8286.2005.01155.x
- M. Nei, “F-Statistics and Analysis of Gene Diversity in Subdivided Populations,” Annals of Human Genetics, Vol. 41, 1977, pp. 225-233. doi:10.1111/j.1469-1809.1977.tb01918.x
- L. Excoffier, G. Laval and S. Schneider, “Arlequin ver. 3.0: An Integrated Software Package for Population Genetics Data Analysis,” Evolutionary Bioinformatics, 2005, pp. 47-50 (Online).
- F. J. Rohlf, “NTSYS-pc Numerical Taxonomy and Multivariate Analysis System: Version 2.1 (ed.),” Setauket, Exeter Publishing Ltd., New York, 1993.
- S. Rudd, “Expressed Sequence Tags: Alternative or Complement to Whole Genome Sequences?” Trends in Plant Science, Vol. 8, No. 7, 2003, pp. 321-329. doi:10.1016/S1360-1385
- A. Martin, C. Mattioni, M. Cherubini, D. Taurchini and F. Villani, “Genetic Diversity in European Chestnut Populations by Means of Genomic and Genic Microsatellite Markers,” Tree Genetics & Genomics, Vol. 6, No. 5, 2010, pp. 735-744. doi:10.1007/s11295-010-0287-9
- J. Hu, L. Wang and J. Li, “Comparison of Genomic SSR and EST-SSR Markers for Estimating Genetic Diversity in Cucumber,” Biologia Plantarum, Vol. 55, No. 3, 2011, pp. 577-580. doi:10.1007/s10535-011-0129-0
- J. E. Munoz-Falcón, S. Vilanova, M. Plazas and J. Prohens, “Diversity, Relationships, and Genetic Fingerprinting of the Listada de Gandía Eggplant Landrace Using Genomic SSRs and EST-SSRs,” Scientia Horticulturae, Vol. 129, No. 2, 2011, pp. 238-246. doi:10.1016/j.scienta.2011.03.034
- Y-B. Fu, G. W. Peterson, K. W. Richards, T. R. Tarn and J. E. Percy, “Genetic Diversity of Canadian and Exotic Potato Germplasm Revealed by Simple Sequence Repeat Markers,” American Journal of Potato Research, Vol. 86, No. 1, 2009, pp. 38-48. doi:10.1007/s12230-008-9059-6
- O. Tahan, Y. Geng, L. Zeng, S. Dong, F. Chen, J. Chen, Z. Song and Y. Zhong, “Assessment of Genetic Diversity and Population Structure of Chinese Wild Almond, Amygdalus nana, Using EST and Genomic SSRs,” Biochemical Systematics and Ecology, Vol. 37, No. 3, 2009, pp. 146-153. doi:10.1016/j.bse.2009.02.006
- M. Verma and L. Arya, “Development of EST-SSRs in Watermelon (Citrullus lanatus var. Lanatus) and Their Transferability to Cucumis spp.,” Journal of Horticultural Science and Biotechnology, Vol. 83, No. 6, 2008, pp. 732-736.
- J. H. Whang, S. G. Ahn, J. Y. Oh, Y. W. Choi, J. S. Kang and Y. H. Park, “Functional Characterization of Watermelon (Citrullus lanatus L.) EST-SSR by Gel Electrophoresis and High Resolution Melting Analysis,” Scientia Horticulturae, Vol. 130, No. 4, 2011, pp. 715-724. doi:10.1016/j.scienta.2011.08.014
- H. Zhang, H. Wang, S. Guo, Y. Ren, G. Gong, Y. Weng and Y. Xu, “ Identification and Validation of a Core Set of Microsatellite Markers for Genetic Diversity Analysis in Watermelon, Citrullus lanatus Thunb. Matsum. & Nakai,” Euphytica, Vol. 186, No. 2, 2012, pp. 329-342. doi:10.1007/s10681-011-0574-z
- Y. S. Kwon, E. K. Park, W. S. Lee, S. I. Yi, K. M. Bae, J. S. An and H. Y. Kim, “Genetic Assessment of Watermelon (Citrullus lanatus) Varieties Using SSR Markers Developed from Cucurbit Species,” Korean Journal of Genetics, Vol. 29, No. 2, 2007, pp. 137-146.
- D. Struss and J. Plieske, “The Use of Microsatellite Markers for Detection of Genetic Diversity in Barley Populations,” Theoretical and Applied Genetics, Vol. 97, No. 1-2, 1998, pp. 308-315. doi:10.1007/s001220050900
- R. L. Jarret, L. C. Merrick, T. Holms, J. Evans and M. K. Aradhya, “Simple Sequence Repeats in Watermelon (Citrullus lanatus (Thunb) Matsum & Nakai),” Genome, Vol. 40, No. 4, 1997, pp. 433-441. doi:10.1139/g97-058
- A. Levi, C. E. Thomas, A. P. Keinath and T. C. Wehner, “Estimation of Genetic Diversity among Citrullus Accessions Using RAPD Markers,” Proceedings of the 7th EUCARPIA Meeting on Cucurbit Breeding and Genetics, Ma’ale Ha Hamisha, Israel, 19-23 March 2000, pp. 385- 390.
- A. Levi and C. E. Thomas, “Low Genetic Diversity Indicates the Need to Broaden the Genetic Base of Cultivated watermeLon,” Hortscience, Vol. 36, No. 6, 2001, pp. 1096-1101.
- A. Levi, C. E. Thomas, A. P. Keinath and T. C. Wehner, “Genetic Diversity among Watermelon (Citrullus lanatus and Citrullus colocynthis) Accessions,” Genetic Resources and Crop Evolution, Vol. 48, No. 6, 2001, pp. 559-566. doi:10.1023/A:1013888418442
- A. Levi, C. E. Thomas, A. M. Simmons and J. A. Thies, “Analysis Based on RAPD and ISSR Markers Reveals Closer Similarities among Citrullus and Cucumis Species than with Praecitrullus fistulosus (stocks) Pangalo,” Genetic Resources and Crop Evolution, Vol. 52, No. 4, 2005, pp. 465-472. doi:10.1007/s10722-005-2260-2
- A. Levi, J. A. Thies, W. P. Wechter, H. F. Harrison, A. M. Simmons, U. K. Reddy, P. Nimmakayala and Z. Fei, “High Frequency Oligonucleotides: Targeting Active Gene (HFO-Tag) Markers Revealed Wide Genetic Diversity among Citrullus spp. Accessions Useful for Enhancing Disease or Pest Resistance in Watermelon Cultivars,” Genetic Resource and Crop Evolution, Vol. 60, No. 2, 2013, pp. 427-440. doi:10.1007/s10722-012-9845-3
- H. Nybom, “Comparison of Different Nuclear DNA Markers for Estimating Intraspecific Genetic Diversity in plants,” Molecular Ecology, Vol. 13, No. 5, 2004, pp. 1143-1155. doi:10.1111/j.1365-294X.2004.02141.x
- L. A. Minsart, I. A. Zoro bi, Y. Djé, J. P. Baudoin, A. L. Jacquemart and P. Bertin, “Set up of Simple Sequence Repeat Markers and First Investigation of the Genetic Diversity of West-African Watermelon (Citrullus lanatus ssp. Vulgaris Oleaginous Type),” Genetic Resources and Crop Evolution, Vol. 1, No. 1, 2009, pp. 1-10.
- H. Nybom and I. V. Bartish, “Effects of Life History Traits and Sampling Strategies on Genetic Diversity Estimates Obtained from RAPD Markers in Plants,” Perspectives in Plant Ecology, Evolution and Systematics, Vol. 3, No. 2, 2000, pp. 93-114. doi:10.1078/1433-8319-00006.