Advances in Microbiology
Vol. 2 No. 4 (2012) , Article ID: 25870 , 8 pages DOI:10.4236/aim.2012.24067
Detection of Stx2 Gene of Escherichia coli and Elevated Levels of Fecal Bacteria in the Cattle Farming Regions of Lake Oconee
Department of Biological and Environmental Sciences, Georgia College and State University, Milledgeville, USA
Email: *dave.bachoon@gcsu.edu
Received August 10, 2012; revised September 14, 2012; accepted September 24, 2012
Keywords: Fecal Bacteria; Oconee Watershed; qPCR; Eschericha coli; Tuf Gene; Bacteroidale
ABSTRACT
The presence of Total coliform, Eschericha coli and enterococci were enumerated in the cattle farming areas of the Oconee Watershed using colilertTM and enterolertTM IDEXX plates, respectively. Microbial Source Tracking (MST) using Bacteroidales molecular markers for ruminant (RuBac) and human (HuBac) specific bacterial groups were used to determine the source of the fecal pollution in the watershed. In the cattle farming regions of the watershed higher levels of fecal bacteria were detected compared to the levels of fecal bacteria at the forested and residential sites. MST indicated that the cattle farming regions (except DC2) of the lake was impacted by fecal pollution from a ruminant source such as cattle. In addition, qPCR for the tuf gene of E. coli and the stx2 gene that is commonly found in enterohemorragic E. coli O157:H7 were used to evaluate the presence of these bacteria in the study area. E. coli O157:H7 (stx2 gene) was detected only in the beef cattle regions of the watershed. The presences of E. coli and stx2 gene in the Oconee Watershed represent a potential public health risk because Lake Oconee and its tributaries are used for recreational activities as well as crop irrigation.
1. Introduction
The significance of Shiga-toxin producing Escherichia coli (STEC) as a public health concern was recognized in 1982 during an investigation into an outbreak of hemorrhagic colitis in the United States. This outbreak was caused by consumption of poorly cooked ground beef in a fast-food restaurant chain in the western US From 1982 to 2002, a total of 350 E. coli O157:H7 outbreaks were reported in 49 US states, from which 325 outbreaks included a number of deaths [1]. Although the Shiga-toxin gene is found in all enterohemorrhagic E. coli (STEC), serotype O157:H7 alone is responsible for more than 73,000 cases of disease per year in the US, and it has been implicated in 250 deaths [1,2]; Cattle and other ruminants are natural reservoirs of E. coli O157:H7 that can introduce pathogenic E. coli into the environment through fecal shedding [3-6]. Estimates of occurrence vary, but it appears that both dairy herds and beef feedlots can have animals carrying STEC including E. coli O157:H7 [6,7].
Recent studies have demonstrated that the Lake Oconee Watershed is impacted by fecal pollution from urban development and cattle farming operations [8]. Burt et al. 2011 used Microbial Source Tracking (MST) markers to trace the source of E. coli in the Lake Oconee Watershed to bovine and human sources, and determined that the highest concentrations of E. coli in surface water were found in the cattle farming regions of the lake. Consequently, there is a high probability that Lake Oconee could be contaminated with STEC including E. coli O157:H7, and this could represent a serious public health risk when water from the lake is used for recreation or crop irrigation. Microbiological studies have found that waterborne transmission of STEC such as E. coli O157:H7 can occur through swimming, crop irrigation or from drinking contaminated water [7,9]. Moreover, the infectious dose of E. coli O157:H7 in humans is quite low [7]. Unfortunately, previous studies have not assessed the presence of STEC or E. coli O157:H7 in the Oconee Watershed.
Traditionally, enterohemorragic E. coli strains were detected from water samples using time consuming culture based enrichment methods [10,11]. Today, quantitative polymerase chain reaction (qPCR) methods have emerged as another option to rapidly detect the presence of STEC in environmental samples without the need for isolating and culturing the bacterium [7,12]. Quantitative PCR assays for the tuf gene of shigella-like E. coli strains has been used to quantify E. coli in environmental samples [13]. While the shiga-like toxin genes (stx1 and stx) that are phage encoded and is present in enterohemorrhagic E. coli strains were used to indicate the presence of shiga-toxin producing E. coli strains [12]. These qPCR assays provide rapid and cost effective means of detecting and quantifying the presence of E. coli and the potential of shiga-toxin producing E. coli strains in the Oconee Watershed.
For this study, our aims were to investigate the parameters of surface waters in the Oconee Watershed that are indicative of the presence of STEC, and use MST approach with Bacteoridales markers for human (HuBac) and cattle (RuBac) specific bacterial groups to track a potential source of STEC in the Lake Oconee watershed [14-16]. In addition, physiochemical parameters and the level of fecal indicator bacteria at each site were determined as an index of water quality.
2. Material and Methods
2.1. Study Sites
Cattle fecal contamination in the Upper Oconee River Basin was established using three main tributaries of Lake Oconee: the Oconee River, Apalachee River, and Sugar Creek (Figure 1). The Oconee River Basin covers 5326 square miles of Central Georgia, and falls within the Level 3 Piedmont and Southeastern Plains Ecoregion. The Upper Oconee Basin is made up of the Oconee River, Apalachee River, Indian Creek, and Murder Creek sub-
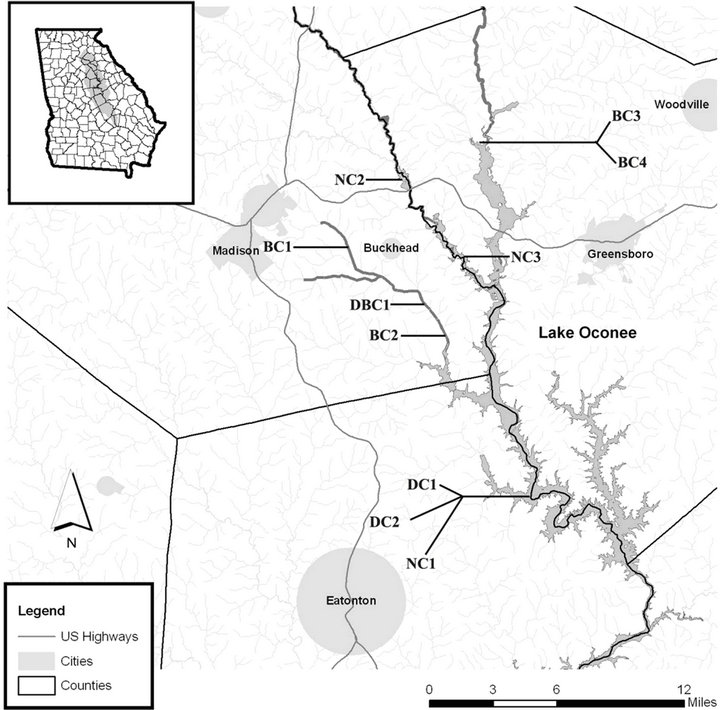
Figure 1. Map of Upper Oconee watershed with sampling sites labeled. DC = Presence of dairy cattle; BC = Presence of beef cattle; DBC = Presence of both beef and dairy cattle; NC2, NC3 = Forested; NC1 = Modern suburban.
watersheds which meet at Lake Sinclair. The Oconee River flows south from Athens and joins Greenbriar Creek just east of Lake Oconee in Greene County. Beef cattle farms at Dyar Pasture (BC3 and BC4) are on the Oconee River. BC3 allows cattle direct access to the river while BC4 has riparian buffers and fencing prohibiting cattle from entering surface waters. The Apalachee River watershed forms the western boundary of National Forest lands in Greene County, GA. US 278/GA 12 intersects this watershed in north Greene County (NC2) while Swords Boat Ramp (NC3) is located at the southern end of the river. No cattle are present at these sampling sites. Sugar Creek supplies the central portion of Lake Oconee, and is intersected by Seven Island Rd (BC1) in Morgan County. At site BC1 there is a grazing heard of 25 - 50 beef cattle, and the cattle are restricted from the creek using riparian buffers with fencing. Cattle activity has broken the fencing at BC1 allowing cattle to enter the creek. Mt Zion Rd (BC2) in Putnam County also intersects Sugar Creek, and was used as a sampling site due to its close proximity to a beef cattle operation. Three sampling sites, DC1, DC2, and NC1 were on the shoreline of Lake Oconee; DC1 is characterized as a site with fencing completely excluding cattle from the lake while DC2 is 100 m downwind from DC1, and is influenced by a creek that receives runoff from the cattle operation flowing through riparian area before it enters the lake. NC1 is characterized as being a modern suburban site with no cattle activity.
2.2. Sample Collection and Physical Parameters
Water samples were collected in April 2010, from the top 25 cm of surface waters and stored on ice for <24 hrs before processing. Physical parameters were measured on site during each sampling event. All physical parameters (water temperature (˚C), total dissolved solids, turbidity (NTU), pH, and dissolved oxygen (mg/L)) were measured based on manufacturer’s protocol using a Horiba U-52G meter (Kyota, Japan).
2.3. Biological Parameters
The geometric means of enterococci, total coliform, and E. coli were determined at each site. The IDEXX QuantiTray Sealer 2X (Westbrook, ME, USA) was used for enumeration of total coliform, E. coli, and enterococci. The reagents Colilert-18 and Enterolert were used following the manufacturer’s protocol for the quantification of each respective bacterium and bacterial numbers were based on the table provided by the manufacturer.
2.4. DNA Extraction from Environmental Samples
DNA was extracted from cattle and sewage fecal samples following the procedure of the MoBio UltracleanTM Soil DNA Kit. Cattle fecal samples were collected from dairy and beef cattle farms. Filters of water samples were processed with the MoBio UltracleanTM Soil DNA Kit (Carlsbad, CA) using a modification of the “Alternative Protocol” given by the manufacturer [17,18]. In brief, this involved separating the bead solution from the beads and placing it in a 15-mL centrifuge tube containing the filter. Solutions S1 and IRS were placed in the tube and vortexed vigorously for 15 min. The solution was removed from the centrifuge tube and placed in the bead tube. From this point on the manufacturer’s protocol was followed. Extracted DNA was quantified using a Nanodrop ND-1000 Spectrophotometer (Wilmington, DE).
2.5. qPCR Setup and Controls
Lyophilized E. coli O157:H7 genomic DNA from the European Commission: Institute for Reference Materials and Measurements IRMM-449 and E. coli strain B genomic DNA Sigma® D4889 were used as positive controls in tuf gene qPCR assays. Only E. coli O157:H7 IRMM-449 was used as a positive control for stx gene assay. In both instances, Bifidobacterium adolescentis genomic DNA ATCC® number 15703D™ was used as a negative control. Extracted DNA from cow manure and sewage were used as positive environmental controls for source tracking of ruminant and human Bacteroides respectively.
Following extraction of environmental samples, DNA was amplified using the Bio-Rad CFX96 (Hercules, CA). Samples were run using optimized qPCR assays [12,13, 15,16]. Each qPCR contained a 25 µL volume with 12.5 µL of iQ™ SYBR® Green 2 X Supermix, 9.5 µL deionized H2O, 250 nM of primer (Table 1), and 1 µL (~10 ng) of template DNA.
Total E. coli detection using the tuf gene as a target was performed under the following conditions: initial denaturing at 95˚C for 5 min; 40 cycles of 95˚C for 30 s, 60˚C for 30 s, and 72˚C for 30 s; a final elongation step at 72˚C was omitted in each protocol as it has been deemed unnecessary. The stx gene primers (Table 1) were used for the detection of STEC using the following conditions: initial denaturing at 95˚C for 5 min; 45 cycles of 95˚C for 15 s, 54˚C for 10 s, and 72˚C for 15 s. Serial dilutions of E. coli O157:H7 DNA was used to generate all standard curves from 2.97 × 10⁶ gene copies to 2.97 × 101 gene copies. Environmental samples were assessed for possible PCR inhibition by amending with Bifidobacteria DNA as described by Bachoon et al. 010. Changes of less than two CT value were observed, which indicates that the extracted DNA did not contain impurities that significantly inhibited the PCR (Bachoon et al. 2010). The detection limit for STEC was 1.50 × 10² gene copies per 100 mL of water sample.
2.6. Microbial Source Tracking
The source of the fecal contaminant was tracked using ruminant (RuBac) and human Bacteroides (HuBac) specific primers (Table 1). The SYBR Green qPCR conditions for detection of ruminant Bacteroidales were 95˚C for 10 min; 40 cycles of 95˚C for 15 s and 60˚C for 1 min. Conditions for HuBac were: 95˚C for 10 min; 40 cycles of 95˚C for 30 s and 60˚C for 45 s. Primers for HuBac and RuBac were tested for cross-reaction to insure specificity for targets. Distinctive Tm curves for HuBac and RuBac PCR assays are shown in Figure 2.
3. Results
3.1. Physiochemical Parameters
A total of 10 sites representing three major tributaries of Lake Oconee, as well as sites on the lake itself, were sampled for one month (n = 50). Seven sites were located at cattle farms and three sites were from regions of the lake without cattle farms (Figure 1, Table 2). The physiochemical parameters DO, pH and temperature were similar at all the study sites, and turbidity was higher at the cattle farming sites (~55 NTU) compared to the cattle free regions (~36 NTU) of the watershed (Table 2). These parameters are typical for surface waters in the Lake Oconee region [8,19]. Surface water from dairy and beef cattle farming areas exhibited similar physical parameters throughout the course of the study. Dissolved oxygen averaged 10.40 mg/L, pH averaged 7.02 with values ranging from 6.56 to 7.74, and turbidity displayed an average of 37.81 NTU. Sites DC1 and DBC1 displayed higher turbidity levels throughout sampling, 55.20 ± 17.17 NTU and 53.12 ± 31.84 NTU respectively. Temperatures for all sites ranged from 10.45˚C to 22.71˚C, with an average temperature of 16.79˚C (Table 2).
3.2. Fecal Indicator Bacterial Enumeration
Enterococci, total coliform, and E. coli were enumerated, in duplicate, five times in April and their geometric
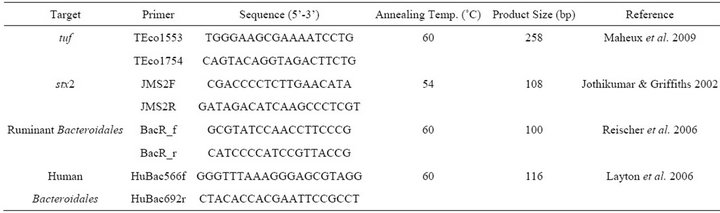
Table 1. Target gene primer sets for the detection of E. coli, stx2 and source tracking of ruminant and human fecal bacteria.
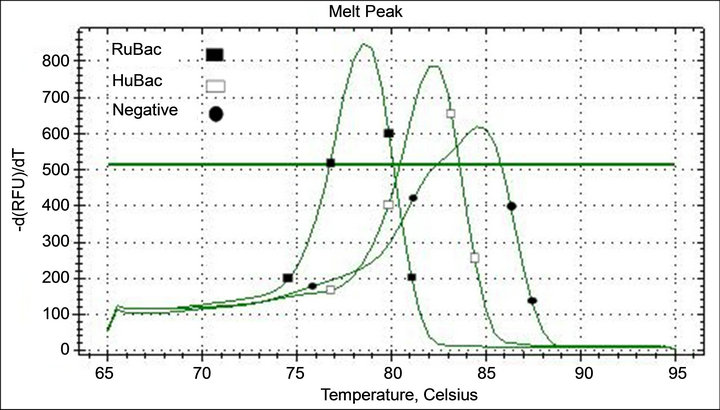
Figure 2. Tm curve profiles of SYBR Green qPCR assay. Tm was 78.1˚C for RuBac and 82.5˚C for HuBac. A no template negative control peaked at 85˚C.

Table 2. Measurements of dissolved oxygen (DO) concentration (mg/L), pH, turbidity (NTU), temperature (˚C), and total dissolved solids (mg/L) at each site. All values displayed are means ± standard deviation.
means were taken to dampen effects of a single sampling event. Cattle free sites exhibited the lowest levels of fecal contamination in all instances. NC3 displayed the lowest levels of E. coli and enteroccoci (45.8 MPN/100mL and 11.9 MPN/100mL respectively), while the modern suburban site at NC1 displayed the lowest coliform numbers (588.2 MPN/100mL). Highest levels of coliform bacteria were found at DC1 (4208.2 MPN/100mL), which was a site with fencing only. However, cattle farms with direct access (BC3) and riparian buffered sites with fencing (DBC1) had similar numbers of fecal coliform (2878.1 MPN/100mL and 2685.6 MPN/100mL). DBC1 also displayed the second highest totals of enterococci and E. coli (261.7 MPN/100mL and 713.2 MPN/100mL). The highest levels of both enterococci and E. coli (382.2 MPN/100mL and 1152.2 MPN/100mL) were measured at another site (BC1) where cattle had direct access to the water.
3.3. qPCR Assessment of E. coli and Stx
Slurries of fecal samples from beef cattle farms and the dairy cattle farm were assayed for the presence of E. coli and STEC, and indicated that E. coli and stx gene were present in both types of fecal samples (data not shown). The greatest amount of E. coli 8.13 × 10³ gene copies per 100 mL were detected at BC1 (7.68 × 10³), BC2 (1.93 × 10³) and BC 6.1 × 10³ (Table 3). Stx was detected only at beef cattle sites (BC1 to BC4). Forested and urban areas of the watershed did not have detectable levels of stx (Table 3).
3.4. Microbial Source Tracking
Microbial Source Tracking using putative DNA markers for human (HuBac) and ruminants (RuBac) were used to
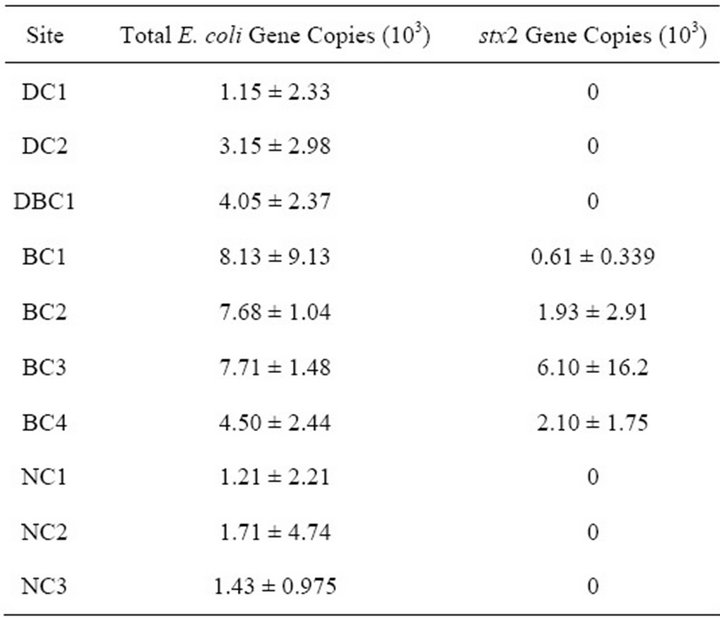
Table 3. Total gene copies of E. coli and stx2 per sampling site. Values displayed are means ± standard deviation. Percentages displayed are based on mean values.
identify the major source of fecal pollution in the study sites of the lake (Table 4, Figure 2). All dairy and beef cattle sites, except DC2, displayed the marker for ruminant contamination, while cattle free sites did not (Figure 2). The HuBac marker for human fecal pollution was detected at BC2, BC3, BC4, and DBC1 and two cattle free sites NC2 and suburban site NC3.
4. Discussion
In 2007, the State of Georgia identified seventy-two stream segments in the Oconee River Basin as water quality limited due to elevated fecal coliform levels [20]. Research on the sources of fecal pollution in the Oconee River Basin is very limited, but poultry and cattle opera-
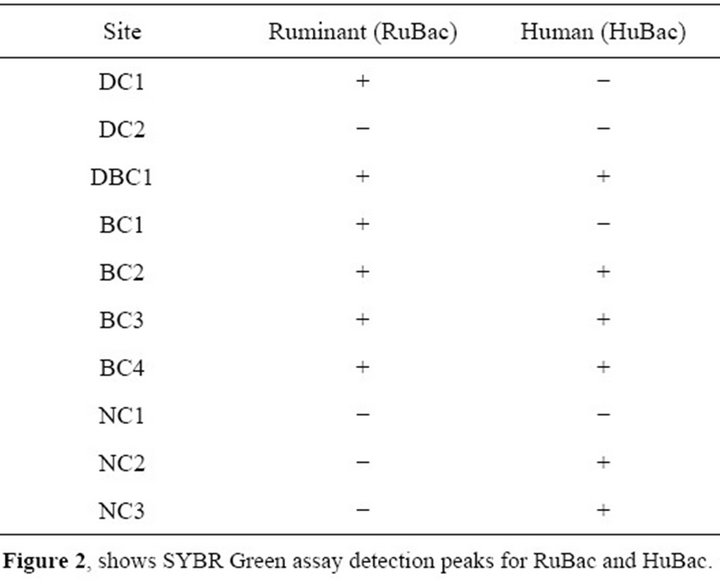
Table 4. Molecular Source Tracking of Bacteroidales putative markers of ruminant and human fecal bacteria detected by qPCR.
tions along with urban development have been suggested as major sources of fecal bacteria in the Oconee Watershed [8,19,21]. Whenever there is a high incident of cattle fecal contamination in an environment there will be an increase in the likelihood of detecting STEC including E. coli O157:H7 in that area because cattle are a natural reservoir of these pathogenic bacteria [6,22]. Therefore, in this study we focused our efforts on the detection of stx as a potential indicator of STEC in the cattle farming areas of the watershed.
Ongoing research in our lab monitors fecal pollution in the Oconee Watershed. Not surprising the highest levels of fecal indicator bacteria were detected in the cattle farming regions of the watershed. At the beef cattle site BC1, cattle have direct access to surface water which subsequently led to the highest geometric means of E. coli and enterococci (Table 5). This agrees with previous research that demonstrated that high level of fecal bacteria were present in the cattle this farming region of the Oconee Watershed [8,19]. Most of the areas where cattle were present, except for the cattle farming site BC3, exceeded the state regulatory standard for E. coli levels of 126 CFU/100mL in recreational waters [22]. In contrast, relatively low levels of fecal bacteria including E. coli were detected in the forested and urban areas of the watershed (Table 3). Low levels of fecal pollution are typical for forested and modern suburban regions of the Oconee Watershed [8,19].
DNA was extracted from 0.2 um nucleopore filters of water samples and used for qPCR SYBR Green assays of E. coli and stx at each study site (Table 3). We assumed that the filters would recover bacteria cells and allow the majority of any free bacteriophage to pass through and be discarded. Using qPCR, the highest levels of E. coli were detected in the cattle farming regions of the watershed. This agrees with the IDEXX enumeration levels of E. coli in the watershed (Table 5) and studies that have recovered 102 to 108 CFU E. coli O157:H7 per gram in feces and fresh manure [23-25]. It has been documented that the presence of E. coli O157:H7 can be determined in a sample based on PCR detection of one of six virulence genes including Shiga toxin 2 [26,27]. However studies have indicated that the stx gene can be detected in free bacteriophage from sewage samples and therefore detection of the stx gene does not always confirm the presence of STEC in environmental samples [9]. Among the sites, only areas influenced by beef cattle showed presence of stx and therefore these sites would be a likely source of shiga-toxin producing E. coli strains. It was unexpected that stx was not detected at the dairy farming sites because stx2 was detected in fecal samples from both dairy and beef cattle farms used in this study (data not shown), and previous research has indicated STEC is shed from beef and dairy cattle [7,27]. However, it has been suggested that depending on their diet beef cattle may shed greater quantities of STEC compared to dairy cattle [3]. Overall qPCR detected approximately 50% less E. coli at the dairy farm sites compared to the beef cattle sites, and IDEXX enumeration of E. coli also indicated that there were lower levels of E. coli at dairy cattle sites (DC1 and DC2). In addition, qPCR indicated that a large proportion of total E. coli detected at the beef cattle site BC3 contained the stx2 gene and could be STEC strains. One reason for high levels of stx was attributed to access of the cattle at this site. The presence of stx is cause for concern because it suggest the presence of STEC in the lake which can be health risk to the public because these pathogens can survive in aquatic environments for up to a year [7,25].
Often it is important to determine the source of fecal pollution in an environment before the most appropriate mitigating steps can be developed to alleviate the prob-
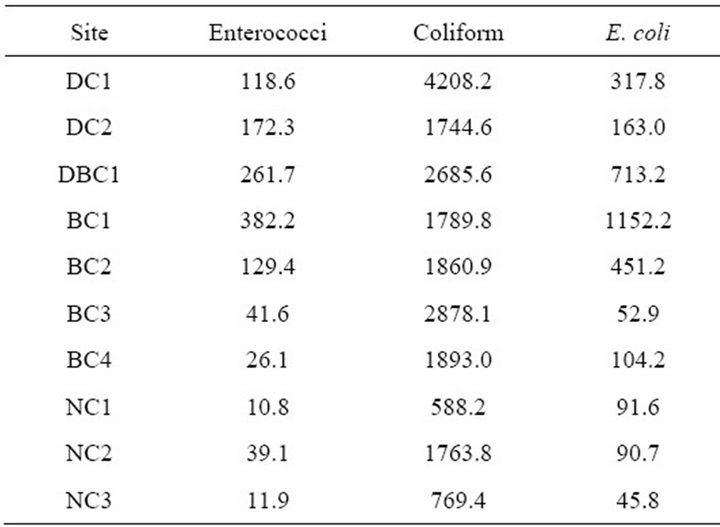
Table 5. IDEXX plating geometric means (MPN/100mL) for month of April 2010.
lem. Recently MST methods have emerged as a reliable approach to rapidly identify the source of fecal contamination in environmental samples based on the association of particular bacterial groups with specific host animals [14-16]. Although it was expected that a major source of fecal pollution in the cattle farming regions of the lake would be from cattle, MST with Bacteroidales markers for ruminant (RuBac) was used as a confirmatory test for the presence of cattle fecal pollution. A PCR SYBR Green assay for RuBac and HuBac was used to detect the presence of cattle and human fecal pollution in the water samples, respectively (Figure 2). The RuBac marker was detected at all the cattle farming sites except DC2. The HuBac marker was detected at four of the cattle farming sites and at two cattle free sites (Table 4). The detection of the RuBac marker at the cattle farming sites agrees with previous MST research that demonstrated that cattle are the major source of fecal pollution in this region of the Oconee watershed [8,19,28]. Even though we did not observe cross reaction between the HuBac primers and cattle fecal DNA in our controls, it was still possible that the detection of the HuBac marker in some of the cattle farming sites could be attributed to the tendency of this PCR assay to cross react with cattle fecal samples [15,29]. This reasoning is supported by the fact that there were no houses in close proximity to the cattle farms in the watershed. In addition recent MST research on fecal pollution in this area of the Oconee watershed has demonstrated that cattle are a major source of fecal pollution [19]. Therefore it appears that cattle fecal pollution was the likely source of stx2 gene and possible STEC in this region of the Oconee Watershed.
5. Conclusion
There were high levels of fecal indicator bacteria present in the cattle farming regions of the Oconee Watershed. Quantitative PCR was an effective means for detecting the presence of stx gene as a potential indicator of STEC in environmental samples and in this study the cattle farming regions were the only areas of the watershed where stx2 was detected. The presence of stx/STEC in the Oconee Watershed represents a potential public health risk because the water in this area is used for recreational and agricultural purposes.
6. Acknowledgements
This project was supported by a faculty development grant from Georgia College and State University.
REFERENCES
- M. Cooley, D. Carychao, L. C. Miksza, M. T. Jay, C. Myers, C. Rose, C. Keys, J. Farrar and R. E. Mendrell, “Incidence and Tracking of Escherichia coli O157:H7 in a Major Produce Production Region in California,” PLoS One, Vol. 2, 2007, Article ID: e1159. doi:10.1371/journal.pone.0001159
- Centers for Disease Control and Prevention, “Escherichia coli O157:H7,” National Center for Zoonotic, VectorBorne, and Enteric Diseases, Atlanta, 2010.
- K. Cobbaut, D. Berkvens, K. Houf, R. D. Deken and L. D. Zutter, “Escherichia coli O157 Prevalence in Different Cattle Farm Types and Identification of Potential Risk Factors,” Journal of Food Protection, Vol. 7, No. 9, 2009, pp. 1848-1853.
- R. O. Elder, J. E. Keen, G. R. Siragusa, G. A. BarkocyGallagher, M. Koohmaraie and W. W. Laegreid, “Correlation of Enterohemorrhagic Escherichia coli O157 Prevalence in Feces, Hides, and Carcasses of Beef Cattle during Processing,” Proceeding of the National Academy of Sciences, Vol. 97, No 7, 2000, pp. 2999-3003. doi:10.1073/pnas.97.7.2999
- A. M. Ibekwe and C. M. Greive, “Detection and Quantification of Escherichia coli O157:H7 in Environmental Samples by Real-Time PCR,” Journal of Applied Microbiology, Vol. 94, 2003, pp. 421-431. doi:10.1046/j.1365-2672.2003.01848.x
- T. H. Schmidt, G. Kardos, Z. Lancz, K. Creuzburg, Damjanova and I. B. Nagy, “Virulence Genes and Molecular Typing of Different Groups of Escherichia coli O157 Strains in Cattle,” Applied and Environmental Microbiology, Vol. 75, No. 19, 2009, pp. 6282-6291. doi:10.1128/AEM.00873-09
- P. Money, A. F. Kelly, W. J. Gould, J. Denholm-Price, E. J. Threlfall and M. D. Flelder, “Cattle, Weather and Water: Mapping Escherichia coli O157:H7 Infections in Humans in England and Scotland,” Environmental Microbiology, Vol. 12, 2010, pp. 2633-2644.
- D. S. Bachoon, T. W. Nichols, K. M. Manoylov and D. R. Oetter, “Assessment of Faecal Pollution and Relative Algal Abundances in Lakes Oconee and Sinclair, Georgia, USA,” Lakes and Reservoirs: Research Management, Vol. 14, 2009, pp. 139-149. doi:10.1111/j.1440-1770.2009.00396.x
- M. Muniesa, J. Jofre, C. Garcia-Aljaro and A. R. Blanch, “Occurrence of Escherichia coli O157:H7 and Other Enterohemorrhagic Escherichia coli in the Environment,” Environmental Science and Technology, Vol. 40, 2006, pp. 7141-7149. doi:10.1021/es060927k
- V. R. Hill, A. L. Polaczyk, D. Hahn, T. L. Narayanan, J. M. C. Roberts and J. E. Amburgey, “Development of a Rapid Method for Simultaneous Recovery of Diverse Microbes in Drinking Water by Ultrafiltration with Sodium Phosphate and Surfactants,” Applied Environmental Microbiology, Vol. 71, 2005, pp. 6878-6884. doi:10.1128/AEM.71.11.6878-6884.2005
- B. Mull and V. R. Hill, “Recovery and Detection of Escherichia coli O157:H7 in Surface Waters Using Ultra Filtration and Real-Time PCR,” Applied and Environmental Microbiology, Vol. 75, 2009, pp. 3593-3597. doi:10.1128/AEM.02750-08
- N. Jothikumar and M. W. Griffiths, “Rapid Detection of Escherichia coli O157:H7 with Multiplex Real-Time PCR Assays,” Applied and Environmental Microbiology, Vol. 68, No. 6, 2002, pp. 3169-3171. doi:10.1128/AEM.68.6.3169-3171.2002
- A. F. Maheux, F. J. Picard, M. Boissinot, L. Bissonnette, S. Paradis and M. G. Bergeron, “Analytical Comparison of Nine PCR Primer Sets Designed to Detect the Presence of Escherichia coli/Shigella in Water Samples,” Water Research, Vol. 43, 2009, pp. 3019-3028.
- G. H. Reischer, D. C. Casper, R. Steinborn, R. L. Mach and A. H. Farnleitner, “Quantitative PCR Method for Sensitive Detection of Ruminant Fecal Pollution in Freshwater and Evaluation of This Method in Alpine Karstic Region,” Applied and Environmental Microbiology, Vol. 72, 2006, pp. 5610-5614. doi:10.1128/AEM.00364-06
- A. Layton, L. McKay, D. Williams, V. Garrett, R. Gentry and G. Sayler, “Development of Bacteroides 16S rRNA Gene TaqMan Based Real-Time PCR Assays for Estimation of Total, Human, and Bovine Fecal Pollution in Water,” Applied and Environmental Microbiology, Vol. 7, No. 6, 2006, pp. 4214-4224. doi:10.1128/AEM.01036-05
- S. Mieszkin, J. P. Furet, G. Corthier and M. Gourmelon, “Estimation of Pig Fecal Contamination in a River Catchment by Real-Time PCR Using Two Pig-Specific Bacteroidales 16S rRNA Genetic Markers,” Applied and Environmental Microbiology, Vol. 75, No. 10, 2009, pp. 3045-3054. doi:10.1128/AEM.02343-08
- E. L. King, D. S. Bachoon and K. W. Gates, “Rapid Detection of Human Fecal Contamination in Estuarine Environments by PCR Targeting of Bifidobacterium adolescentis,” Journal of Microbial Methods, Vol. 68, 2007, pp. 76-81. doi:10.1016/j.mimet.2006.06.008
- C. Morrison, D. Bachoon and K. Gates, “Quantification of Enterococci and Bifidobacteria in Georgia Estuaries Using Conventional and Molecular Methods,” Water Research, Vol. 4, 2008, pp. 4001-4009. doi:10.1016/j.watres.2008.07.021
- C. D. Burt and D. S. Bachoon, “Evaluating the Input and Source of Fecal Contamination in the Cattle Farming and Forested Regions of the Oconee Watershed,” Journal of Environmental Protection, 2012, in press.
- State of Georgia Department of Natural Resources (GADNR), “Total Maximum Daily Load Evaluation Oconee River Basin (Fecal Coliform) SGDNR, Atlanta, Georgia, USA,” 2007.
- D. S. Fisher, A. L. Dillard, E. L. Usery, J. L. Steiner and C. L. Neely, “Water Quality in the Headwaters of the Upper Oconee Watershed,” In: K. J. Hatcher, Ed., Proceedings of the 2001 Georgia Water Resource Conference, Institute of Ecology, University of Georgia, Athens, 26-27 March 2001, pp. 198-200.
- P. S. Mead, L. Slutsker, V. Dietz, L. F. McCraig, J. S. Bresee, C. Shapiro, P. M. Griffin and R. V. Tauxe, “Food-Related Illnesses and Death in the United States,” Emerging Infectious Diseases, Vol. 5, 1999, pp. 607-625. doi:10.3201/eid0505.990502
- T. E. Besser, B. L. Richards, D. H. Rice and D. D. Hancock, “Escherichia coli O157:H7 Infection of Calves: Infectious Dose and Direct Contact Transmission,” Epidemiology & Infection, Vol. 127, 2001, pp. 555-560. doi:10.1017/S095026880100615X
- H. Fukushima and R. Seki, “High Numbers of Shiga Toxin-Producing Escherichia coli Found in Bovine Faeces Collected at Slaughter in Japan,” FEMS Microbiology Letters, Vol. 238, 2004, pp. 189-197.
- A. P. Williams, L. M. Avery, K. Killham and D. L. Jones, “Persistence, Dissipation, and Activity of Escherichia coli O157:H7 within Sand and Seawater Environments,” FEMS Microbiology Ecology, Vol. 60, 2007, pp. 24-32 doi:10.1111/j.1574-6941.2006.00273.x
- J. Bai, X. Shi and T. G. Nagaraja, “A Multiplex Procedure for the Detection of Six Major Virulence Genes in Escherichia coli O157:H7,”Journal of Microbiological Methods, Vol. 82, 2010, pp. 85-89. doi:10.1016/j.mimet.2010.05.003
- P. A. Chapman, “Methods Available for the Detection of Escherichia coli O157:H7 in Clinical, Food and Environmental Samples,” World Journal of Microbiology and Biotechnology, Vol. 16, 2000, pp. 733-740. doi:10.1023/A:1008985008240
- B. Fremaux, C. Prigent-Combaret, M. L. Delignette-Muller, M. Dothal and C. Vernozy-Rozand, “Persistence of Shiga Toxin Producing Escherichia coli 026 in Cow Slurry,” Letters in Applied Microbiology, Vol. 45, 2007, pp. 55-61. doi:10.1111/j.1472-765X.2007.02146.x
- D. S. Bachoon, C. M. Miller, C. P. Green and O. Ernesto, “Comparison of Four Polymerase Chain Reaction Methods for the Rapid Detection of Human Fecal Pollution in Marine and Inland Waters,” International Journal of Microbiology, Vol. 2010, 2010, pp. 595-692. doi:10.1155/2010/595692
NOTES
*Corresponding author.