American Journal of Industrial and Business Management
Vol.09 No.01(2019), Article ID:90102,14 pages
10.4236/ajibm.2019.91016
The Labor Productivity Slowdown: The True Issue of the Italian Economy
Paola Parravicini, Alessandro Graffi
C. Beccaria Department, University of Milan, Milan, Italy

Copyright © 2019 by author(s) and Scientific Research Publishing Inc.
This work is licensed under the Creative Commons Attribution International License (CC BY 4.0).
http://creativecommons.org/licenses/by/4.0/


Received: December 26, 2018; Accepted: January 20, 2019; Published: January 23, 2019
ABSTRACT
This paper deals with the issue of the weak growth in Italian labor productivity with particular reference to the period between 2000 and 2016. In analyzing the data relating to labor productivity, the influence of capital productivity and multifactor productivity were also considered. The analysis shows how the weak growth in labor productivity is due to some peculiar structural aspects of the Italian production system. At the end of the paper some comments are offered on possible policy interventions.
Keywords:
Labor Productivity, Capital Productivity, Multifactor Productivity

1. Introduction
The diseases of the Italian economy can be seen in its high public debt, its low GDP growth and its difficulty in respecting the parameters set by the European Union [1] . All of this is undoubtedly true. However, Italy’s actual difficulties probably arise from a different problem. Italy’s real problem is represented by a very low growth in labor, capital and multifactor productivity [2] .
After the Second World War and up to the early 70s, Italy, like most other OECD countries, had a remarkable, rapid growth in productivity, becoming a fully-fledged member of those countries having the best potential for development. From the 70s onwards, the situation changed radically because of the oil shocks. The slowdown in productivity seemed to be much more marked in Italy after 1993 than in other countries [3] .
As Paul Krugman said [4] , “Productivity isn’t everything but, in the long run, it is almost everything.” As many authors claim, read for all the papers the contribute of van Ark et al. [5] , since the mid-1990s labor productivity growth in Europe has significantly slowed compared to earlier decades, while in the United States accelerated, so that a new productivity gap has opened up.
In this paper the period between 2000 and 2016 has been analyzed from various perspectives. First of all, the dynamics of labor productivity, the only for which an international comparison could be made, was analyzed. Next, the changes in Italian capital productivity and in what is known as multifactor productivity (MFP) were analyzed. Finally, we decided to focus on the components of labor productivity, capital deepening and MFP, in order to identify the possible causes of the slowdown in Italian labor productivity. After some consideration on the structural causes of this phenomenon, some attempt was made to propose possible solutions to the problem.
The paper proceeds as follows. Section 2 contains an international comparison of labor productivity growth and an analysis of the possible consequences on unit labor costs and on real wages. Section 3 investigates both the dynamics of the capital and multifactor productivity and the components of labor productivity, still relating Italy to other countries. Section 4 presents some possible causes of the poor growth of Italian labor productivity. Section 5 concludes.
2. Labor Productivity: An International Comparison
With regard to labor productivity growth1 (Table 1), it can be seen that Italy is ranked last amongst OECD countries in the period between 2000 and 2016 [6] .
The two countries with the most marked catching up are Latvia and Lithuania; however, despite having almost doubled their labor productivity, they are still very far from achieving the same Italian labor productivity levels. The most striking value is undoubtedly that of Ireland, which has almost doubled its labor productivity in 16 years, despite starting from values only slightly lower than those of Italy [7] . In the period 2000-2016, the average annual growth of labor productivity in Italy was definitely lower than that of the EU19 area (15.4%). As regards Italy’s major competitors, Germany shows an 18.6% increase and France and Spain record labor productivity growth rates of 13.5% and 15.3% respectively, slightly below the Euro area average. Even Greece, with a growth rate much lower than the European average (6.5%), has a much better performance than Italy, which shows a disastrous growth rate of less than 1%. The National Statistics Institute (ISTAT) recently published a report confirming this data [8] .
Some considerations on Unit Labor Costs could be useful to support these observations. Unit labor costs (ULCs) measure the average cost of labor per unit of output. They are calculated by OECD Stat, as the ratio of total labor costs to real output. Annual ULCs can be expressed as the ratio of total labor compensation per hour worked to output per hour worked (labor productivity).

Table 1. Labor productivity (GDP per hour worked, US Dollars, constant prices, 2010 PPPs). Souce: OECD Stat dara and authors’ elaborations.
The dynamics of Unit Labor Costs in the Eurozone since 2000 have been widely divergent: in Germany the ULCs increased slightly (thanks also to the 2004 Hartz reform [9] of the labor market which maximized mini-jobs), whilst it grew strongly in all Eurozone countries (Figure 1).
In Germany, although the overall cuts in hours for workers were consistent with the severity of the Great Recession, reduction of working time account balances substituted for traditional government-sponsored short-time work. The situation in Greece is worthy of note: ULCs grew significantly until 2009 and then continuously decreased, particularly in the period between 2011 and 2014. The trend in Spain is similar to that of Greece. In both these countries, therefore, there seems to have been a more immediate response on the labor market due to the greater impact of the international crisis. In all the other main Euro area countries, and in the United States, Unit Labour Costs have instead continued to increase. The dynamics of ULCs in Japan have been completely different: they have been decreasing steadily since 2000.
In Italy, ULCs have been steadily increasing (+39.5%) and to a greater extent than in the other countries considered. This higher ULCs growth in Italy could be easily understood if we compare this data with that relating to the changes in the Italian nominal wage from 2000 to 2016 (Figure 2). The trend in ULCs is in fact the result of the both the trend in the labor compensation per hour worked and in labor productivity.
As can be seen from Figure 2, the increase in ULCs in Italy is due to a constant growth in labor compensation per hour worked (+40.2%), which is not accompanied by an adequate increase in labor productivity (+0.9%).
Next, the relationship between labor productivity and real wages should be considered.
Figure 3 shows the percentage change in labor productivity and the percentage change in real wages for different countries in the period between 2000 and 2016. In general, real wage growth is closely and positively related to labor productivity. If we look at the Italian situation, we can see that in Italy a low growth in labor productivity has essentially been associated with a low growth in real wages. This figure is even more significant when we compare Italy to the United States, where high increases in labor productivity have been associated with high increases in real wages. Situations similar to that of the United States are also evident for Italy’s main European competitors (Germany, France, Spain and the UK).
As regards the changes in real wages, OECD data shows that the effects of the economic crisis appear to have hit some European countries more than others. In the case of Greece, which has particularly suffered from the international crisis due to an already serious internal situation, real wages have fallen dramatically since 2009 and the same is true in Spain.

Figure 1. Unit Labor Costs Index (average cost of labor per unit of output, 2000-2016). Souce: authors’ elaborations on OECD data.
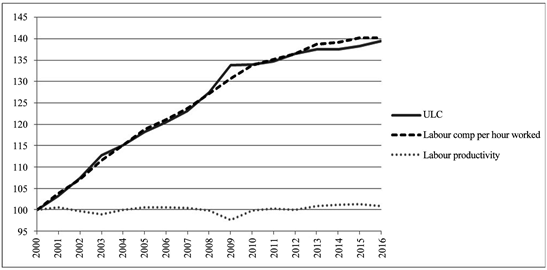
Figure 2. The evolution of ULCs and its components. Italian situationn 2000-2016. Souce: authors’ elaborations on OECD Stat data.
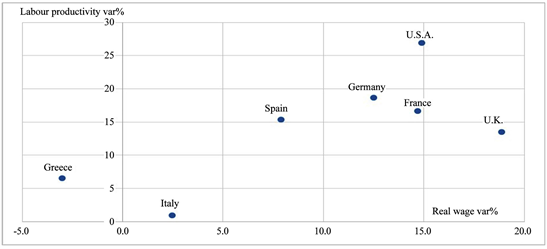
Figure 3. Labor productivity and real wage % (2000-2016). Souce: authors’ elaborations on OECD Stat data.
A similar slight decline in real wages can be observed both in the United Kingdom and, just more marked, in Italy. Peculiar and unusual is the case of France, but above all of Germany and the USA: in these countries, despite the international crisis, real wages are continuing to grow together with a strong increase in labor productivity. This shows that where labor productivity grows intensely and continuously, the economic crisis has no impact on real wages, which already tend to be rigid downwards. Real wages are thus proving to be a structural rather than a cyclical variable.
All of the above is also supported when we look at the inflation trend: in Italy, nominal wages are growing in parallel with inflation, whilst real wages and labor productivity, as it has been seen, are actually remaining constant. In France, the increase in labor productivity was almost entirely passed on to the workers who received higher nominal, but also higher real, wages. Germany, instead, had a different policy: in this case, the increase in labor productivity was only partially reflected in an increase in real wages. The increased productivity was not entirely passed on the workers but, instead, mostly benefitted the German firms, which were thus able to gain ground in terms of competitiveness.
In other words, countries with lower growth in labor productivity tend, on the one hand, to have lower growth in real wages and therefore in domestic demand and, on the other hand, to have higher growth in ULCs. And this would probably have negative consequences as regards their foreign demand. Lower labor productivity therefore leads to lower growth in aggregate demand and, consequently, lower economic growth.
3. From Capital Productivity to the Components of Labor Productivity
As regards capital productivity, by contrast,2 the situation of the various countries considered appears to be characterized by a collective decline since 2000, with marked drops in the period between 2007 and 2009 (Figure 4).
From 2009 onwards, the situation ceases to be homogeneous. Germany and Japan show a considerable increase in capital productivity, which substantially returns to the levels prior to the international crisis. The USA and the United Kingdom stabilize after the 2007-2009 setback. Spain shows a continuous and striking decrease in capital productivity (data are available until 2015) and this decrease is likewise recorded in France, albeit to a much lesser extent. As for Italy, there is a constant, marked drop in capital productivity until 2013, although there is a modest recovery in the last three years considered.
What is striking, however, is that, with the exception of Germany and Japan,

Figure 4. Capital Productivity Index 2010-2016. Source: authors’ elaborations on OECD Stat data.
capital productivity shows a strong tendency to reduce. This situation is probably the result of the increased use of capital input (ICT and non-ICT) which leads to a reduction in capital productivity, reduction that has been particularly accentuated by the international crisis and, probably, by a gradually increasing rigidity in output with respect to the use of this input.
With particular reference to the Italian situation (Figure 5), it can be seen that the reduction in capital productivity is the result of both the steady increase in total capital services3 and the poor growth in GDP. The increase in Italian total capital services was in line with that in Germany (+27.5% in Italy and +26.2% in Germany), but decidedly lower than in Spain (+82%), the USA (+55%), the United Kingdom (+48%) and France (+47%).
However, the composition of total capital services is worth a mention. It includes both ICT capital (computer hardware, telecommunications equipment, computer software and databases) and non-ICT capital (transport equipment, other machinery and equipment and weapons systems, non-residential construction, research and development and other intellectual property products). In all the countries considered in the analysis, the greatest change in total capital services was that in ICT capital. This data provides clear evidence of technological change and its ongoing transformation and reflects the impact of what is commonly referred to as the “fourth industrial revolution”. This is particularly evident if one considers that the increase in ICT capital was greater in Germany (+190%), i.e. precisely where the first steps in the industrial response (Industry 4.0) to the fourth revolution were taken.
The third productivity to be considered is the total factor (multifactor) productivity. Growth in multifactor productivity (MFP) “is measured as a residual, e.g. that part of GDP growth that cannot be explained by growth in labor and capital inputs. Traditionally, MFP growth is seen as capturing technological progress but, in practice, this interpretation needs some caution. First, some part of technological change is embodied in capital input, e.g. improvements in design and quality between two vintages of the same capital asset, and so its effects on GDP growth are attributed to the respective factor. MFP only picks up disembodied technical change, e.g. network effects or spillovers from production factors, the effects of better management practices, brand names, organizational change and general knowledge. Second, data and resource constraints hamper a precise measurement of labor and capital input, affecting MFP. Moreover, MFP also captures other factors such as adjustment costs, economies of scale and effects from imperfect competition.” [11]
As can be seen from Figure 6, with the exception of Spain and Italy, MFP increased significantly in all the countries considered, with peaks of 15% in the USA and 11% in Germany. In Italy, however, MFP has actually decreased (?6%) since 2000 [12] [13] . This data must be seen in relation with the poor Italian labor productivity growth. In fact, MFP, together with capital deepening, is one of the determinants of labor productivity. In the Solow growth accounting model [14] , there is a close link between changes in labor productivity and MFP. If we assume that labor input corresponds to the total hours worked (disregarding the change in composition of the labor force), it follows that the rate of growth in the value added per hour worked (i.e., the rate of growth in labor productivity) is equal to the sum of the rate of growth in capital input per hour worked (capital deepening) and the rate of growth in MFP (which in this model coincides with technological progress) [8] .

Figure 5. Capital productivity, Total Capital Services and GDP Indexes. Italian situation 200-2016. Source: authors’ elaborations on OECD Star data.
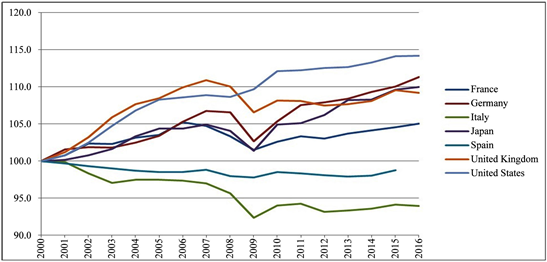
Figure 6. Miltifactor Productivity Index 2000-2016. Source: authors’ elaborations on OECD Stat data.
Capital deepening, or the capital intensity index (Figure 7), shows a more or less evident increase for all the countries considered until 2013. The figure for Spain is noteworthy as it shows a frenetic growth until 2014. Once more, we can note that the international crisis caused a setback even in the capital deepening growth process in all countries.
However, the Italian situation is different. After the characteristic growth seen in all countries, Italy is the only one to have recorded a drop since 2013 and this decrease became more significant from 2015 onward. This fact is already implicit from the trend in total capital services (Figure 5). Capital deepening is inevitably affected by the effect of spending on research and development (R&D) and technological innovation, and this could be a valid reason for the different performance of the changes in Italian capital deepening compared to other countries.
Figure 8 shows the overall situation of the change in labor productivity in Italy

Figure 7. Capital Deepening Index 2000-2016. Source: authors’ elaborations on OECD Stat data.

Figure 8. The evolution of labor productivity and its components. Italian situation 2000-2016. Source: authors’ elaborations on OECD Stat data.
when its two components (capital deepening and multifactor productivity) are considered too.
It is clear that the change in Italian labor productivity is strongly influenced by the trend in MFP, while the trend in capital deepening has little effect. As capital deepening indicates an intensification in the use of capital-intensive techniques (and not simply a widening of capital stock), it can be argued that the Italian production structure, which is characterized by small and medium sized firms, did not allow an adequate use of the various types of capital. Added to this is the fact that the small size of the average Italian firm actually prevents adequate R&D investments, which could have a positive impact on multifactor productivity.
Besides, the effect of the interest rates reduction definitely had a lower impact in Italy than in other countries because of the high burden of its public debt. There has been less, and probably poorer, investment. In addition, small-medium sized Italian firms have greater difficulty accessing credit on the financial markets.
If we also look at Figure 9, we can immediately see that Italian labor productivity growth has been characterized by a low ICT capital deepening component (in fact, it has actually reduced over time) and by a multifactor productivity component which has actually been negative in some years.
4. An Analysis of the Possible Causes of the Poor Growth in Italian Labor Productivity
The analysis shows that from 2000 to 2016 Italy recorded a very weak growth in labor productivity, especially when compared with that of its main competitors. It is also obvious that this situation is the result, on the one hand, of lower ICT capital and mainly, on the other hand, and in contrast to other countries, of a reduction in multifactor productivity.
The structure of Italy’s comparative advantages highlights the fact that this still predominantly manufacturing country has an atypical international production specialization compared to the other highly industrialized Western countries. In fact, it is oriented towards traditional sectors4 (leather goods and footwear, textiles, clothing, furnishings and furniture). These typical “made in Italy” sectors are unskilled-labor-intensive and low-technology-based. This means that labor productivity is in itself low and has less potential for growth. These characteristics have inevitably had an influence on the low use of ICT technologies [15] [16] .
On the other hand, if we exclude the specialized mechanical sector (machinery and mechanical equipment), the Italian manufacturing production structure is very weak in the scale-intensive, skilled-labor-intensive and high-technology-based sectors. These sectors traditionally have higher labor productivity because they are more R&D and capital intensive, with a higher potential for the use of new ICT technologies. Only in recent years it has been possible to observe a reduction in the Italian comparative disadvantages in some of these sectors; sectors which feature strong economies of scale and high R&D intensity (pharmaceuticals, aircraft and spacecraft).
The Italian model of production specialization is closely linked with the average size of Italian firms. As it has in fact already been mentioned, Italian firms are mainly small and medium-sized: in 2016 approximately 99% of Italian firms had less than 50 employees. This is not insignificant when we consider that this figure represents 66% of Italian employment in the private sector and over 50% of the added value [17] . The small size of Italian firms does not allow economies of scale to be exploited and for many years the focus of policy makers has been directed on the possibility of overcoming this limitation by promoting the creation of industrial districts. On the other hand, small and medium-sized Italian firms have struggled, and are continuing to struggle, to access credit on the financial markets, thus obtaining less investment opportunities. They have thus suffered further from the credit crunch generated by the international economic crisis.
A further element is added to all the above. In countries which, like Italy, are characterized by a manufacturing-type production structure, there has been a considerable development in the advanced producer services sector. This sector is skilled-labor-intensive and therefore has a high use of human capital and ICT technologies. However, in Italy this crucial sector has not been developing with the same intensity.
Moreover, in Italy the percentage of graduates amongst people aged between 25 and 34 is still very low (27%) if compared to the OECD average (44%) and the percentage of Italian graduates with scientific skills is equally poor [18] .
This has inevitable negative consequences on Italian human capital and has a negative effect on its R&D activity.
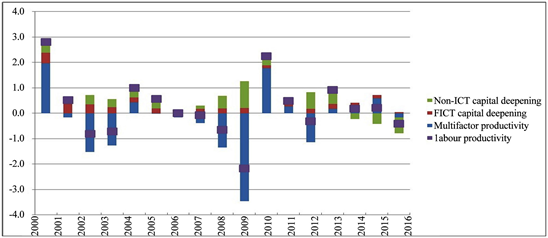
Figure 9. Italy, percentage point contribution to labor productivity growth, annual, 2000-2016. Source: authors’ elaborations on OECD Stat data.
Such activity is undoubtedly low in Italy compared to the major industrialized countries and is, moreover, mainly focused on “basic research”. In addition, this R&D is mainly undertaken with public funding, once again because of the small size of Italian firms.
Last but not least, the efficiency of the Italian system must be considered. The World Bank’s Doing Business [19] reports have long underlined the difficulties of “doing business” in Italy. Despite an improvement in performance compared to previous years, the World Bank positions Italy in 46th place out of 190 as regards the ease of doing business. However, this puts Italy in last places amongst OECD countries. Although, on the one hand, Italy performs well in the trading across borders rank (time and cost to export the product of comparative advantage and import auto parts), in the registering property rank (procedures, time and cost to transfer a property and the quality of the land administration system), and in the resolving insolvency rank (time, cost, outcome and recovery rate for a commercial insolvency and the strength of the legal framework for insolvency), the same cannot be said for other indicators. In particular, Italy is in position 105 in the getting credit rank (movable collateral laws and credit information systems), in position 108 in the enforcing of contracts rank (time and cost to resolve a commercial dispute and the quality of judicial processes), and in position 112 in the paying taxes rank (payments, time and total tax and contribution rate as a result of all tax regulations as well as post-filing processes).
This result highlights the Italian Public Administration’s lack of efficiency and, as regards the getting credit rank, the difficulties firms have in obtaining the necessary financing for the flow of investments which guarantee competitiveness. Naturally, this last data confirms the previously statements and contributes to the generation of a climate of substantial distrust amongst foreign investors as regards Italy.
5. Conclusions
This paper certainly deserves further insights but some preliminary observations can already be made.
The problem of productivity is undoubtedly one of the most debated issues in the economic, political and social world. The Italian situation is an interesting “workshop” for analysis and proposals of possible solutions. What is obvious is that multifactor productivity must be stimulated as growth in production systems is greatly reliant upon it. In reality, even though it may seem like an easy problem to solve, the actual definition of multifactor productivity demands complex reflections about its various components. One possible way forward could be to identify the sectors in which the effect of technology and human capital appear to be more relevant. In Italy the mechanical, chemical and manufacturing sectors in general could be the most fertile areas for work. An increase in R&D investment in these sectors could, together with a decided and informed reform of the education sector, already guarantee results in the medium term.
It also appears urgent to add to this an equally informed and committed digitalization of public administration which would allow the public sector to be more efficient with positive consequences for the private sector.
Naturally, in order to increase productivity it is also necessary to intervene on the demand side, especially given the certainty that real wages, closely linked to labor productivity and held fixed by the stagnation in demand, end up depressing the need to replace labor with capital. In other words, the way forward is to invest in ICT capital. However, doing so requires a farsighted credit and financial sector which once more believes, and therefore invests, in the production system and so embraces the collective interest and abandons individual interests.
Nevertheless, this is not enough. The second essential pillar is human capital. It is more than ever urgent and important to invest in training and in education in order to deal positively with the consequences of the fourth industrial revolution.
Acknowledgements
The authors wish to thank the anonymous referee for the useful suggestions.
Conflicts of Interest
The authors declare no conflicts of interest regarding the publication of this paper.
Cite this paper
Parravicini, P. and Graffi, A. (2019) The Labor Productivity Slowdown: The True Issue of the Italian Economy. American Journal of Industrial and Business Management, 9, 253-266. https://doi.org/10.4236/ajibm.2019.91016
References
- 1. OECD (2018) Economic Outlook. Italy—Economic Forecast Summary, November. http://www.oecd.org/eco/outlook/economic-forecast-summary-italy-oecd-economic-outlook.pdf
- 2. Coelli, T., Rao, D.S.P., O’Donnel, C.J. and Battese, G.E. (2005) An Introduction to Efficiency and Productivity Analysis. 2nd Edition, Springer, Berlin.
- 3. Giordano, C., Toniolo, G. and Zollino, F. (2018) Long Run Trends in Italian Productivity. Questioni di Economia e finanza (Occasional Papers). Bank of Italy, No. 406.
- 4. Krugman, P. (1990) The Age of Diminished Expectations. 3rd Edition, MIT Press, Cambridge, Massachusetts, London.
- 5. van Ark, B., O’Mahoney, M. and Timmer, M.P. (2008) The Productivity Gap between Europe and the United States: Trends and Causes, Journal of Economic Perspectives, 22, 25-44. https://doi.org/10.1257/jep.22.1.25
- 6. Färe, R., Grosskopf, S., Norris, M. and Zhang, Z. (1994) Productivity Growth, Technical Progress, and Efficiency Change in industrialized Countries. American Economic Review, 84, 66-83.
- 7. Mas, M., Milana, C. and Serrano, L. (2012) Spain and Italy: Catching Up and Falling Behind. Two Different Tales of Productivity Slowdown. In: Mas, M. and Stehrer, R., Eds., Industrial Productivity in Europe. Growth and Crisis, Edward Elgar Publishing Ltd., Cheltenham, 161-191. https://doi.org/10.4337/9780857932105.00014
- 8. Istat (2018) Misure di produttività, anni 1995-2017. https://www.istat.it/it/files//2018/11/Misure-produttivita__ottobre2018.pdf
- 9. Burda, M.C. and Hunt, J. (2011) What Explains the German Labor Market Miracle in the Great Recession? The National Bureau of Economic Research, NBER Working Paper No. 17187.
- 10. OECD (2001) Measuring Productivity. OECD Productivity Manual: A Guide to the Measurement of Industry-Level and Aggregate Productivity Growth. OECD, Paris. http://www.oecd.org/sdd/productivity-stats/2352458.pdf
- 11. Solow, R.M. (1957) Technical Change and the Aggregate Production Function. Review of Economics and Statistics, 39, 312-320. https://doi.org/10.2307/1926047
- 12. Milana, C., Nascia, L. and Zeli, A. (2013) Decomposing Multifactor Productivity in Italy from 1998 to 2004: Evidence from Large Firms and SMEs Using DEA. Journal of Productivity Analysis, 40, 99-109. https://doi.org/10.1007/s11123-013-0337-z
- 13. Dosi, G., Grazzi, M., Tomasi, C. and Zeli, A. (2012) Turbulence Underneath the Big Calm? The Micro-Evidence behind Italian Productivity Dynamics. Small Business Economics, 39, 1043-1067. https://doi.org/10.1007/s11187-011-9326-7
- 14. Solow, R.M. (1956), A Contribution to the Theory of Economic Growth. Quarterly Journal of Economics, 70, 65-94. https://doi.org/10.2307/1884513
- 15. Milana, C. and Zeli, A. (2002) The Contribution of ICT to Production Efficiency in Italy: Firm-Level Evidence Using Data Envelopment Analysis and Econometric Estimations. STI Working Paper 2002/13, OECD, Paris.
- 16. Milana, C. and Zeli, A. (2004) Productivity Slowdown and the Role of ICT in Italy: A Firm-Level Analysis, In: OECD, Ed., The Economic Impact of ICT. Measurement, Evidence and Implications, OECD, Paris, 261-277. https://doi.org/10.1787/9789264026780-13-en
- 17. Istat, I. Stat. http://dati.istat.it/
- 18. OECD (2018) Education at a Glance. http://www.oecd.org/education/education-at-a-glance/
- 19. World Bank (2018) A World Bank Group Flagship Report, Doing Business 2018 Reforming to Create Jobs. http://www.doingbusiness.org/content/dam/doingBusiness/media/Annual-Reports/English/DB2018-Full-Report.pdf
NOTES
1Labour productivity growth represents a higher level of output for every hour worked. This can be achieved if more capital, such as machinery or software or better vintages of it (capital deepening) is used in production, or by improving the overall efficiency with which labor and capital are used together, i.e. higher MFP. In the growth accounting framework, it is possible to decompose labor productivity growth into the contribution of capital deepening and multifactor productivity growth.
2Capital productivity shows how efficiently capital is used to generate output. It reflects the joint influence of labor input per unit of capital used and multifactor productivity (MFP); the latter reflecting the overall efficiency of production. Capital productivity is measured as the ratio between the volume of output (GDP), and the volume of capital input, defined as the flow of productive services that capital delivers in production, i.e. capital services. These services are estimated by the OECD using the rate of change of the productive capital stock, which takes into account wear and tear, retirements and other sources of reduction in the productive capacity of fixed capital assets. To ensure comparability across countries, the OECD capital services measures are based on a common computation method for all countries. See [10] .
3For productivity analysis, the preferred measure of capital input is the flow of productive services that can be drawn from the cumulative stock of past investments. These services are estimated by the OECD using the rate of change of the productive capital stock, which takes into account wear and tear, retirements and other sources of reduction in the productive capacity of fixed capital assets. The price of capital services per asset is measured as their rental price. In principle, the latter could be directly observed if markets existed for all capital services. In practice, however, rental prices have to be imputed for most assets, using the implicit rent that capital goods’ owners “pay” to themselves (or the user costs of capital). Estimates of capital services in the OECD Productivity Database can be broken down by eight types of assets: computer hardware, telecommunications equipment, transport equipment, other machinery and equipment and weapons systems, non-residential construction, computer software and databases, research and development and other intellectual property products. To ensure comparability across countries, the OECD capital services measures are based on a common computation method for all countries. See [10] .
4However, since the 1990s a weakening in the international specialisation of the Italy in these sectors has been observed due to competition from emerging countries, which have a high degree of specialisation in these same sectors. This trend continued in the following decade and in the years of the great international economic crisis.