American Journal of Industrial and Business Management
Vol.06 No.03(2016), Article ID:65285,9 pages
10.4236/ajibm.2016.63035
Social Media Sentimental Analysis in Exhibition’s Visitor Engagement Prediction
Tian-Shyug Lee, Ben-Chang Shia, Chung-Ling Huh*
Graduate Institute of Business Administration, Fu-Jen Catholic University, Taiwan

Copyright © 2016 by authors and Scientific Research Publishing Inc.
This work is licensed under the Creative Commons Attribution International License (CC BY).
http://creativecommons.org/licenses/by/4.0/


Received 19 February 2016; accepted 28 March 2016; published 31 March 2016
ABSTRACT
In the internet age, social media and mobile devices are the most important tools of communication and marketing in the exhibition and event industry. Only a limited research has explored exhibition visitors’ engagement and preference perception through social networking media. Our study explores relationship between Facebook fan pages and visitor engagements of the exhibitions. The study found that the number of visitors, Facebook fans like counts, comment counts, and emotional factors (sentiment polarity) have a significant positive correlation. On the other hand, numbers of visitor rapidly grow every year, but comment sentiment polarity of a positive emotion drops every year. This reduction is the warning sign that the exhibition management and marketing strategy need to be improved in order to continue to have a positive visitor engagement emotion. Our linear Discriminate Analysis (LDA) result found that visitors were highly concerned with gamification activities for an incentive prize both to create involvement and to enhance exhibition experience. Our finding also shows the relevance of both FB like counts and comments generated by social media in relation to the visitor engagement performance. This pioneer study utilized both text mining and sentimental analysis into the exhibition study, especially the area of Asian research.
Keywords:
Social Media, Text Mining, Sentimental Analysis, Engagement

1. Introduction
Social media and mobile devices have grown as important tools of communication and marketing in the exhibition and event industry. A limited amount of research has explored the subject of exhibition visitors’ engagement preference perception through social networking media.
Microsoft offers a Social Engagement platform for a company to collect data from social media sites (Facebook, Twitter or blog). The company can find insight information from both customers & message posted by stockholders to predict and resolve potential problems.
Social media marketing has been dubbed the “word of mouth” marketing of the internet age. Social marketing was defined as “seeking to influence social behaviors not to benefit the marketer, but to benefit the target audience and the general society”. Word cloud delivers a two-way communication link between the customer and the brand (Patterson et al., 2009 [1] ). The social media marketer is required to tap into an existing flow of information and seed positive communications between individuals and groups in virtual social networks.
Social media retained a large data of users and their personal interaction with friends, for computer scientists, social scientists, economists, and statisticians. This data now provide new opportunities for research and application. Examples of social media data are the number of pasted text, the number of click on like, comment, share and other information to be used as prediction variables. From 2006 to 2012, social media data as prediction- based studies have had rapid growth from 0% to 18%. Social media data have also become popular in forecasting studies (Schon et al., 2013 [2] ).
China economy has increased for decades, Asia exhibition research has become unique and important. National Taiwan University (NTU) sentimental classification technology for Chinese language classification has become important and has increased our motivation for Asia research.
In our study, Taiwan exhibitions have been chose for it, globally renowned for its highly-developed 3C industry, the integration of social media and technologies such as APPs, QR-Codes, Facebook, RFID, and free-of- charge Wi-Fi, all of which have been applied to exhibition activities, offering advanced, convenient, and real- time services to exhibition visitors. Taiwan has a number of international standards exhibition venues which include the TWTC Halls (1, 2, 3) and Taipei Nankang Exhibition Hall. The southern Kaohsiung Exhibition Center officially opened to provide more exhibition space. In addition, more MICE venues, the Taichung Convention and Exhibition Center, and the Taoyuan Aerotropolis International Convention and Exhibition Center, have helped to lead Taiwan’s MICE industry into a new area.
According to The Global Association of the Exhibition Industry (UFI) report on The Trade Fair Industry in Asia, there are five UFI-sanctioned exhibition halls in Taiwan. At these halls, 89 exhibitions were recorded, and Chinese Taipei ranked 6th in Asia for total exhibition space sold (716,250 square meters). Advanced IT and communication technologies, plus mature industrial clusters will strengthen Taiwan’s global competitiveness. (Meettaiwan, 2015 [3] )
We understand that exhibition visitor preferences are very important for Professional Exhibition Organizer (PEO) as it carries out its exhibition’s design management and marketing planning. Exhibition organizers should determine the visitor preferences for the usage of social networking platforms to extract visitor a positive emotion and attitude toward to the exhibition for commitment to exhibition engagements.
Our research objective: 1) we use the text mining technic in social media to explore the relationship between the visitors’ sentimental preferences & the number of visitors; 2) we use the engagement model development to discover the correlation between fan page messages and visitor engagements; 3) we provide both PEO & PCO guidelines when implementing exhibition management.
2. Literature Review
A common metric of social engagement is the quantifiable volume of activity. A traditional form of social engagement, such as church going, may be measured by the number of one’s visits to the church. In the Internet setting a metric of social engagement on a discussion board may take the form of the number of posts made (Prohaska, Anderson & Binstock, 2012 [4] ).
Fredricks, Blumenfeld, and Paris (2004) [5] have described three types of engagement: behavioral (participating), emotional (valuing), and cognitive (making a concerted effort).
Ahn (2013) [6] used text mining on some customers’ perception of brand images. Users share their experiences and sentiments about both an event and brands which as a result of a data analysis, provides an understanding of the market in real-time.
Littlewood and Bick (2014) [7] proposed the social media value chain framework with three key areas. The first area is Customer engagement activities, second area is online monitoring of communication by the social media, and the third area is the utilization of metrics to measure the social media effectiveness to the drivers of success of social media campaigns. Research has confirmed the importance of setting strategies and objectives in order to measure returns by means of word of mouth, trust, loyalty and authentic business. Social media applications are broken down into three social media objectives, which include: brand awareness, brand engagement and word of mouth.
Guo and Chan-Olmsted (2015) [8] perceptions, social media characteristics, and audience attributes were proposed to predict the social engagement experience. This investigation tested audience motives for using social media to engage with television content. Social engagement refers to the degree of interactions or connections. The core component of the construct, “social engagement”, is engagement. It was suggested that engagement is primarily driven by program content in the television consumption context, and the deepest engagement experience.
By means of a sentimental analysis of the National Taiwan University (NTU) Sentiment Dictionary, users may express their thoughts towards an exhibition via the fans page. Such opinions can affect others’ opinions on the exhibition. If most of the fans are looking forward to the upcoming exhibition, we will have a higher confidence to predict a higher visitor rate for the new exhibition. Thus we propose to analyze the polarity (i.e. positive or negative) of users’ posts and replies on a face book fans page. During the prediction period, we count the total number of positive/negative words in the posts and replies and normalize these values as “opinion features”. We adopt the NTU Sentiment Dictionary to generate opinion features.
Visualization technology tools invented since 2008, and a growth in graphics has risen exponentially. Between 2011 and 2013, an average of 110 new infographics were created and published for the world to see every day (DeMers, 2013). Word cloud use the most frequently used words in text and randomly displays them by size. Word clouds also display words in different colors and shape in order to a pleasing look (de Noyelles & Reyes-Foster, 2015 [9] ).
Linear discriminant analysis (LDA) has been widely used as a feature extraction method in pattern recognition applications such as face and gesture recognition, mobile robotics, and hyperspectral image analysis, as well as text mining of knowledge discovery applications. The LDA searches the directions for the maximum discrimination of classes in addition to the dimensionality reduction (Ghassabeh & Moghaddam, 2013 [10] ).
3. Data Collection & Research Method
Our study objective, the Taipei International Tourism Expo (TTE), is held in every year at the Taipei World Trade Center. Exhibitors include the Tourism Bureau of Taiwan, the central and local county and city governments, domestic and overseas airlines, five-star hotels, amusement parks, resorts, and the mainland Tourism Bureau. In 2015 this exhibition consisted of more than 1200 booths of 450 exhibitors in the Taipei World Trade Center Hall 1. Exhibition visitors also reached a record high of 282,865 visitors, compared with 2014, which was a growth of 10%.
Facebook is favorite social media of people in Taiwan. More than 15 million participate monthly, of which 13 million participate by means of mobile devices. The ages range between 25 years to 34 years make up the main proportion (FB, Reports First Quarter 2015 Results, 22 April 2015 [11] ). Our research framework includes data collection, data preparation (pre-processing), select variables (features selection), and statistical analysis (Oh et al., 2015 [12] ).
Research Method
1) Text mining in the TTE Facebook fan page, term frequency analysis in R software, text mining technology adapted to identify important key words in the comment texts, extraction of keywords that describe visitors’ perception of sentimental preference.
2) Word cloud analysis, Linear Discriminant analysis (LDA), both of which are effective in visualizing the results of text analysis.
3) 2010 NTUSD Sentiment Classification of Short Chinese Sentences adapted both to classify visitor’s sentimental preference, and to identify emotional factors (sentiment polarity) of visitor.
4) Regression analysis for developing a visitor engagement model for future exhibition visitor Prediction and to explore the relationship between visitor sentimental preference &the number of visitors.
4. Result Analysis
4.1. Visitor Profile
TTE started its Facebook fan page in 2011. Our study consists of an extract of 5 years of data which includes total number of visitors, and the like, comment, and share counts. Table 1 shows that the number of visitors beginning from 188,291 in 2011 rapidly grew every year, and in 2015 reached the record high of 282,865 visitors.

Table 1. 2011-2015 TTE total number of visitor.
4.2. Social Media-TTE Facebook Profile
Figure 1 shows 5 years of the TTE Facebook fan page like counts, comment counts, and share counts. FB like counts grew from 156 counts in 2011 to 4214 counts in 2015. The comment counts grew from 32 counts in 2011 to 148 counts in 2015, and the share counts growth from 0 counts in 2011 to 384 counts in 2015. This result showed that within a period of 5 years, the FB fan page population increased their interaction tremendously.
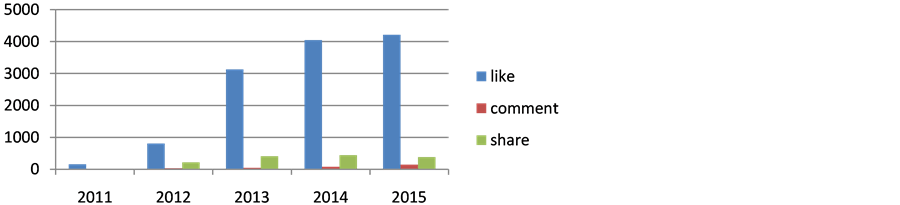
Figure 1. 2011-2015 Facebook counts.
Table 2 demonstrates the mean and SD from the descriptive statistical analysis. The average number of total visitors for 5 years was 233,032; the visitor, and total FB like counts was 2470 counts, the total FB comment counts was 63 counts, and the total FB share counts was 290 counts.
Table 2. Descriptive statistical analysis.
4.3. Word cloud and Linear Discriminant Analysis
The result from Figure 2 is 5 years word cloud and linear discriminant analysis, term frequency analysis in R software was employed. Text mining technology was adapted to identify important key words in the comment texts. Both word cloud analysis and Linear Discriminant analysis (LDA) are the most effective in visualizing the results of text analysis.
The result of word cloud shows that the visitors are highly concern with 1) TTE selecting the Taipei World Trade Center Hall1 as exhibition venue. 2) The main theme is related to health care activities. 3) Using gamification in Facebook and an incentive prize of free air ticket, tourism….etcetera to create visitor involvement. 4) Exhibition booths are present to distinguish the characteristics of exhibition experience related to wedding tourism, internet exhibition, entrepreneurship etc.


Figure 2. 2011-2015 word cloud and linear discriminant analysis.
The 2011 linear Discriminant analysis (LDA) result was the visitors express their preference about incentive prize, the creative activities to enhance their exhibition experience, and the free exhibition ticket. In 2012 visitors concerned with free lodging, trip, discount, and the reputation of exhibitor. The 2013 visitors cared for special exhibition activities designed for health care, living, and children. The 2014 visitors looked forward to winning free exhibition ticket and preferred that there be at least one wedding trip exhibitor. In 2015, visitors concerned with a free incentive international air ticket and free hotel, tourism coupons. The main interests from the visitor’s perception from 2011 to 2015 separated into two routes, one route concerned free incentive activities and distinguishing exhibitors, the other route concerned the exhibition venues, location, brand reputation and exhibition experience.
4.4. Sentimental Analysis
Sentimental analysis and opinion mining is the field of study that analyzes people’s opinions, sentiments, evaluations, attitudes, and emotions from written language. This field is one of the most active research areas in natural language processing and is also widely studied in data mining, web mining, and text mining. The growing importance of sentiment analysis coincides with the growth of social media such as reviews, forum discussions, blogs, micro-blogs, Twitter, and social networks (Liu, 2012 [13] ). Sentimental analysis extract positive (+1), and negative (−1) emotions from text. We use R software to extract each message’s sentiment. The NTU Sentiment Dictionary has been adopted to classify the words into psychologically meaningful categories.
According to the result of sentimental analysis, both post and comment text messages are classified in the positive emotion category (Table 3, Figure 3, Figure 4). But the comment sentiment coefficient shows the exhibition visitor a drop in their positive emotion every year form 2011 of 0.1491 to 2015 of 0.0022. The post sentiment coefficient also dropped from 2011 of 0.1805 to 2015 of 0.1326. Those are the warning signs that the exhibition management and marketing design have to improve to remain a positive emotion engagement in the minds of the visitors.
Table 3. Sentimental analysis.
![]()
Figure 3. 2011-2015 post sentimental analysis.
![]()
Figure 4. 2011-2015 comment sentimental analysis.
We then counted the total positive and negative messages from FB (i) and generated a sentiment index (SENT-INDEX) for i. Neutral messages were discarded. The SENT-INDEX score was adopted from the work of Oh et al. 2015 of Social media analytics framework: The Case of Twitter and Super Bowl Ads. A SENT- INDEX measure that is more than 0 is positive, 0 is neutral and less than 0 is negative. Equation 1 shows the equation for the SENT-INDEXi.
Equation 1 Sent Index
![]()
Table 4 lists the SENT-INDEX scores at the bottom. The result shows that all 5 years are positive sentimental which demonstrate the visitor perception of positive emotion with regard to those exhibitions. 2014 has the highest positive sentimental coefficient of 2.0056 compared with 2011 of 1.4633, but generally, the 5 year sent-index has no significant difference in the visitors’ positive emotion perception.
Table 4. Sent-index analysis.
4.5. Model Development by Regression Equation
Social media usage may be able to construct a user behavior patterns (Hill, 2014 [14] ).This stage is to analyze the extracted features from Stepwise Regression Models. We employed a stepwise regression approach to analyze the relationship between the number of visitors and the FB likes, comments, share counts and sent-index. Our model set the dependent variable of the number of exhibition visitor and the independent variables of FB like counts, comment counts, share counts and sent-index as shown in Equation 2.
Equation 2 regression model
The number of exhibition visitori = β0 intercept + β1 FB like countsi + β2 FB comment countsi + β3 FB share countsi + β4 SENT-INDEXi + ei
Table 5 shows the Pearson correlation expressed FB like counts, comment counts, and share counts as significant in relation to the number of exhibition visitor. Table 6 resulted from stepwise regression. The R2 of 52.8% and adjusted R2 of 44.9% for model 2 signified a stronger ability to explain the relations”. This finding shows the relevance of both FB like counts and comments generated by social media in relation to the visitor engagement performance.
Table 5. Pearson correlation.
Table 6. Result from stepwise regression.
5. Conclusions
This exhibition visitor framework shows usefulness in extracting and analyzing social media measures for exhibition’s visitor engagement predictions. This framework is generalizable to other domains in the Asia area. An analytic method may provide a professional exhibition organizer (PEO) with accurate information in developing successful WOM marketing strategies or an exhibition management design for promoting successful exhibition visitor engagements. This study result demonstrates that the TTE increased the number of visitor engagements, but the visitors’ positive sentiment dropped every year. PEO should able to make quality decisions both quickly and accurately in order to response exhibition visitor needs from social media platform, and continuously monitor as their social media investment bursting into ROI.
We validated the exhibition visitor engagement framework by providing evidence that social media measures the relationship between visitor numbers of exhibition and text messages of Facebook fan page. Thus, we contributed the data mining technic application in exhibition management, especially in Asia area research. The other value of this study is the visitor engagement model development for exhibition visitor forecasting, in order to a provide PEO and PCO guidelines for an exhibition management and marketing strategy.
Social media marketing has been referred as “word of mouth” marketing of the internet age. When compared with traditional event marketing strategy, Ramsborg (2015) suggests that PEO should go social with event marketing, and use social media to promote events on YouTube, Facebook, Twitter…, PEO should consider to 1) create a Facebook event, 2) set up an event group on Linkdelin and Instagram… 3) post session preview videos on YouTube, 4) blog about featured demo or discussion topics, 5) an exhibition app should design a comment post area that can interact with visitors, to maximize the exhibition experience, 6) using gamification in social media and an incentive prize to create visitor involvement and enhanced exhibition experience. Over 3/4 of the present global population is using mobile phones, over 25% use location-based services, for engaging with event visitors. The PEO should try: 1) using Twitter to send out “from the event” updated; 2) hosting a Tweetup or Tweet chat; 3) promoting a Foursquare or a Gowalla event check-in; 4) creating an SMS/MMS text campaign for event updates or contests; 5) integrating QR codes to boost buzz and participation (Ramsborg, 2015 [15] ).
Acknowledgements
We thank Po Yu Lin and Ching Wan of Fu Jen Catholic University, Graduate school of Statistics and Information Science, for their text mining and statistic support towards this research study.
Cite this paper
Tian-Shyug Lee,Ben-Chang Shia,Chung-Ling Huh, (2016) Social Media Sentimental Analysis in Exhibition’s Visitor Engagement Prediction. American Journal of Industrial and Business Management,06,392-400. doi: 10.4236/ajibm.2016.63035
References
- 1. Klimaszewski-Patterson, A., DeMers, M., Richman, R., Ahearn, S., Plewe, B. and Skupin, A. (2013) Toward an Immersive 3 D Virtual BoK Exploratorium: A Proof of Concept. Transactions in GIS, 17, 335-352.
http://dx.doi.org/10.1111/tgis.12038 - 2. Harald, S., Daniel, G.-A., Panagiotis, T.M., Eni, M., Markus, S. and Peter, G. (2013) The Power of Prediction with Social Media. Internet Research, 23, 528-543.
http://dx.doi.org/10.1108/IntR-06-2013-0115 - 3. Meettaiwan (2016) Reports of Taiwan MICE Industry.
http://www.meettaiwan.com/zh_TW/index.html - 4. Prohaska, T.R., Anderson, L.A. and Binstock, R.H. (2012) Public Health for an Aging Society. JHU Press, U.S.A, 249-252.
- 5. Fredricks, J.A., Blumenfeld, P.C. and Paris, A.H. (2004) School Engagement: Potential of the Content, State of the Evidence. Review of Educational Research, 74, 59-109.
http://dx.doi.org/10.3102/00346543074001059 - 6. Ahn, H.J. (2013) Mining Texts to Understand Customers’ Image of Brands. International Journal of Electronic Commerce Studies, 4, 131-134.
http://dx.doi.org/10.7903/ijecs.1122 - 7. Littlewood, K. and Bick, G. (2014) Developing the Social Media Value Chain: A Conceptual Framework for the Measurement of Social Media. Proceedings of the 13th European Conference on e-Learning, Copenhagen, 30-31 October 2014.
- 8. Guo, G. and Chan-Olmsted, S.M. (2015) Predictors of Social Television Viewing: How Perceived Program, Media, and Audience Characteristics Affect Social Engagement with Television Programming. Journal of Broadcasting & Electronic Media, 240-258.
- 9. Noyelles, A. and Reyes-Foster, B. (2015) Using Word Clouds in Online Discussions to Support Critical Thinking and Engagement. Online Learning, 19, No. 4.
- 10. Ghassabeh, Y.A. and Moghaddam, H.A. (2013) Adaptive Linear Discriminant Analysis for Online Feature Extraction. Machine Vision and Applications, 24, 777-794.
http://dx.doi.org/10.1007/s00138-012-0439-z - 11. Facebook (2015) Reports First Quarter 2015 Results.
http://investor.fb.com/releasedetail.cfm?ReleaseID=908022 - 12. Oh, C., Sasser, S. and Almahmoud, S. (2015) Social Media Analytics Framework: The Case of Twitter and Super Bowl Ads. Journal of Information Technology Management, XXVI, No. 1.
- 13. Liu, B. Web Data Mining. Springer Verlag, Frankfurt, Germany. Liu, B. (2012) Sentiment Analysis and Opinion Mining. Morgan & Claypool Publishers, San Rafael, CA.
http://dx.doi.org/10.2200/s00416ed1v01y201204hlt016 - 14. Hill, S. (2014) Using Social media to Predict TV Viewship, SCECR. Tel Aviv University, Tel Aviv, Israel.
- 15. Ramsborg, G.C. (2015) Professional Convention Management Association: A Guide to Meetings, Conventions, and Events. 6th Edition, USA.
NOTES
![]()
*Corresponding author.