Open Journal of Business and Management
Vol.04 No.04(2016), Article ID:71610,15 pages
10.4236/ojbm.2016.44074
Comparative Study on the Fortune Global 500―Basing on the 2005-2015 Ranking
Xiaojiao Long
School of Business Administration, South China University of Technology, Guangzhou, China

Copyright © 2016 by author and Scientific Research Publishing Inc.
This work is licensed under the Creative Commons Attribution International License (CC BY 4.0).
http://creativecommons.org/licenses/by/4.0/


Received: August 11, 2016; Accepted: September 30, 2016; Published: October 28, 2016
ABSTRACT
Based on the analysis of the world’s top 500 companies list from 2005 to 2015, comparative research was conducted between six countries including the United States, China, Japan, Britain, France and Germany, which were representative in both revenue and profit among the Fortune Global 500. This paper analyzed the quantity, revenue, profit, margin profit and industrial distribution of these corporations from above-mentioned countries. The existing problems of Chinese enterprises were identified, and corresponding suggestions were given.
Keywords:
Fortune Global 500, Chinese Enterprises, Comparative Research

1. Introduction
Fortune magazine have published the list of the world’s largest 500 companies annually since 1954. Based on total revenues of an enterprise, this list, also called Fortune Global 500, not only reflects an enterprise’s development and business performance, but also is an important indicator to assess their business strength and international competitiveness. With the rapid development of Chinese economy, the number of companies that are listed in the Fortune Global 500 has increased in recent years. However, Chinese enterprises are big in scale but not strong in international competitiveness. This problem has not been effectively solved, although the Belt and Road initiatives point out the direction for companies that want to expand their markets overseas.
In order to solve this problem, this paper conducted comparative research between six countries including the United States, China, Japan, Britain, France and Germany, which were representative in both revenue and profit among the Fortune Global 500. In 2015, the number of top companies in these six countries accounted for 75% of the Fortune Global 500, while their revenue and profits accounted for 76.22% and 79.53% respectively. By analyzing the quantity, revenue, profit and industrial distribution of these corporations from above-mentioned countries, this paper tended to explore the gene of those companies on the Fortune Global 500 that were both big in scale and strong in terms of international competitiveness, providing theoretical guidance and practical reference to Chinese enterprises.
2. Literature Review
There are two types of research on the Fortune Global 500. The first type of research is only using the world’s top 500 companies as a sample to study specific problems which include business performance, competitiveness and so on.
In terms of business performance, Sledge [1] used the world’s top 500 companies from 1995 to 2009 as a sample, explored the factors influencing business performance by using regression analysis. Similarly, Zhu [2] explored a multi-factor model to measure business performance with data envelopment analysis. Ma [3] explained the heterogeneity of the performance of foreign subsidiaries with analysis of variance, by using the world’s top 500 companies which established their subsidiaries in China between 1998 to 2006 as a sample. In terms of competitiveness, Rugman [4] conducted research on 365 companies from the world’s top 500 companies in 2001, exploring regionalization and globalization strategies of multinational corporations. Furthermore, Rugman [5] conducted research on 128 Asian companies from the world’s top 500 companies in 2006 to analyze international competitiveness of Asian companies by FSA/CSA matrix. He found that only a handful of Japanese and Korean companies had big sales out of Asia, most of the Asian companies operated domestically, rather than globally.
The US 500 and the Inc. 500 are similar to the Fortune Global 500. The US 500 refers to the largest 500 companies in the United States, published annually by Fortune magazine. Similarly, this list is also based on total revenues of a company. The Inc. 500 refers to the fastest growing 500 companies in the United States, published by Inc. magazine each year. There are many studies on the US 500 and the Inc. 500. For example, Gaba [6] used a sample of the US 500 which entered China between 1979 to 1996, discussing the factor that can lead a company to expand the emerging markets as soon as possible. Zhao [7] compared the technological differences between the websites of the Fortune Global 500 and these of the US 500, by using content analysis.
The second type of research focused on the Fortune Global 500 itself and conducted research on their changes. For example, Bergesen [8] analyzed changes of the world’s top 500 companies from 1994 to 1998, in order to analyze the industrial structure of the world’s economy and to further explore the rise and fall of hegemonic countries. It was shown that the world’s economic center is shifting from North America to the Asia Pacific region. Moreover, Asia, particularly Southeast Asia will draw the world’s attention in the near future. Martelli [9] analyzed changes of the world’s top 500 companies in 2009, to explain how internationalization affects their composition and performance. In this type of study, only a few studies used changes of the world’s top 500 companies to analyze Chinese enterprises. For example, Alan M. Rugman analyzed 16 Chinese companies in Fortune Global 500 in 2004 and found that the vast majority of their revenues came from Asia, which reflected that Chinese enterprises operated more regionally than globally.
Since there are only a few studies using changes of the world’s top 500 companies to analyze Chinese enterprises, this paper conducted comparative research between six countries including the United States, China, Japan, Britain, France and Germany, which were representative in both revenue and profit among the Fortune Global 500. By analyzing the quantity, revenue, profit and industrial distribution of these corporations from above-mentioned countries, the paper tended to explore the gene of those companies on the Fortune Global 500 that are big in scale and strong in international competitiveness, and to provide theoretical guidance and practical reference to Chinese enterprises.
3. Analysis of the Top Enterprises in Six Countries
3.1. Quantity
As seen in Figure 1, in terms of the number of companies on the list, all countries showed a decline except for China. In 2005, the United States had 176 companies on the list, but dropped to 128 in 2015 with a decline of 27.27%. Similarly, in 2005, Japan had 81 companies on the list, but dropped to 54 in 2015 with a decline of 27.27%. Britain, France and Germany decreased similarly, from 2005 to 2015, the number of enterprises on the list declined by 20.00%, 20.51% and 24.32% respectively. On the contrary, Chinese enterprises are on the rise. The number of Chinese companies on the list increased from 18 in 2005 to 106 in 2015, ranked second on the list in 2015.
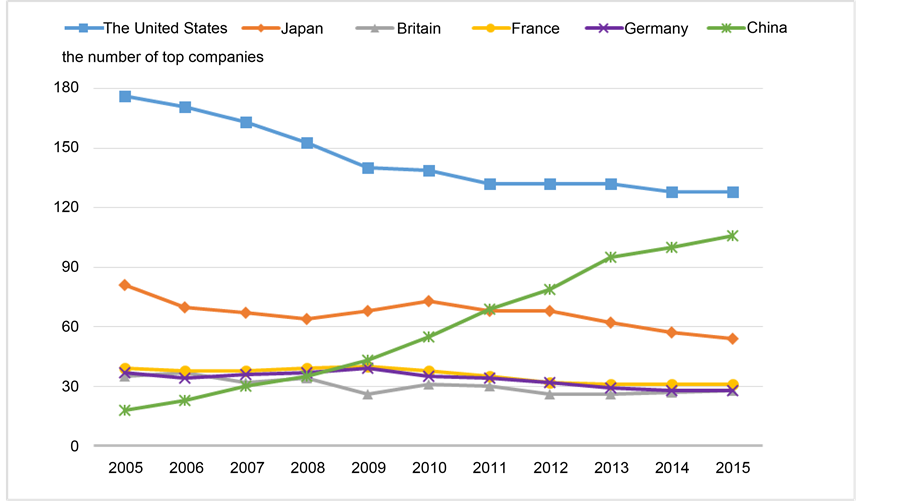
Figure 1. The number of top companies in six countries from 2005 to 2015.
3.2. Total Revenues and Total Profits
As shown in Figure 2, in terms of total revenues of the companies on the list, six countries showed an increase generally. While China experienced the largest increase with 12 times, Japan experienced the smallest increase with 19.92%. The increase in the United States, Britain, France and Germany was 39.58%, 24.29%, 38.95% and 32.12% respectively. What was notable was that the United States and Germany showed a drop in 2010 affected by the 2008 financial crisis. In 2015, the total revenues of the companies on the list in the United States, China, Japan, Germany, France and the UK accounted for 27.85%, 20.87%, 9.19%, 6.67%, 6.49% and 5.15% of the world’s top 500 companies respectively.
As seen in Figure 3, in terms of the total profits of the companies on the list, all countries showed a decline except for China. Especially after the financial crisis in 2008, the total profits of the companies on the list in the United States, Japan, Britain, France and Germany had fallen sharply. In general, compared to 2005, Britain and France decreased by 38.87% and 28.31% respectively, while China, Germany, Japan and the United States increased by ten times, 71.83%, 71.77% and 65.71% respectively. In 2015, the total profits of the companies on the list in the United States, China, Japan, Germany, France and the UK accounted for 39.72%, 20.83%, 7.04%, 5.05%, 4.16% and 2.72% of the world’s top 500 companies respectively.
3.3. Margin Profit
In terms of the margin profit of the companies on the list, all countries experienced a large fluctuation as shown in Figure 4. The margin profit of the companies on the list
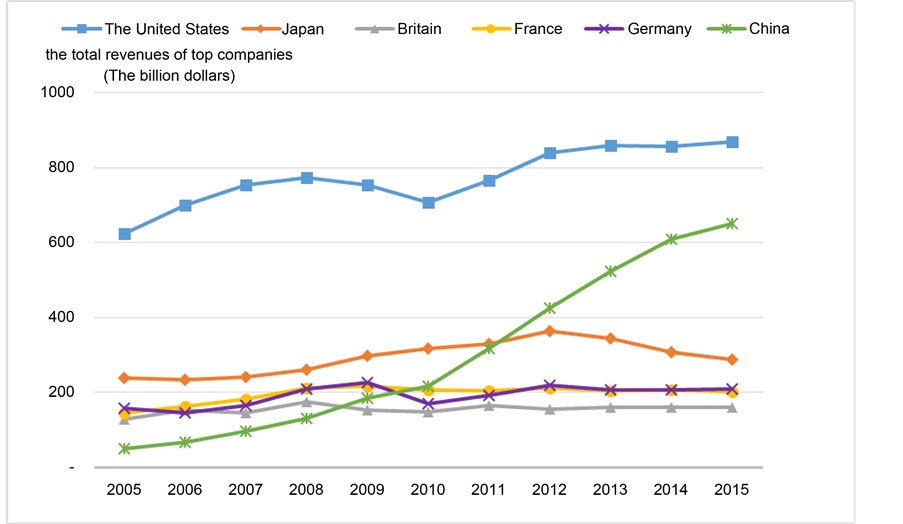
Figure 2. The total revenues of top companies in six countries from 2005 to 2015.
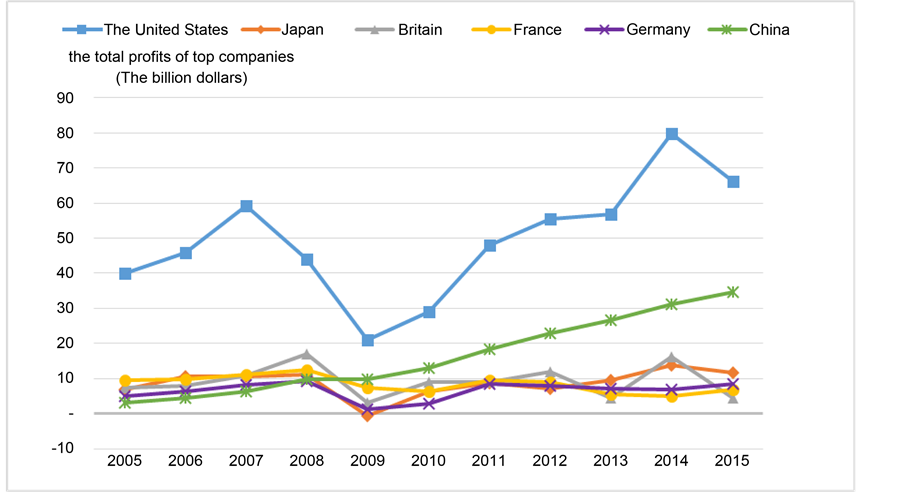
Figure 3. The total profits of top companies in six countries from 2005 to 2015.
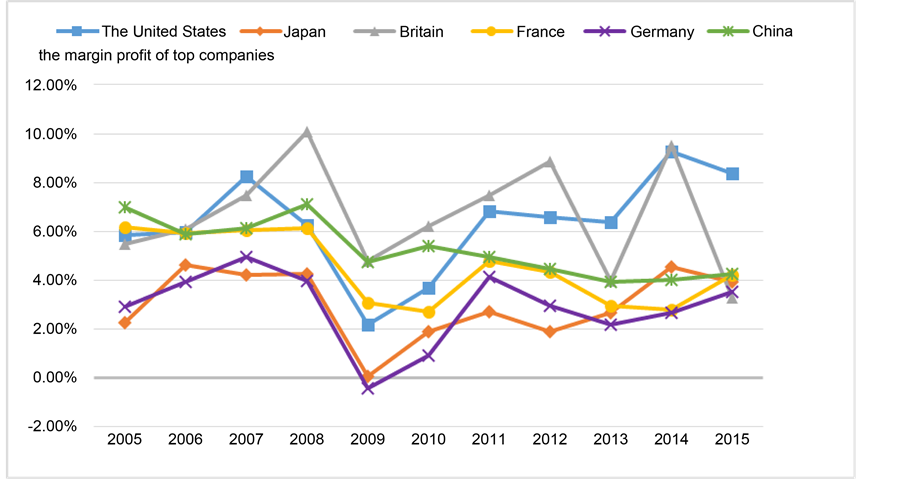
Figure 4. The margin profit of top companies in six countries from 2005 to 2015.
in six countries declined dramatically due to the financial crisis in 2008.
3.4. Industrial Distribution
1) American Enterprises
From the perspective of industrial distribution, the companies on the list of the United State came from a variety of sectors. As shown in Figure 5, in terms of total profits, in 2015, ranking number one was the commercial bank industry, accounting for
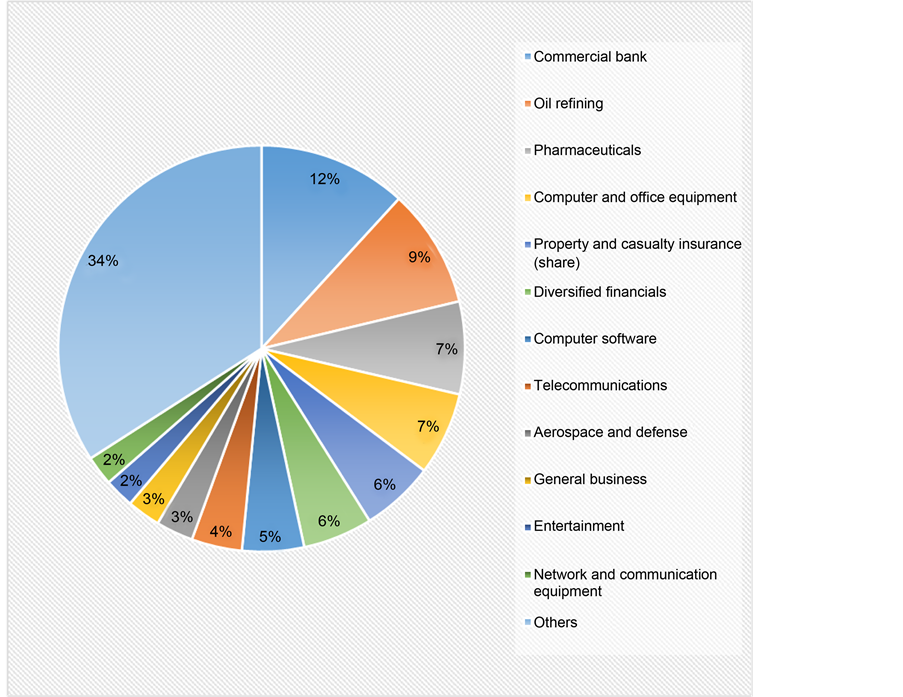
Figure 5. The industrial distribution of American companies in 2015 based on total profits.
12% of total profits, followed by the oil refining industry with 10% and pharmaceuticals industry with 7%. In addition, the total profits of computers industry, office equipment industry and insurance industries industry are relatively high. In terms of margin profit, Gilead Sciences, a company from pharmaceuticals industry, ranked first on the list in 2015. In terms of total profits, Apple, a company from computer and office equipment industry, ranked first on the list in 2015.
2) Japanese Enterprise
Unlike the United States, the companies on the list in Japan concentrated on certain sectors. As shown in Figure 6, in terms of total profits, in 2015, ranking number one was the vehicle and parts industry, accounting for 31% of total profits. This reflected Japan is at the forefront of car manufacturing, having a great amount of famous brands such as Toyota, Honda, Suzuki, Nissan and Mazda. Commercial savings bank industry, including Mizuho Financial Group, Sumitomo Mitsui Financial Group and Mitsubishi UFJ Financial Group, followed next with 17% of total profits. Telecommunications industry, trade industry and electronic and electrical equipment industry ranked third, fourth and fifth respectively.
The vigorous development of the five above-mentioned industries is a reflection of Japan’s consortium-based economy. Japan’s consortium is a group of companies, which

Figure 6. The industrial distribution of Japanese companies in 2015 based on total profits.
cross share holdings among each other, aiming to promote mutual business. The consortium is divided into three components: the main bank, the general trading company and the manufacturing company. They are organic integration of productive capital, financial capital and commercial capital, and make consortium an important pillar of Japanese economy [10] .
3) German Enterprise
The companies on the list in Germany concentrated on certain sectors. As shown in Figure 7, in terms of total profits, in 2015, ranking number one was the vehicle and parts industry, accounting for 44% of total profits, which indicated that Germany is famous for car manufacturing, having a great amount of well-known brands such as Volkswagen, Daimler and BMW. It is worth noting that Siemens, the only company on the list in electronic and electrical equipment industry, contributed 8% profits.
4) British Enterprise
As shown in Figure 8, the companies on the list in UK concentrated on certain sectors. In terms of total profits, in 2015, ranking number one was the commercial bank industry, accounting for 29% of total profits. This was because London, as the largest financial center in the world, has a variety of well-known banks such as HSBC, Lloyds and Standard Chartered Bank. Telecommunications industry became the second profitable industry in UK due to the high profitability of Vodafone and British Telecom’s. Additionally, Rio Tinto, the only company on the list in mining and crude oil production industry contributed 10% profits.
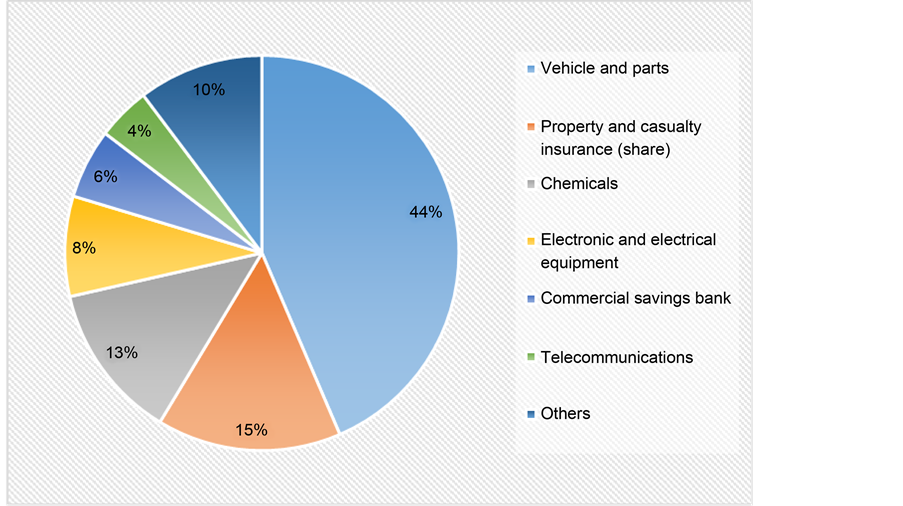
Figure 7. The industrial distribution of German companies in 2015 based on total profits.
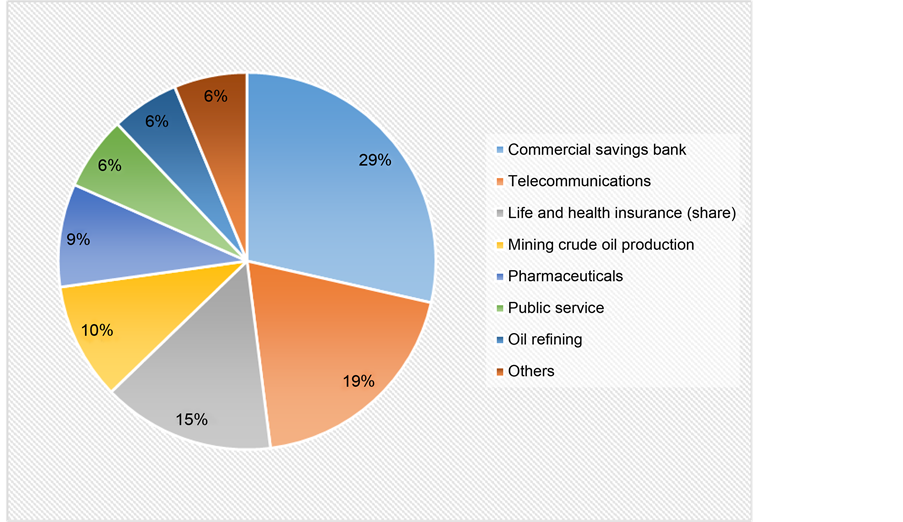
Figure 8. The industrial distribution of British companies in 2015 based on total profits.
5) French Enterprise
From the perspective of industrial distribution, the companies on the list of France came from a variety of sectors. As shown in Figure 9, in 2015, the most profitable industry is Commercial savings bank industry, accounting for 15% of total profits, followed by the insurance industry, accounting for 11% of total profits.

Figure 9. The industrial distribution of French companies in 2015 based on total profits.
It is worth noting that the household and personal products industry ranked third and L’Oréal, the only company on the list in this sector, accounted for 9% of total profits. The entertainment industry ranked fourth and Vivendi, the only company on the list in this sector, accounted for 9% of total profits. The pharmaceuticals industry ranked fifth and Sanofi, the only company on the list in this sector, accounted for 8% of total profits.
6) Chinese Enterprise
From the perspective of quantity, the companies on the list of China came from a variety of sectors. However, they concentrated on certain sectors in terms of total profits. As shown in Figure 10, in 2015, ranking number one was the commercial saving bank industry, accounting for 56% of total profits. This was significantly different from developed countries, even in Germany, vehicles and parts industry which is the most profitable industry only accounted for 44% of total profits, not more than 50%.
In conclusion, although the industrial distribution of the companies on the list differed from country to country, the commercial bank sector, the insurance sector and the oil refining sector were the main sectors, as shown in Table 1.
4. Conclusions
There is no doubt that China has performed well in the past decade. The companies on the list in China showed a great increase both in revenue and profit. By 2015, the number of China’s top companies have ranked second, moreover, both their revenues and profits accounted for more than 20% of the world’s top 500. However, we can see that
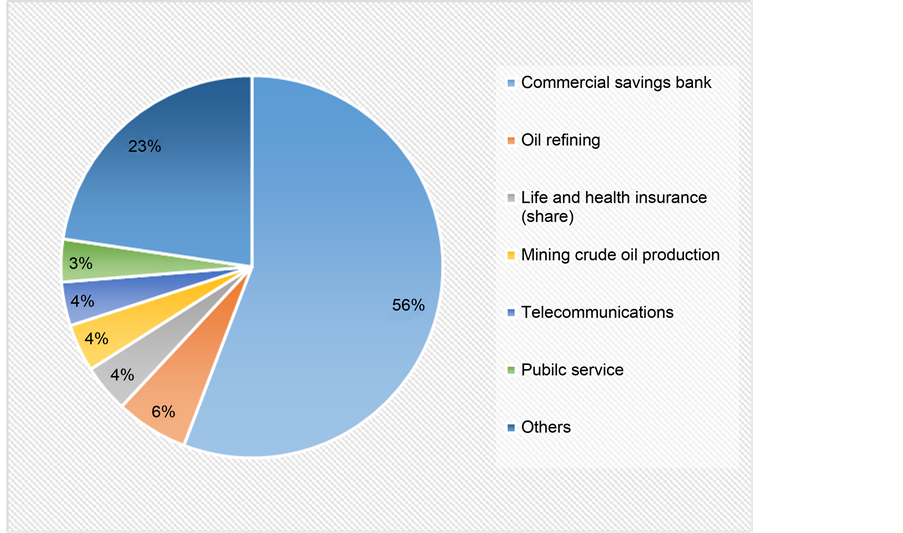
Figure 10. The industrial distribution of Chinese companies in 2015 based on total profits.

Table 1. The industrial distribution of companies in six countries based on total profits.
Chinese enterprises were still faced with many problems by conductive research between China and developed countries. The problems are as follows:
4.1. Existing Problems
1) Irrationality in Structure
From the perspective of industrial distribution, the vast majority of Chinese companies on the list came from monopolized industries, such as iron and steel industry, petroleum industry, engineering and construction industry, electric power industry and defense industry and so on. In general, they were unable to provide high-tech products and were lack of innovation ability. In addition, unlike developed countries known for a great amount of famous brands, China had only a few companies which owned global brand value and influence.
Among 106 Chinese enterprises on the list in 2015, four came from Hong Kong, seven enterprises came from Taiwan and 95 came from mainland. From the perspective of property distribution, there were only eight private enterprises, accounting for 8.42% in quantity, 5.30% in revenue and 5.24% in profit.
Most of the China’s top companies were state-owned enterprises with large-scale assets, they were mostly from monopolistic and regulated industries with government franchise, which were hard to enter due to high barriers and were faced with little competitive pressure. It was easy for them to make profits due to huge governmental subsidies and monopoly profits, while private enterprises were forced to participate in fierce competition, facing a shortage of funds and other problems because of the lack of governmental support. Therefore, we can see that there was asymmetric competition among Chinese enterprises with different ownership, that is, state-owned enterprises dominated the upstream part of the market while private enterprises dominated the downstream part of the market [11] .
China had as many as 17 loss-making enterprises in 2015, and all of them were state-owned and mostly came from monopolistic and regulated industries with government franchise, which indicated that the state-owned enterprises in China were lack of market competitiveness. In addition, the Chinese private companies had difficulty in financing in spite of well development in banking sector. It was a great description on this issue that state-owned enterprises were calcium deficient and private enterprises were ischemia deficient.
2) Big in Scale but Weak in Profitability
The number of China’s top companies increased year by year. In 2015, China ranked second both in the number and total profits of the companies on the list, behind the United States. Their total revenues and total profits accounted for 20.87% and 20.83% of the Fortune Global 500 respectively, as shown in Table 2.
However, the margin profit of China’s top companies was only 4.27%, about half of that of the United States, as shown in Table 3. From the view of profitability, Chinese companies still had a long way to go.
Table 2. Total revenues and total profits of companies in six countries in 2015.
Table 3. Margin profit of companies in six countries in 2015.
3) Heavy Losses of State-Owned Enterprises
From Table 4, we can see that China had as many as 17 loss-making enterprises in 2015, accounting for 8.24% of the loss of the Fortune Global 500. Moreover, all of the loss-making enterprises were state-owned and mostly came from monopolistic and regulated industries with government franchise, such as mining and crude oil production industry and the like. This indicated that the state-owned enterprises in China were lack of market competitiveness.
4) Financing Difficulties of Private Enterprises
There were 55 banks on the list in 2015, on which China had 11 banks, accounting for 20% in quantity. Moreover, the most profitable bank came from China. In terms of total profits, Industrial and Commercial Bank of China ranked first, followed by China Construction Bank, Agricultural Bank of China and Bank of China. In spite of well development in banking sector, Chinese private companies still had difficulty in financing, which caused a corresponding problem called shadow bank.
5) Low Degree of Internationalization
Many of the China’s top companies were well-known in China, but not in the world. There is no doubt that China had a lot of profitable companies, such as Sinopec Group, State Grid and Industrial and Commercial Bank of China and so on. However, they were not really world-famous, as they operated more domestically than internationally and more than 80% of their revenues were generated in China [12] .
On the contrary, those companies which have come out at the top of the list consistently for several years were truly global and were more competitive.
4.2. Solutions
1) Develop a Mixed-Ownership Economy to Break Monopoly and Introduce Competition
As mentioned earlier, there was asymmetric competition among Chinese enterprises with different ownership, that is, state-owned enterprises dominated the upstream part of the market while private enterprises dominated the downstream part of the market. There were many drawbacks to maintain the monopoly of state-owned enterprises, on the one hand, it obscured the inefficiency of state-owned enterprises; on the other hand, it was difficult for private enterprises to survive due to lack of governmental support.
The government should formulate and improve relevant policies and regulations, as well as introducing gradually non-public enterprises into all industries, except for de-
Table 4. Sales loss of companies in six countries in 2015.
fense industry which must be strongly controlled by the state. Meanwhile, in terms of market access and financial and fiscal policies, the government ought to provide non-public enterprises with national treatment equally [13] .
Remarkably, the Guidelines on Deepening the Reform of State Enterprises issued on September 13, 2015 pointed out that, one of the key tasks of the new round of reform for Chinese state-owned enterprises was to develop a mixed-ownership economy. It contained a variety of measures, such as boost for mixed-ownership reform for state- owned enterprises, introduction of non-state capital to state-owned enterprises, encouragement for state-owned capital into private enterprise in various ways, and exploration for employee stock ownership plan for mixed-ownership enterprises.
2) Actively Involved in Internationalization to Build a Global Brand
China had a few companies with higher degree of internationalization, such as Lenovo and Huawei. The vast majority of China’s top companies operated more domestically than internationally and their business mainly came from the domestic market. In spite of large scale and high profits, they didn’t really take a seat in international market. From this point, they were not truly global companies.
Therefore, on one hand, the government should further improve the regulatory approaches and management system of state-owned assets, as well as encouraging state-owned enterprises to expand overseas market bravely. On the other hand, enterprises should make full use of both domestic and overseas market to become globally competitive, by expanding their international market share. In addition, for companies that want to expand their markets overseas, the Belt and Road initiatives actually pointed out the direction and the China General Nuclear Power Group and CRRC Corporation Limited also made a good demonstration.
3) Encouragement for Mergers and Acquisitions
Mergers and acquisitions are good way to make an enterprise bigger and stronger. By reorganizing corporate assets, they can update the organizational structure, optimize the business scale, lower production costs, as well as having a more positive impact on enterprises’ business performance [14] .
Throughout the development of Chinese enterprises, many enterprises, especially large state-owned enterprises have experienced an ongoing restructuring process. Among the 35 China’s top enterprises on the list in 2008, 75% of them carried out large-scale restructuring [15] . In the new round of reform for Chinese state-owned enterprises, mergers and acquisitions were becoming increasingly common. At the end of 2014, China South Locomotive and China CNR merged into CRRC Corporation Limited. At the end of 2015, two giants in the shipping industry, China Ocean Shipping (Group) Company and China Shipping (Group) Company announced their merger. Besides, it was reported that the merger of China Merchants Group and Sinotrans & CSC was under negotiation.
With the Belt and Road initiatives, we can predict that internationally competitive industries in China, such as transportation-related industries, infrastructure construction and related industries, energy construction and related industries, commerce industry, cultural tourism industry and information industry will become the next hot spot for reorganization.
4) Encouragement for Innovation
Although China had 106 companies on the list in 2015, it was hard to find a company in leading industries dominated by cutting-edge technology. Admittedly, Chinese enterprises were lack of independent innovation ability and their products were low- tech and low value-added. However, it was of crucial importance for an enterprise to provide competitive products or services to meet customers’ needs. The government ought to increase political support for the development and application of science and technology, so as to making the technological innovation system market-oriented and business-oriented and enhancing the core competitiveness of Chinese enterprises [16] .
Cite this paper
Long, X.J. (2016) Comparative Study on the Fortune Global 500―Basing on the 2005-2015 Ranking. Open Journal of Business and Management, 4, 763-777. http://dx.doi.org/10.4236/ojbm.2016.44074
References
- 1. Sledge, S. (2011) Dynamic Competition: A Look at Firms in the Fortune Global 500. Competitiveness Review, 21, 428-440. http://dx.doi.org/10.1108/10595421111171939
- 2. Zhu, J. (2000) Multi-Factor Performance Measure Model with an Application to Fortune 500 Companies. European Journal of Operational Research, 123, 105-124. http://dx.doi.org/10.1016/S0377-2217(99)00096-X
- 3. Ma X, Tong, T.W. and Fitza, M. (2013) How Much Does Subnational Region Matter to Foreign Subsidiary Performance? Evidence from Fortune Global 500 Corporations’ Investment in China. Journal of International Business Studies, 44, 66-87. http://dx.doi.org/10.1057/jibs.2012.32
- 4. Rugman, A.M. and Li, J. (2007) Will China’s Multinationals Succeed Globally or Regionally? European Management Journal, 25, 333-43. http://dx.doi.org/10.1016/j.emj.2007.07.005
- 5. Rugman, A.M. and Hoon, Oh.C. (2008) The International Competitiveness of Asian Firms. Journal of Strategy and Management, 1, 57-71. http://dx.doi.org/10.1108/17554250810909428
- 6. Gaba, V., Pan, Y. and Ungson, G.R. (2002) Timing of Entry in International Market: An Empirical Study of US Fortune 500 Firms in China. Journal of International Business Studies, 33, 39-55. http://dx.doi.org/10.1057/palgrave.jibs.8491004
- 7. Zhao, J.J. and Zhao, S.Y. (2004) Comparative Analysis of Technologies Used on Fortune 500 and Inc. 500 Corporate Web Sites. Information Technology Learning and Performance Journal, 22, 41-50.
- 8. Bergesen, A.J. and Sonnett, J. (2001) The Global 500: Mapping the World Economy at Century’s End. American Behavioral Scientist, 44, 1602-1615. http://dx.doi.org/10.1177/00027640121958078
- 9. Martelli, J.T. and P.B. Abels (2011) Multinational Corporations: The Changing Landscape. Management Research Review, 34, 889-909. http://dx.doi.org/10.1108/01409171111152501
- 10. Bo, J. (2010) Formless Universal Doctrines: Operating Patterns in Japanese Commerce. Phoenix Press, Nanjing.
- 11. Liu, R. and Shi, L. (2011) Upstream Market Monopoly, Asymmetric Competition and Social Welfare: On the Nature of the Large and Medium Soes’ Profit. Economic Research Journal, 12, 86-96.
- 12. Yuan, X.Y. (2011) Analysis of China’s Top Companies—Develop the Trend of Economic Development in China from Chinese Companies on Fortune Global (2011). China New Time, 10, 20-34.
- 13. Zhang, C.H. and Wu, N.Q. (2008) The Drawback of the Operation Monopolization of State-Owned Enterprises from Monopolic Industry and Their Reform. Modern Management Science, 1, 19-21.
- 14. Chen, L., Liu, H. and Zhu, Y.H. (2009) Comparative Study on the Competitiveness of Chinese, American and Japanese Enterprises in the Global 500. Journal of Wuhan Institute of Technology, 6, 4-8, 23.
- 15. Li, Y. and Li, W.C. (2006) The Basic Experience of the World’s Top 500 Enterprises and the Idea for the Development of Chinese Enterprises. Economic Review, 2, 68-70.
- 16. Li, Y.F. and Liu, T. (2009) Comparative Study on the Fortune Global 500—Basing on the 2009 Ranking—Basing on the 2005-2015 Ranking. East China Economic Management, 12, 36-40.