Theoretical Economics Letters
Vol. 2 No. 1 (2012) , Article ID: 17376 , 4 pages DOI:10.4236/tel.2012.21016
Experimental Research on Asymmetric R&D Investment of R&D/Product Problem
College of Business & Administration, Zhejiang University of Technology, Hangzhou, China
Email: Zhanghy@zjut.edu.cn
Received October 25, 2011; revised November 27, 2011; accepted December 6, 2011
Keywords: Experiment; Asymmetric; R&D/product problem
ABSTRACT
In this paper, an experiment is designed to verify the model findings of asymmetric R&D investment in open environment. 25 MBA students voluntarily participated in the experiment. They were divided into five groups representing different corporate decision-makers with different technical level to participate in repeated R&D/production game. The results show that low technology players will choose to take free ride of high technology competitors’ R&D investment and spare much expenditure at the stage of sequential game, while in a synchronize game a R&D race is the rational choice to both sides. The results fit well with model research, and they can also confirm that the equilibrium of model can be found by people in reality.
1. Introduction
The problem of asymmetric R&D/product reflects a background of developing countries with open environment. Dixon provided a viewpoint of social evolution and learning for this problem [1]. Chin and Grossman have already used this viewpoint when analyzing oligopoly industries with R&D spillovers [2]. Zigic’s analysis further developed the work of Chin and Grossman [3]. In their analysis, “southern” and “northern” enterprises compete in the same market. “Northern” enterprises carry out innovation actions while “southern” enterprises enjoy technology spillovers from the rival’s innovations. Though their view is widely accepted by researchers, empirical research is extremely hard for some reasons: 1) systematic long-term statistics on specific enterprises R&D investment is difficult to obtain; 2) not all R&D work related to concerned products is carried out in host countries by multi-national enterprises; 3) R&D work aiming at products of the same time needn’t to have the same introducing period. Fortunately, experimental research can enable us screening off interferences of uncontrolled variables, and get controlled systematic variations of behavior mode [4].
In the following parts of this paper, the author will describe briefly the results of theoretical research first. Then introduce the experiment design of model simulation. Finally, experimental results will be analyzed to see whether asymmetric R&D investment results of model analysis can be reality. Ease of Use (Heading 2).
2. Experiment Design
In R&D/product problem model, taking A&J (d’Aspremont & Jacquemin)as an example [5], two representative enterprises (i to be local enterprise and j to be MNE) are involved. Enterprise i’s effective R&D effect is assumed to be the sum of its own R&D effect  and a proportion of its rival’s R&D spillovers
 , (
, ( is the spillover coefficient). When the rivals compete with asymmetric technology, the spillover is unilateral. M. Amir, R. Amir and Jim’s extended discussion on A&J model considered the differences of product’s substitution and R&D spillovers, and take the ratio of spillovers to substitution as the core of their analysis to discuss the enterprise’s behavior difference under different ratio [6]. Their analysis assimilates Hamilton and Slutsky’s idea of endogenous sequence game [7]. In their research, when the industry is in an apparently technology asymmetric stage, sequence game will be better to both players. Low technology player will choose to be the leader of the game and the high technology side plays the role of follower; With the evolution of the industry, spillovers is weakening, and the ration of spillovers to product substitution decreases. At last, synchronize game will be the optimal choice to both sides. During this process, the leader (i) will in the beginning take a free ride of the followers R&D investment spillovers and spares much R&D expenditure, while in a synchronize game a R&D race is the rational choice to both sides (see M. Amir, R. Amir and Jim’s research for further detailed information).
Combined with the model but not restrict by it, the industry studied is supposed including five companies, which produce differentiated products. The substitution rates between products are  (just for simplicity’s sake). Companies compete with the same marginal cost of 20 unites in a market capacity of 100, and then the price that enterprise i can get is:
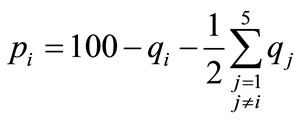 (1)
(1)
The five companies are supposed to have different technology levels. That is two with high technology level (labeled with 1 and 2) and three with low levels, which all commit to cost reducing innovations. The cost reduced is correlated with R&D investment, and the relationships are 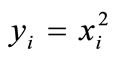 for high-technology ones and
 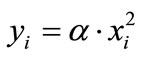 for low-tech ones, where
  is R&D cost,
  is reduced marginal cost conduced by initiative innovations.
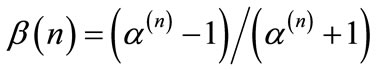
 ![]() is bigger than 1, and lower technology level corresponding with a bigger
is bigger than 1, and lower technology level corresponding with a bigger![]() , which means lowtechnology ones is reluctant to carry out initiative innovations, but willing to absorb knowledge spillovers from high-technology ones. There are one-way spillovers in market. That is from high-tech side to low-tech side, and then the cost reduced is:
, which means lowtechnology ones is reluctant to carry out initiative innovations, but willing to absorb knowledge spillovers from high-technology ones. There are one-way spillovers in market. That is from high-tech side to low-tech side, and then the cost reduced is:
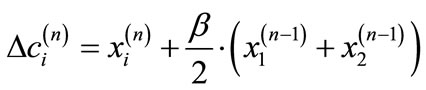 (2)
(2)
where the superscript denotes the number of experiment rounds.  is spillover rate, which correlates with the technology gap and R&D accumulation of low-tech side.
We assume
 .
.
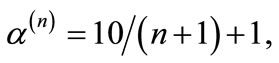
Then  will never bigger than 1. The designation of
 ![]() and
and  makes known that after about 12 rounds the game convert from sequential game to synchronize game.
According to the model in this paper and experiment design, in the former half of experiment series (about 12 rounds), the characteristic of game equilibrium is sequential game equilibrium just as model predicts. During the latter half of experiment series, leading advantage vanishes and then Nash equilibrium will be rational results, thus there will be a R&D race. Under this mechanism, the following three hypotheses will be hold:
H1: There is distinct difference in R&D output between different enterprise groups according to technology.
H2: There is increasing trend in low tech enterprise’s R&D output all through the experiment series.
H3: There is no single trend in high tech enterprise’s R&D output. The changing trends will be decreasing first and then increasing.
3. Incentive Mechanism
The costs that participators assumes are the time and energy paid out in participating in the experiment, while incomes lie in mental satisfaction and economic or uneconomic rewards, including curiosity in making operating decisions and proving of their own capacity of decision making. Here non-economic incentives are applied.
Taking into account that MBA students have sufficient practical experiences and enough theoretical background knowledge, the author believe that they are the most appropriate. In a class which is attending management economics, students are told the actual intent and 25 volunteers are invited. Before experiment, they are told that their achievements are proportional to their overall scores during experiments:
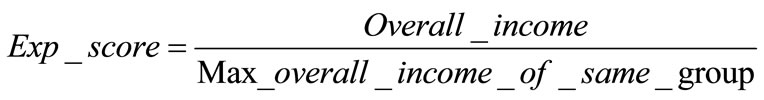 (3)
(3)
4. Experiment Process
Experiment process is as following:
1) Make a lecture about the elements of experiment to participators and then test on it. Whenever the test is qualified, go to the next step.
2) Divide participators into groups with every five in one group. Label groups with A, B, ··· and members with 1, 2, 3, 4, 5. The number of every participator should keep secret to any other participator during experiment.  and
and  are decision variables. c, F and output of competitors in the same group can be seen on terminals after a round is over.
3) Carry out 5 rounds of experiment to let participators know about the effects of two decision variables’ variation on pay offs.
4) Initialize the experiment system and start the formal experiment. Participators input their decisions. After the five members making up of their decisions, system computes the pay offs and save ,
,  ,
,  , then terminals display all outputs of the group and the users input. After 20 rounds, experiment is over.
5) Terminals display cases and experiment scores of all participators. Experiment is over.
5. Experiment Results
5.1. Data Screening
From the total 995 cases, the following four kind of clearly invalid data are get rid off: 1) cases that R&D investment bigger than marginal cost; 2) cases that output less than 0 or bigger than 40; 3) cases from participators with R&D investment as 0 or fixed all through the experiment, which show participators don’t participate actively; 4) and cases of a participator whose all revenues to be negative, in which too high outputs distort the quantity of rational R&D input. At last, 756 cases left. That is more than 75%. The experiment is succeeding in substance.
5.2. R&D Investment Difference between High and Low Technology Groups
The qualified 756 cases are divided in two groups according to technology level, and then the 20 rounds of average R&D investment track are being drawn out. The difference between groups is obvious. The tracks of high technology group is relatively high than those of low tech group. Further more, the former show no single linear trend, while the latter increasing trend is clear. From the scatter figure of different technology level (see figure 1), the difference of R&D investment trends between high and low technology groups can be clearly seen. H1 can be confirmed.
5.3. R&D Investment of Low Technology Group
For the group of low technology group, a linear regression test is conducted. The regression coefficient of model is 0.964, a distinct regression result. The results of coefficient regression in table 1 show a good fitting. Is clear that the R&D investment of low tech companies take on an increasing trend with the process of time, thus H2 is confirmed.
5.4. R&D Investment of High Technology Group
Because the scatter series of high enterprises shows a significant nonlinear trend in figure 1, both regression
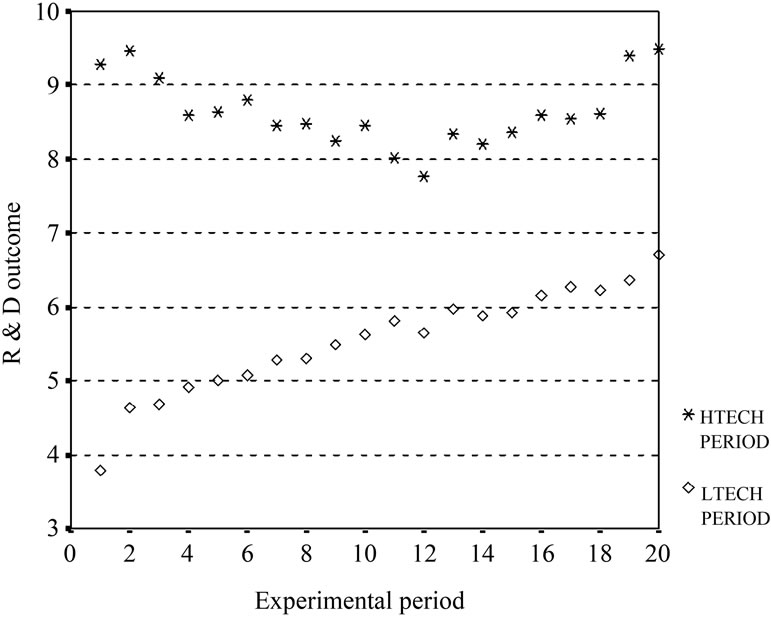
Figure 1. Scatter figure subject to technology levels.
analysis of compound , quadratic
and cubic 
are taken respectively to give a comparison (see table 2). The result of quadratic curve and cubic curve regression are both very good.
If the quadratic curve is chosen for simplicity’s sake, further analysis shows the minimum point of the equation appears at T = 10.868 (while in the experiment we devised the point to be T = 12). This result make out that participators in experiment can fish out the exact equilibrium of game. R&D output decreasing with experiment rounds before T = 10.868, then increasing after this point. The results show H3 can be nicely checked.
6. Extending Discussions
Seeing from a viewpoint of Methodology, incentives without money is unconvincing. In this experiment, there is no direct economic incentive. The participators just told that the result of experiment makes up of 20 percent of this course’s achievement, and a good pay off in experiment mapping a good achievement. We believe that most students care about their achievements (some even think a lot of it than money). Yet there is still some who not yearn for an excellent achievement, what they want is an average level, thus only those who want to join in are invited. Even so, there are still participators performed unqualified outputs and being screened off before data processing.
Though most decision tracks reflect the trends of unit scatter series, they are dispersing in R&D investment scales. There are two convincing reasons: 1) the intensity of incentive is not enough. For there is only one equilibrium, trading off the effects of R&D cost, quantity and
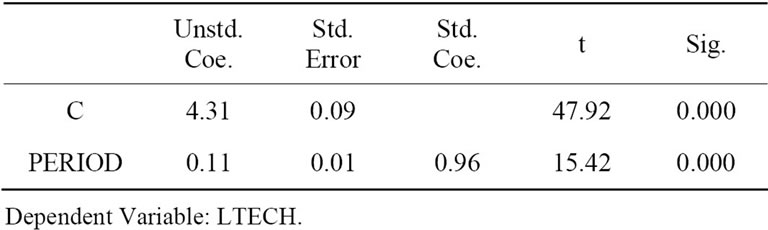
Table 1. Regression results of high technology enterprises.
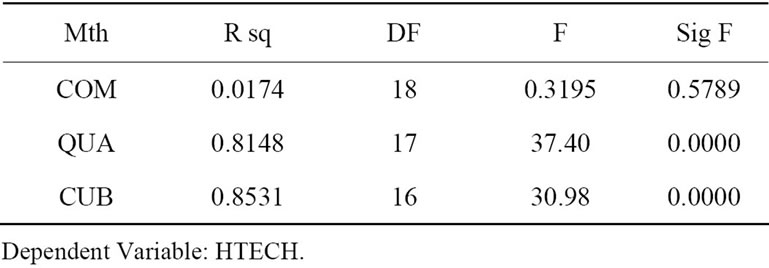
Table 2. Regression results of high tech companies.
price on final profits in a very short time span need a high intensity computation. Participators won’t devote much in it; 2) effects of difference between groups exist. An experiment group is a market. Different participators have different preferences to competition. In some groups, price competition may persist a long time (experiment rounds), while in others cooperative solutions is easier to get. Because R&D costs are allotted to different products unites, the R&D investments then are widely disperse. The first reason can be avoided by better experiment design, while the latter is reasonable market scene, which is determined by people’s bounded rationality and is the gap between model and reality.
7. Conclusions
In this paper, an experiment in class is designed to verify the model findings of asymmetric R&D investment of R&D/product problem. We combined with the model but not restrict by it. The results of experiment show that when the industry is in a apparently technology asymmetric stage, low technology players will choose to be the leader of the game and the high technology participators take the role of follower; With the decrease of spillovers to product substitution, the leader will take a free ride of the followers R&D investment and spares much R&D expenditure, while in a synchronize game a R&D race is the rational choice to both sides, this can explain the scene of asymmetric R&D investment that we observe in many industries in our country and can also predicts that in future, domestic rivals will improve their R&D investment, yet the multinationals reduce in near future and improve their R&D investment in deep future.
The results of experiment are just model predicted. Then we can conclude from our experimental research: though model reasoning process is lengthiness and complex, the equilibrium can be find by people in reality.
8. Acknowledgements
This research is funded jointly by NSFC (71072164), NSF of Zhejiang province (Y6110571), Ministry of Education of China (09YJA790185), and Humanities and social science research base of Zhejiang University of Technology.
REFERENCES
- K. Zigic, “Intellectual Property Rights Violations and Spillovers in North-South Trade,” European Economic Review, Vol. 42, No. 9, 1998, pp. 1779-1799. doi:10.1016/S0014-2921(97)00098-6
- C. d’Aspremont and A. Jacquemin, “Cooperative and Noncooperative R&D in Duopoly with Spillovers,” The American Economic Review, Vol. 78, No. 5, 1988, pp. 1133-1137.
- R. De Bondt and I. Henriques, “Strategic Investment with Asymmetric Spillovers,” Canadian Journal of Economics, Vol. 28, No. 3, 1995, pp. 656-674. doi:10.2307/136055
- A. Brod and R. Shivakumar, “Advantageous SemiCollusion,” The Journal of Industrial Economics, Vol. 47, No. 2, 1999, pp. 221-230.
- M. Amir, R. Amir and J. Jin, “Sequencing R&D Decisions in a Two-Period Duopoly with Spillovers,” Economic Theory, Vol. 15, No. 2, 2000, pp. 1034-1057.
- M. Hellwig and W. Leininger, “Markov-Perfect Equilibria in Infinite-Action Games of Perfect Information,” Bonn, SFB 303 Discussion Paper No. A-185, 1988
- J. Bulow, J. Geanakoplos and P. Klemperer, “MultiMarket Oligopoly: Strategic Substitutes and Complements,” Journal of Political Economy, Vol. 93, No. 3, 1985, pp. 488-511. doi:10.1086/261312