Paper Menu >>
Journal Menu >>
 J. Biomedical Science and Engineering, 2010, 3, 331-339 JBiSE doi:10.4236/jbise.2010.34046 Published Online April 2010 (http://www.SciRP.org/journal/jbise/). Published Online April 2010 in SciRes. http://www.scirp.org/journal/jbise Statistical analysis of conformational properties of periodic dinucleotide steps in nucleosomes Xi Yang1, Hong Yan1,2 1Department of Electronic Engineering, City University of Hong Kong, Hong Kong, China; 2School of Electrical and Information Engineering, University of Sydney, Sydney, Australia. Email: xiyang3@student.cityu.edu.hk Received 15 January 2010; revised 25 January 2010; accepted 27 January 2010. ABSTRACT Deformability of DNA is important for its superheli- cal folding in the nucleosome and has long been thought to be facilitated by periodic occurrences of certain dinucleotides along the sequences, with the period close to 10.5 bases. This study statistically examines the conformational properties of dinucleo- tides containing the 10.5 - base periodicity and those without that periodicity through scanning all nu- cleosome structures provided in PDB. By categoriz- ing performances on the distribution of step parame- ter values, averaged net values, standard deviations and deformability based on step conformational en- ergies, we give a detailed description as to the defor- mation preferences correlated with the periodicity for the 10 unique types of dinucleotides and summa- rize the possible roles of various steps in how they facilitate DNA bending. The results show that the structural properties of dinucleotide steps are influ- enced to various extents by the periodicity in nu- cleosomes and some periodic steps have shown a clear tendency to take specific bending or shearing patterns. Keywords: Deformability of DNA; Nucleosome; Dinu- cleotides; 10.5-Base Periodicity; Deformation Prefer- ences; Flexibility; DNA Bending 1. INTRODUCTION Numerous studies of nucleosome positioning have demonstrated that the arrangement of nucleosomes on DNA is nonrandom. The periodic occurrences of cer- tain base pairs or motifs have been proven to be ubiq- uitous in nucleosomes [1-5]. The periodicity of dinu- cleotide steps can be considered as an important signal for nucleosome identification, and it is widely consid- ered to be closely related to the superhelical structure of nucleosomal DNA [6-9]. On the other hand, the stereochemical characteristics of DNA fragments de- cide their individual behaviors of deformation when being located at certain sites along the DNA sequence [1,10-13]. Anisotropic deformation along a superheli- cal path implies some dimers may play the role of “hinge” and others facilitate “hinges” adhering to the histone octamer core or just simply follow the “hinge” wrapping around the core. From this point of view, there exist some base steps that are geometrically more significant than others, which are mainly reflected by the special structural parameter settings of these im- portant “building blocks”. Although in previous studies, various methods, such as molecular dynamics simulations, energy surface calculation and deformability statistics based on dimer energy function, have already been used to decipher the conformational roles of the ten independent types of dinucleotides [11,13,14], statistics which focus on a large number of nucleosome samples whose crystal structures are experimentally determined is still scarce. Here, we choose 35 crystal structures of nucleosomes published in Protein Data Bank (PDB) as the subject of the statistical survey. The aim of our research is to observe the overall conformational patterns measured by the distribution and variability of base pair step parameters and step conformation energies and build interrelationships between periodicity and deform- ability of base-pair steps. 2. MATERIALS AND METHODS 2.1. Crystal Structure and Dinucleotide Step Parameters There are 35 crystal structures of nucleosomes avail- able in the Protein Date Bank (PDB) currently. All of them belong to the typical complex between histone core particle (H3, H4, H2A and H2B) and DNA se- quence which is organized into a superhelix around the core. The PDB ID of the 35 histone-DNA complexes are 1AOI, 1EQZ, 1F66, 1ID3, 1KX3, 1KX4, 1KX5, 1M1A, 1M18, 1M19, 1P3A, 1P3B, 1P3F, 1P3G, 1P3I, 1P3K, 1P3L, 1P3M, 1P3O, 1P3P, 1P34, 1S32, 1U35,  X. Yang et al. / J. Biomedical Science and Engineering 3 (2010) 331-339 Copyright © 2010 SciRes. JBiSE 332 1ZBB, 1ZLA, 2CV5, 2F8N, 2FJ7, 2NQB, 2NZD, 2PYO, 3B6F, 3B6G, 3C1B and 3C1C. The software 3DNA [15] is used to calculate the six step parameters of nucleosome DNA: Shift, Slide, Rise, Roll, Tilt and Twist. 2.2. Periodicity and Deformability of Dinucleotide Steps The periodic occurrence of dinucleotides observed in nucleosomes has long been thought to be closely re- lated with the sequence-dependent helical anisotropy of DNA. AA/TT was firstly thought to be a step with intrinsic curvature characteristic when it is periodically repeated [16]. Correctly phased repeats (10.5 bp) of AG/CT, CG, GA/TC and GC can also cause apprecia- ble curvature [10]. The 10.5 bp periodicity, which is widely acknowledged to be closely related to super- helix structure, tends to be 11 bp in bacteria and 10 bp in archaea and eukaryotes [17] and even for the same type of dinucleotides in the same nucleosome, being located at different places of the core DNA sequence, such as at the two ends or in the middle section, can make the periodicity fluctuate slightly [18]. In order to take the diversity of periodicity into ac- count, the 10 ~ 11 bp are comprehensively considered as the separation standard, that is, any step having been separated with another step of the same type by 10 ~ 11 bp will be recognized as a periodic step and marked with “1”, while if the distance between the neighbouring steps of the same type goes beyond or is not up to this standard, they will be marked with “0”. The ten types of steps collected from 35 nucleosomes are separated into the corresponding “0” and “1” groups accordingly. In the above method for extracting the periodic di- nucleotides, we consider only one period. That is, any neighbouring occurrence of the same type of dinucleo- tides with a distance of 10 ~ 11 bp will be considered a desired periodic pattern. More sophisticated methods, such as the matched mirror position filter (MMPF) [19], can be used to take several periods and their rela- tions into account in a long DNA sequence. In this paper, since we deal with short nucleosome sequences from the PDB, there are not many long periodic pat- terns. Thus, we detect one-period patterns only. Noise and bias in these patterns and related parameter values can be reasonably assumed to be random and should not affect the overall distribution. 2.3. Separation of the Groups in Plots Statistical analysis on the structural characteristics of the “0” and “1” groups is made by producing the value distribution histograms of the six base pair step pa- rameters. By categorizing the distribution trends, we can give a detailed description as to the deformation preferences of dinucleotide steps in terms of angular and translational parameters and summarize the possi- ble roles of the significant steps which facilitate DNA bending. 2.4. Calculation of Deformability based on Step Conformational Energy The conformational energies reflect the fluctuations and correlations of structural parameters and also de- scribe the deformability of dinucleotides at the global level rather than in one dimension. The conformational energy for each base-pair step is estimated by the function based on the fluctuations of step parameters from their equilibrium values [14] 1 2 T i EF All the dinucleotides collected from the 35 nu- cleosomes are considered as a set of experimental ob- servations, and parameter values averaged over this dataset represent the equilibrium geometrical states of steps. Thus the deviation matrix ΔΘ and its transpose ΔΘT can be obtained: ΔΘ = (Δθ1 ,…, Δθ6) and Δθi = θi –θi° (i = 1 ,…, 6). The covariance matrix of the step parameters M calculated over the same set of DNA structures is used to deduce the dimmer stiffness ma- trix F: M = kTF-1 [13]. For simplicity, the Boltzmann’s constant k and absolute temperature T is recognized as unity and set to 1 because the relative deformability of steps is not influenced by the value of kT, and in this sense, the calculation result is a kind of energy score rather than the real energy unit in joule. 3. RESULTS AND DISCUSSION 3.1. Frequency Distribution of Step Parameter Values The number of CG steps is especially limited in all the 35 nucleosomes. 1KX4 is a special one in which four CGs are found. For 25 nucleosomes there are only two CGs in each sequence with an interval of 7 ~ 8 bp while for the remaining 9 nucleosomes, no CG can be found at all. This explains why all the CG steps in the 35 nucleosomes are categorized into the CG0 group. The values of Shift, Slide, Roll and Tilt distribute over both negative and positive ranges. Twist pre- dominantly takes a positive value with two exceptions: –138.4º and –179.1º of TC/GA occurring in 1S32 and 3C1C respectively. Rise is generally considered as the most conserved parameter not only at each step type but also between the types in order to keep the hydro- phobic interaction between two base pairs when a di- nucleotide conformation changes [20,21]. It is also the case in nucleosomes since the averaged Rise values for the 10 types of steps are restricted into 3.2 ~ 3.5 Å with very small SD values. However, there still exist a  X. Yang et al. / J. Biomedical Science and Engineering 3 (2010) 331-339 Copyright © 2010 SciRes. JBiSE 333 few steps with negative Rise values as well as values exceeding 6 Å. Finally, for all the 10 unique steps, their “0” groups have very similar distributions with their respective “1” groups on the parameter Rise, Tilt and Twist, and hence the “0” versus “1” differences in terms of the value distribution pattern on these three parameters are not discussed here. For the value of Shift, AA/TT, AC/GT, AG/CT, AT, CA/TG and TA have no significantly different distri- bution patterns between the 0 and 1 groups and the overall preferences of value signs of these steps are not obvious in the distribution plots. But for GA/TC, GC and GG/CC (Figures 1(a) to 1(c)), the “0” and “1” distinction that “1” group tends to assume extreme values in both directions, does exist. In comparison with the relatively evenly distributed values of GG/CC0, GG/ CC1 group has two modes around 1Å and –1 Å meaning that most GG/CC steps in compli- ance with the 10~11 bp periodicity tend to take large Shift value, and GC follows in the same way. Al- though the peak of GA/TC1 distribution does not oc- cupy values as large as GG/CC1 or GC1, the “1” group of GA/TC still shows clear preferences of taking non-zero Shift values. In addition, most CG steps tend to take positive Shift values. For the values of Slide, AA/TT, AC/GT, AT, CA/TG, GA/TC and TA have no significantly different distribu- tion patterns between the 0 and 1 group. On the other hand, AG/CT, GC and GG/CC have very similar Slide value distribution modes: “1” groups mainly distribute over the positive Slide range while their “0” groups span a relatively wider range towards both directions (Fig- ures 1(d) to 1(f)). With very few exceptions, CG dinu- cleotides predominantly take positive Slide values. For the value of Roll, the “0” groups of AA/TT, AC/ GT, CA/TG, GA/TC and GG/CC have similar distribu- tion patterns with their corresponding “1” groups. On the other hand, AG/CT, AT, GC and TA show relatively prominent differences in their respective “0” versus “1” groups (Figures 1(g) to 1(j)). Particularly, the Roll val- ues of “1” group in AG/CT mainly fall into the negative range while most Roll values in the “0” group have a positive sign. The “1” group of GC also chiefly takes a negative Roll value but its “0” group has a more even distribution towards both positive and negative direc- tions. The distribution patterns of “0” and “1” groups in AT and TA, in which the majority in the “1” groups are positive and “0” groups subtly incline to negative, seems to be the opposite of AG/CT and GC. 3.2. Average and Standard Deviation of the Absolute Values of Parameters Table 1 summarizes the average values and standard deviations of the absolute values of base-pair parame- ters for the 10 unique sequential base-pair steps in their “1” and “0” groups. Calculations on absolute values of the parameters ignore the effects of rota- tional and translational direction and only take the degree of deformation into consideration. The per- formances on the average degree of deformation in terms of net rotational and translational parameters can be divided into the following four kinds: 1) GC: steps with periodicity have larger net values than those without periodicity on five of six parameters. 2) TA, AG/CT and GG/CC: steps with periodicity have larger net values on four of six parameters. 3) CA/TG and AC/GT: steps with periodicity exceed those without periodicity only on three of six parameters, in other words, in terms of three parameters, steps having no periodicity have greater net values than steps with pe- riodicity. 4) AA/TT, GA/TC and AT: steps without periodicity exceed those with periodicity on five of six parameters which is exactly contrary to 1). It might also be noted that CG has remarkable average values of Shift, Slide and Twist. The averaged net Roll and SD values of the GG/CC0 group are significantly higher than those of the GG/CC1 group. Similarly, the GA/TC0 group has much larger averaged net Tilt value and SD than the GA/TC1 group. 3.3. Helical Parameters Reflect Structural Features of Dinucleotide Steps with Periodicity In our studies, the statistical result of the value distri- bution frequency of the “0” and “1” groups of the 10 independent dinucleotide steps indicates that apparent differences between dinucleotides with periodicity and those without periodicity exist mainly in three helical parameters: Shift, Slide and Roll. They can be recog- nized as key parameters that drive the structural vari- ability of periodic steps from others of the same type but without periodicity. Our finding supports Suzuki and Tolstorukov’s theories [9,21] that Roll and Slide are the most important media by which particular di- nucleotides exert their deformation properties on the overall structure of naked DNA or nucleosomes, and moreover, for types like AG/CT, GC, GG/CC, AT and TA in nucleosomes, their regular occurrences with the 10.5 bp periodicity along the DNA sequence endow these two parameters with unusual values and distribu- tion trends. Indeed, Twist is an especially important parameter for describing dinucleotides’ local behavior of “kinks”. “Kinks” have impacts on the overall stretching of DNA sequence and to some extent influ- ence dinucleotide periodicity. However, our results show that differences on Twist between the periodic and the non-periodic are not that obvious. Shift, which used to be excluded from the collection of key pa- rameters, is in our conclusion another essential indi- cator of periodicity-dependent conformational attrib-  X. Yang et al. / J. Biomedical Science and Engineering 3 (2010) 331-339 Copyright © 2010 SciRes. JBiSE 334 (a) (b) (c) (d) (e) (f) (g) (h) (i) (j) Figure 1. Frequency distribution of step parameter values. Roll(°) Number of Dinucleotides Number of Dinucleotides Shift(Å) Number of Dinucleotides Shift(Å) Number of Dinucleotides Shift(Å) Number of Dinucleotides Slide(Å) Number of Dinucleotides Slide(Å) Number of Dinucleotides Slide(Å) Number of Dinucleotides Roll(°) Number of Dinucleotides Roll(°) Number of Dinucleotides Roll(°)  X. Yang et al. / J. Biomedical Science and Engineering 3 (2010) 331-339 Copyright © 2010 SciRes. JBiSE 335 Ta b le 1 . Average and standard deviation of the absolute values of base-pair parameters for the “0” and “1” groups of the 10 dinucleotide steps. Step N Shift (Å) Slide (Å) Rise (Å) Roll (º) Tilt (º) Twist (º) CA/TG0 497 0.620.47 ‡ 0.950.80 3.550.45 * 11.47.5 ‡ 4.0.3.5 ‡ 37.46.9 CA/TG1 468 0.560.48 *‡ 1.410.92 3.410.59 9.112.3 ‡ 5 .414.3 *‡ 41.110.6 CG0 56 0.790.46 1.380.42 3.440.22 4.93.5 3.42.7 40.94.4 CG1 0 TA0 108 ‡ 0.390.38 ‡ 0.470.53 3.550.47 ‡ 8.47.1 ‡ 3.83.9 38.55.8 TA1 124 ‡ 0.540.54 ‡ 0.490.38 3.410.40 ‡ 9.76.7 ‡ 4.84.0 35.65.3 AA/TT0 630 0.440.35 0.340.30 3.360.54 ‡ 5.44.6 3.83.2 36.26.1 AA/TT1 355 0.410.32 0.330.30 3.340.40 ‡ 6.95.3 3.33.1 35.05.7 GA/TC0 371 0.830.60 0.690.61 ‡ 3.33 0.65 6.54.9 *7.719.6 36.714.3 GA/TC1 262 0.680.40 0.360.26 ‡ 3.39 0.55 4.43.0 4.23.4 35.95.5 AG/CT0 351 ‡ 0.700.49 ‡ 0.430.38 ‡ 3.390.30 8.25.1 4.43.8 ‡ 33.34.2 AG/CT1 249 ‡ 0.890.55 ‡ 0.860.48 ‡ 3.410.46 6.14.6 3.93.2 ‡ 37.05.6 GG/CC0 348 ‡ 0.660.47 ‡ 0.690.52 3.340.59 10.19.2 ‡ 4.54.6 ‡ 33.27.0 GG/CC1 144 *‡ 1.110.42 ‡ 0.720.39 3.240.36 4.94.2 ‡ 5.8 4.2 ‡ 33.55.0 AT0 381 0.450.37 0.740.33 3.190.36 ‡ 3.73.0 3.22.6 32.04.8 AT1 144 0.410.36 0.610.29 3.110.27 ‡ 4.34.0 2.92.5 28.33.7 GC0 224 ‡ 0.780.54 ‡ 0.620.43 ‡ 3.350.46 ‡ 5.44.4 4.84.2 ‡ 36.84.7 GC1 68 ‡ 0.930.47 ‡ 0.950.56 *‡ 3.610.56 ‡ 6.65.2 3.83.1 ‡ 37.68.1 AC/GT0 263 ‡ 0.520.38 ‡ 0.590.39 3.300.45 ‡ 4.83.2 4.14.2 31.35.3 AC/GT1 196 ‡ 0.540.43 ‡ 0.670.35 3.170.46 ‡ 5.93.7 4.13.2 29.55.5 Absolute value of every step on each parameter is calculated, and then the mean parameter value and standard deviation for each group are calculated. Number of subscript represents standard deviation. * Maximum mean value for each parameter selected from all groups. ‡ Situation in which the mean value of the “1” group on one parameter is higher than that of “0” group. utes of dinucleotides. Despite the fact that the mean Shift values are very small for all groups, the standard devia- tions are fairly considerable which means Shift values vary greatly even within each type and within each group, and this phenomenon of small mean values but large SD can be explained by the fact that the large positive values and large net negative values cancel each other out. Sta- tistics on the value range and averaged absolute value support this interpretation as well and prove that in the case of nucleosomes, Shift distance is nearly comparable to Slide in respect of deformation degree and value vari- ability. 3.4. Deformability of Steps The six structural parameters are in fact interdependent and the one-dimensional study is quite limited in charac- terizing the flexibility of various dinucleotide steps. The step conformational energies incorporate these structural features and well outline the deformability of the peri- odic and the non-periodic dinucleotides. For a certain type of dinucleotide in each nucleosome, the representa- tive energy score for the “0” or “1” group of this type is defined as the average product of energy values of all the steps in this group. A complete list of dinucleotide en- ergy scores calculated in this way over the 35 nu- cleosomes is given in Appendix. For dinucleotides of AA/TT, AT, AG/CT, CA/TG and GC type, the number of periodic groups having higher energy scores than the corresponding non-periodic groups is close to or ap- proximately the same with that of non-periodic groups having higher energy scores than periodic groups of the same type among all the nucleosome samples. In a sta- tistical sense the observed deformabilities of periodic dinucleotides of these types are almost identical with their non-periodic counterparts. It is also found that in most of the 35 nucleosome cases the GA/TC0 and GG/CC0 groups have greater energy scores than corre- sponding GA/TC1 and GG/CC1 groups, with the pro- portions up to 88.5% and 79.4% of the total samples respectively. On the contrary, the quantity of nu- cleosomes in which the energy scores of AC/GT1 and TA1 groups exceed those of AC/GT0 and TA0 groups accounts for 80% and 87.8% of the total number of nu- cleosomes respectively. It is concluded that periodic GA/TC and GG/CC steps have greater deformability than their non-periodic counterparts while periodic AC/GT and TA steps appear more rigid than the non-periodic AC/GT and TA steps.  X. Yang et al. / J. Biomedical Science and Engineering 3 (2010) 331-339 Copyright © 2010 SciRes. JBiSE 336 4. SUMMARY AA/TT steps belong to the type whose conformational settings are not very susceptible to the 10.5 periodicity. In the parameter value frequency histogram, AA/TT steps with periodicity have no clear differences from those without periodicity. The mean absolute values, value variabilities for the periodic and non-periodic steps are also very close to each other. Although statistics on step conformational energy reveals that the probability of the non-peiodic group requiring higher amount of energy to deform is higher than that of the periodic group re- quiring higher energy, it is still not predominant enough to discriminate the non-periodic group from the periodic group. The above results may suggest that the periodicity of AA/TT steps, on the whole, does not produce particu- lar effects on their conformation features. AA/TT or A-tracts are most likely to play the role of exerting con- text influences on their neighbor dinucleotides and oc- cupy specific positions to facilitate the bending of DNA around the histone core [22,23]. AC/GT can also be categorized into the periodicity- unsusceptible type. The relations and comparisons of the six parameters between periodic AC/GT and non-peri- odic AC/GT on value frequency plots, averaged net val- ues and their standard deviations are quite similar to that of AA/TT. Compared with the non-periodic ones, to some extent periodic AC/GT steps are more rigid. AG/CT steps can be characterized as very susceptible to the 10.5 periodicity. Firstly, there are obvious differ- ences in the plots of value occurrences on Slide and Roll between the 10.5 bp-periodic AG/CT steps and the non-periodic ones. Secondly, periodic AG/CT steps have clearly different performances from non-periodic ones on averaged net values and value standard deviations, fur- ther testifying that the structural feature of AG/CT in terms of some parameters is correlated with periodic step occurrences in the DNA sequence. AT steps have limited structural susceptibility to the 10.5 periodicity. On the frequency plots of parameter values, periodic steps are different from non-periodic steps on the parameter Roll, but non-periodic AT steps exceed periodic ones on five of the six parameters in the measurement of the mean net values. It can be concluded that the 10.5 periodicity is a structural feature of AT but may not necessarily contribute to sharp deformation in nucleosomes. CA/TG steps are also susceptible to the 10.5 perio- dicity. Although the periodic group does not show any apparent differences from the non-periodic group on distribution plots of value occurrences and averaged values, the periodic group has much larger standard deviations than the non-periodic group. This implies that the 10.5 periodicity expressed in CA/TG steps have very large parameter value variability. CA/TG is ac- knowledged by most reports as being the most flexible steps that may act as “hinge” fitting the duplex to the protein surface due to its great structural variability and low energy consumption for bending [9,10,14,20,24]. CG steps are all marked as non-periodic, but notably they have distinct preferences of parameter value occur- rences. Most CG steps take negative Shift and Roll val- ues and positive Slide values. CG also has a large aver- aged net value on Twist which is only slightly lower than CA/TG1, while the corresponding standard deviation for net Twist values is much smaller than that of CA/TG1. It means that CG steps uniformly have a large degree of Twist. GA/TC steps also have a certain degree of structural susceptibility to the 10.5 periodicity. Compared with non-periodic ones, GA/TC steps with 10.5 bp periodicity display a slightly different value distribution on Shift and obviously more deformability than the non-periodic ones. The GC step is another kind of dinucleotides par- ticularly sensitive to the 10.5 periodicity. Periodic GC steps have clearly distinguishing distribution patterns from non-periodic steps on value occurrences statistical plots of Shift, Roll and Slide. The periodic group also has larger averaged net values and standard deviations than the latter on five of the six parameters. The GG/CC steps also belong to the periodicity-susceptible type. Steps with 10.5 bp periodicity have different distri- butions of value occurrences from non-periodic ones on Shift and Slide. The averaged net values of periodic ones are higher than those of non- periodic ones on four of the six parameters. The periodic GG/CC steps also have ob- viously more deformability than non-periodic ones. However, it still should be noted that the standard devia- tions of non-periodic GG/CC steps are higher than those of periodic ones on six parameters in case of mean net values, and the non-periodic group has far larger aver- aged net Roll value and standard deviations than the pe- riodic group. Thus, the influence of periodicity on GG/CC is interpreted as partially reinforcing the de- formability while restricting bending and shearing vari- ability. TA steps have a certain degree of sensitivity to the 10.5 bp periodicity. Differences between periodic ones and non-periodic ones on Roll value distribution fre- quency plots can be observed but are relatively subtle. The mean net values of periodic steps exceed those of the non-periodic ones on four of the six parameters, and standard deviations on each parameter for the two groups, however, are quite close to each other. The result of en- ergy score calculation also reveals periodic TA steps are more rigid than non-periodic ones. The periodicity, by all counts, has limited influences on TA steps. To summarize all the above analysis comprehensively, the dinucleotide steps AG/CT, GC and GG/CC are most immediately affected by the 10.5 bp periodicity. Periodic occurrences along the nucleosomal DNA sequence as-  X. Yang et al. / J. Biomedical Science and Engineering 3 (2010) 331-339 Copyright © 2010 SciRes. JBiSE 337 sign them distinct shearing and bending preferences, greater degrees of deformation and variability. Steps CA/TG, GA/TC and TA can be divided into the second category that is modestly influenced by the 10.5 perio- dicity. Undoubtedly, special conformational trends on some aspects do appear for periodic ones in this category, compared with the first class above, however, trends for the separation of periodic ones from non-periodic ones are not prominent enough or all the separation standards cannot be satisfied at the same time. Steps AA/TT, AC/GT and AT fall into the third category that is least structurally influenced by the 10.5 periodicity, which means that the structural attributes of periodic steps in this category is similar to non-periodic ones. Finally, susceptibility of CG to 10.5 bp periodicity cannot be evaluated because of lack of enough nucleosome samples, but as a YR-type dimer it should have considerable in- fluence on DNA deformation. 5. ACKNOWLEDGEMENT This work is supported by the Hong Kong Research Grant Council (Project CityU 123408). REFERENCES [1] Zhurkin, V.B. (1983) Specific alignment of nucleosomes on DNA correlates with periodic distribution of purine- pyrimidine and pyrimidine-purine dimers. FEBS Letters, 158(2), 293-297. [2] Sarchwell, S.C., Drew, H.R. and Travers, A.A. (1986) Sequence periodicities in chicken nucleosome core DNA. Journal of Molecular Biology, 191(4), 659-675. [3] Simpson, R.T. (1991) Nucleosome positioning: Occu- rrence, mechanisms, and functional consequences. Pro- gress in Nucleic Acid Research and Molecular Biology, 40, 143-184. [4] Peckham, H.E., Thurman, R.E., Fu, Y., Stamato- yannopoulos, J.A., Nobel, W.S., Struhl, K. and Weng, Z. (2007) Nucleosome positioning signals in genomic DNA. Genome Research, 17(8), 1170-1177. [5] Salih, F., Salih, B. and Trifonov, E.N. (2008) Sequence structure of hidden 10.4-base repeat in the nucleosomes of C. elegans. Journal of Biomolecular Structure and Dynamics, 26(3), 273-281. [6] Trifonov, E.N. (1998) 3-, 10.5-, 200- and 400-base perio- dicities in genome sequences. Physica A, 249(1-4), 511- 516. [7] Widom, J. (2001) Role of DNA sequence in nucleosome stability and dynamics. Quarterly Reviews of Biophysics, 34, 269-324. [8] Segal, E., Fondufe-Mittendorf, Y., Chen, L., Thåström, A., Field, Y., Moore, I.K., Wang, J.Z. and Widom, J. (2006) A genomic code for nucleosome positioning. Nature, 442(7104), 772-778. [9] Tolstorukov, M.Y., Colasanti, A.V., McCandlish, D.M., Olson, W.K. and Zhurkin, V.B. (2007) A novel roll-and- slide mechanism of DNA folding in chromatin: Impli- cations for nucleosome positioning. Journal of Molecular Biology, 371(3), 725-738. [10] Bolshoy, A., McNamara, P., Harrington, R.E. and Trifonov, E.N. (1991) Curved DNA without A-A: Experimental estimation of all 16 DNA wedge angles. Proceedings of the National Academy of Sciences, 88(6), 2312-2316. [11] Packer, M.J., Dauncey, M.P. and Hunter, C.A. (2000) Sequence-dependent DNA structure: Dinucleotide confor mational maps. Journal of Molecular Biology, 295(1), 71-83. [12] Bishop, T.C. (2005) Molecular dynamics simulations of a nucleosome and free DNA. Journal of Biomolecular Structure and Dynamics, 22(6), 673-686. [13] Fujii, S., Kono, H., Takenaka, S., Go, N. and Sarai, A. (2007) Sequence-dependent DNA deformability studied using molecular dynamics simulations. Nucleic Acids Research, 35(18), 6063-6074. [14] Olson, W.K., Gorin, A.A., Lu, X., Hock, L.M. and Zhurkin, V.B. (1998) DNA sequence-dependent defor- mability deduced from protein-DNA crystal complexes. Proceedings of the National Academy of Sciences, 95(19), 11163-11168. [15] Lu, X. and Olson, W.K. (2003) 3DNA: A software package for the analysis, rebuilding and visualization of three-dimensional nucleic acid structures. Nucleic Acids Research, 31(17), 5108-5121. [16] Trifonov, E.N. (1980) Sequence-dependent deforma- tional anisotropy of chromatin DNA. Nucleic Acids Research, 8(17), 4041-4053. [17] Worning, P., Jensen, L.J., Nelson, K.E., Brunak, S. and Ussery, D.W. (2000) Structural analysis of DNA se- quence: Evidence for lateral gene transfer in Thermotoga maritima. Nucleic Acids Research, 28(3), 706-709. [18] Liu, H., Wu, J., Xie, J., Yang, X., Lu, Z. and Sun, X. (2008) Characteristics of nucleosome core DNA and their applications in predicting nucleosome positions. Biophy- sical Journal, 94(12), 4597-4604. [19] Wu, Q., Wang J. and Yan, H. (2009) Prediction of nucleosome positions in the yeast genome based on matched mirror position filtering. Bioinformation, 3(10), 454-459. [20] Suzuki, M., Yagi, N. and Finch, J.T. (1996) Role of base-backbone and base-base interactions in alternating DNA conformations. FEBS letters, 379(2), 148-152. [21] Suzuki, M., Amano, N., Kakinuma, J. and Tateno, M. (1997) Use of a 3D structure data base for understanding sequence-dependent conformational aspects of DNA. Journal of Molecular Biology, 274(3), 421-435. [22] Sarai, A., Mazur, J., Nussinov, R. and Jernigan, R.L. (1989) Sequence dependence of DNA conformational flexibility. Biochemist ry, 28(19), 7842-7849. [23] Young, M.A., Ravishanker, G., Beveridge, D.L. and Berman, H.M. (1995) Analysis of local helix bending in crystal structures of DNA oligonucleotides and DNA- protein complexes. Biophysical Journal, 68(6), 2454- 2468. [24] Bharanidharan, D. and Gautham, N. (2006) Principle component analysis of DNA oligonucleotide structural data. Biochemical and Biophysical Research Commu- nications, 340(4), 1229-1237. 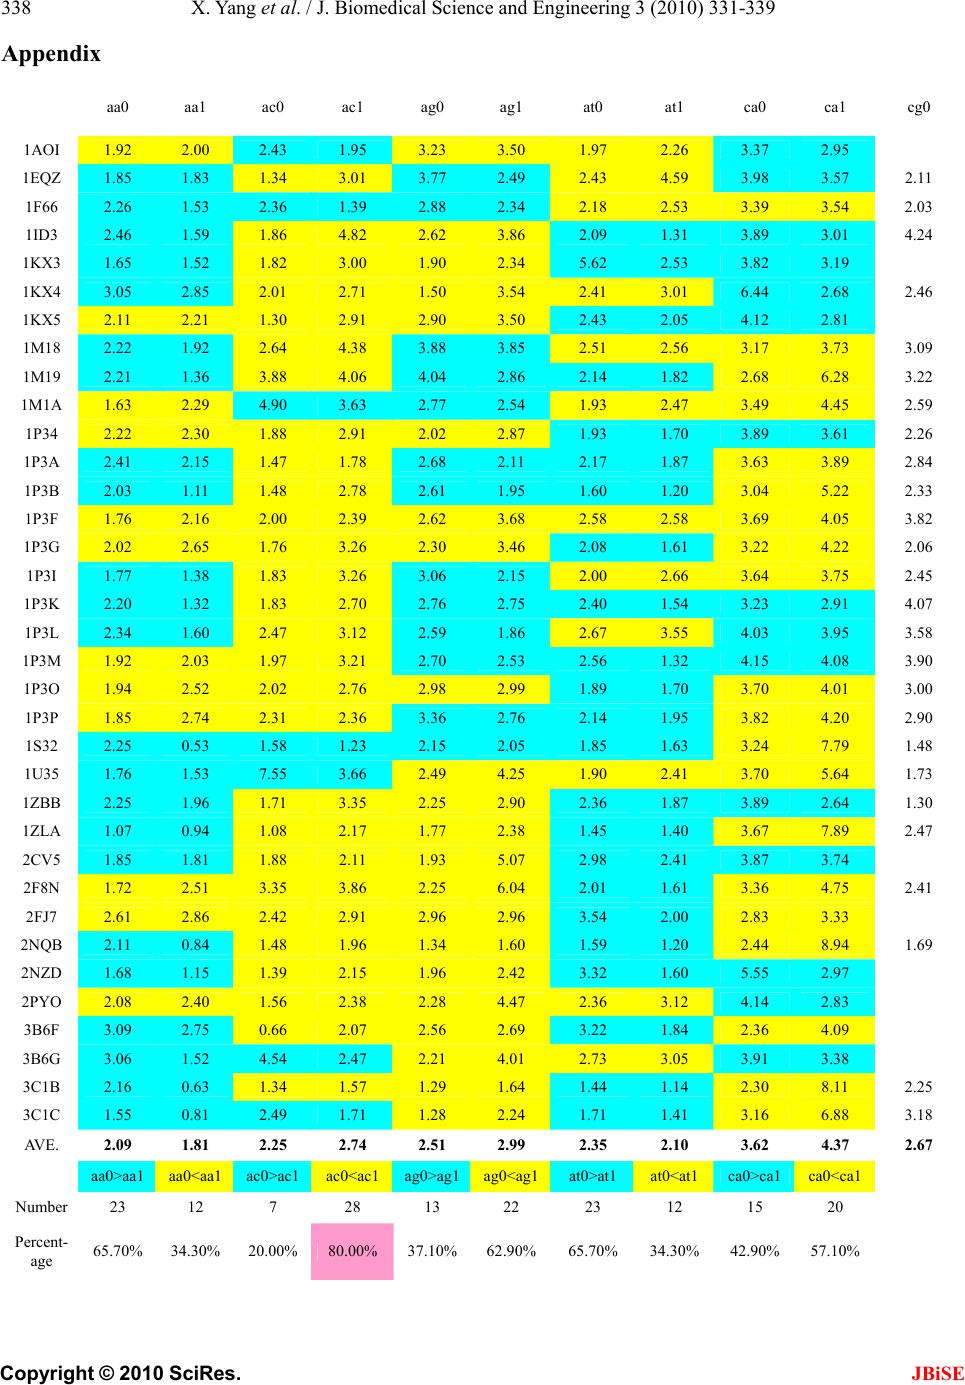 X. Yang et al. / J. Biomedical Science and Engineering 3 (2010) 331-339 Copyright © 2010 SciRes. JBiSE 338 Appendix aa0 aa1 ac0 ac1 ag0 ag1 at0 at1 ca0 ca1 cg0 1AOI 1.92 2.00 2.43 1.95 3.23 3.50 1.97 2.26 3.37 2.95 1EQZ 1.85 1.83 1.34 3.01 3.77 2.49 2.43 4.59 3.98 3.57 2.11 1F66 2.26 1.53 2.36 1.39 2.88 2.34 2.18 2.53 3.39 3.54 2.03 1ID3 2.46 1.59 1.86 4.82 2.62 3.86 2.09 1.31 3.89 3.01 4.24 1KX3 1.65 1.52 1.82 3.00 1.90 2.34 5.62 2.53 3.82 3.19 1KX4 3.05 2.85 2.01 2.71 1.50 3.54 2.41 3.01 6.44 2.68 2.46 1KX5 2.11 2.21 1.30 2.91 2.90 3.50 2.43 2.05 4.12 2.81 1M18 2.22 1.92 2.64 4.38 3.88 3.85 2.51 2.56 3.17 3.73 3.09 1M19 2.21 1.36 3.88 4.06 4.04 2.86 2.14 1.82 2.68 6.28 3.22 1M1A 1.63 2.29 4.90 3.63 2.77 2.54 1.93 2.47 3.49 4.45 2.59 1P34 2.22 2.30 1.88 2.91 2.02 2.87 1.93 1.70 3.89 3.61 2.26 1P3A 2.41 2.15 1.47 1.78 2.68 2.11 2.17 1.87 3.63 3.89 2.84 1P3B 2.03 1.11 1.48 2.78 2.61 1.95 1.60 1.20 3.04 5.22 2.33 1P3F 1.76 2.16 2.00 2.39 2.62 3.68 2.58 2.58 3.69 4.05 3.82 1P3G 2.02 2.65 1.76 3.26 2.30 3.46 2.08 1.61 3.22 4.22 2.06 1P3I 1.77 1.38 1.83 3.26 3.06 2.15 2.00 2.66 3.64 3.75 2.45 1P3K 2.20 1.32 1.83 2.70 2.76 2.75 2.40 1.54 3.23 2.91 4.07 1P3L 2.34 1.60 2.47 3.12 2.59 1.86 2.67 3.55 4.03 3.95 3.58 1P3M 1.92 2.03 1.97 3.21 2.70 2.53 2.56 1.32 4.15 4.08 3.90 1P3O 1.94 2.52 2.02 2.76 2.98 2.99 1.89 1.70 3.70 4.01 3.00 1P3P 1.85 2.74 2.31 2.36 3.36 2.76 2.14 1.95 3.82 4.20 2.90 1S32 2.25 0.53 1.58 1.23 2.15 2.05 1.85 1.63 3.24 7.79 1.48 1U35 1.76 1.53 7.55 3.66 2.49 4.25 1.90 2.41 3.70 5.64 1.73 1ZBB 2.25 1.96 1.71 3.35 2.25 2.90 2.36 1.87 3.89 2.64 1.30 1ZLA 1.07 0.94 1.08 2.17 1.77 2.38 1.45 1.40 3.67 7.89 2.47 2CV5 1.85 1.81 1.88 2.11 1.93 5.07 2.98 2.41 3.87 3.74 2F8N 1.72 2.51 3.35 3.86 2.25 6.04 2.01 1.61 3.36 4.75 2.41 2FJ7 2.61 2.86 2.42 2.91 2.96 2.96 3.54 2.00 2.83 3.33 2NQB 2.11 0.84 1.48 1.96 1.34 1.60 1.59 1.20 2.44 8.94 1.69 2NZD 1.68 1.15 1.39 2.15 1.96 2.42 3.32 1.60 5.55 2.97 2PYO 2.08 2.40 1.56 2.38 2.28 4.47 2.36 3.12 4.14 2.83 3B6F 3.09 2.75 0.66 2.07 2.56 2.69 3.22 1.84 2.36 4.09 3B6G 3.06 1.52 4.54 2.47 2.21 4.01 2.73 3.05 3.91 3.38 3C1B 2.16 0.63 1.34 1.57 1.29 1.64 1.44 1.14 2.30 8.11 2.25 3C1C 1.55 0.81 2.49 1.71 1.28 2.24 1.71 1.41 3.16 6.88 3.18 AV E . 2.09 1.81 2.25 2.74 2.51 2.99 2.35 2.10 3.62 4.37 2.67 aa0>aa1 aa0<aa1 ac0>ac1 ac0<ac1 ag0>ag1 ag0<ag1at0>at1 at0<at1 ca0>ca1 ca0<ca1 Number 23 12 7 28 13 22 23 12 15 20 Percent- age 65.70% 34.30% 20.00% 80.00% 37.10%62.90%65.70% 34.30% 42.90% 57.10% 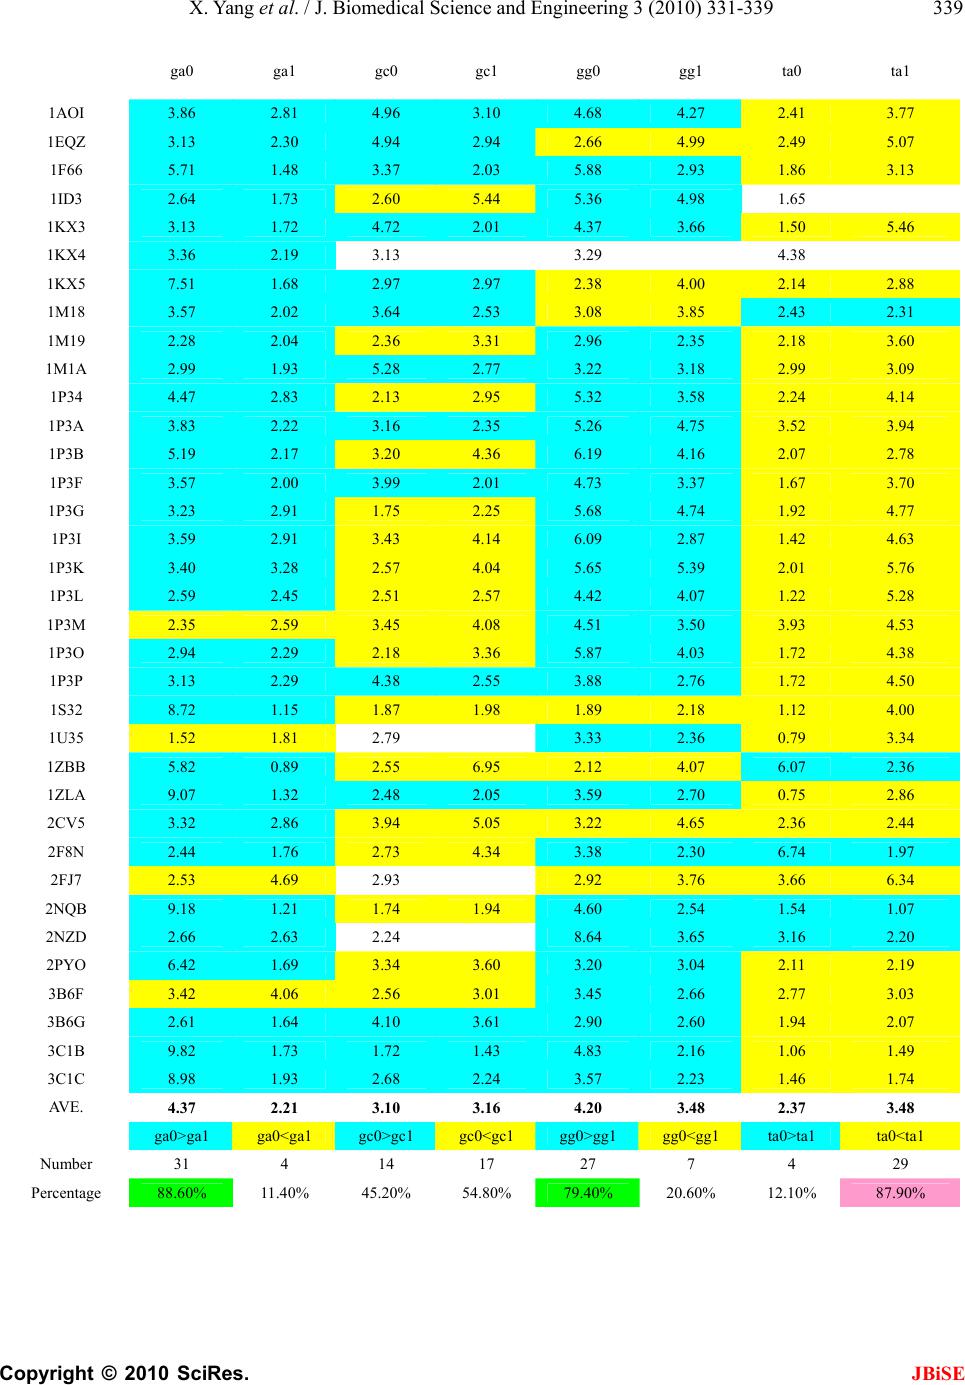 X. Yang et al. / J. Biomedical Science and Engineering 3 (2010) 331-339 Copyright © 2010 SciRes. JBiSE 339 ga0 ga1 gc0 gc1 gg0 gg1 ta0 ta1 1AOI 3.86 2.81 4.96 3.10 4.68 4.27 2.41 3.77 1EQZ 3.13 2.30 4.94 2.94 2.66 4.99 2.49 5.07 1F66 5.71 1.48 3.37 2.03 5.88 2.93 1.86 3.13 1ID3 2.64 1.73 2.60 5.44 5.36 4.98 1.65 1KX3 3.13 1.72 4.72 2.01 4.37 3.66 1.50 5.46 1KX4 3.36 2.19 3.13 3.29 4.38 1KX5 7.51 1.68 2.97 2.97 2.38 4.00 2.14 2.88 1M18 3.57 2.02 3.64 2.53 3.08 3.85 2.43 2.31 1M19 2.28 2.04 2.36 3.31 2.96 2.35 2.18 3.60 1M1A 2.99 1.93 5.28 2.77 3.22 3.18 2.99 3.09 1P34 4.47 2.83 2.13 2.95 5.32 3.58 2.24 4.14 1P3A 3.83 2.22 3.16 2.35 5.26 4.75 3.52 3.94 1P3B 5.19 2.17 3.20 4.36 6.19 4.16 2.07 2.78 1P3F 3.57 2.00 3.99 2.01 4.73 3.37 1.67 3.70 1P3G 3.23 2.91 1.75 2.25 5.68 4.74 1.92 4.77 1P3I 3.59 2.91 3.43 4.14 6.09 2.87 1.42 4.63 1P3K 3.40 3.28 2.57 4.04 5.65 5.39 2.01 5.76 1P3L 2.59 2.45 2.51 2.57 4.42 4.07 1.22 5.28 1P3M 2.35 2.59 3.45 4.08 4.51 3.50 3.93 4.53 1P3O 2.94 2.29 2.18 3.36 5.87 4.03 1.72 4.38 1P3P 3.13 2.29 4.38 2.55 3.88 2.76 1.72 4.50 1S32 8.72 1.15 1.87 1.98 1.89 2.18 1.12 4.00 1U35 1.52 1.81 2.79 3.33 2.36 0.79 3.34 1ZBB 5.82 0.89 2.55 6.95 2.12 4.07 6.07 2.36 1ZLA 9.07 1.32 2.48 2.05 3.59 2.70 0.75 2.86 2CV5 3.32 2.86 3.94 5.05 3.22 4.65 2.36 2.44 2F8N 2.44 1.76 2.73 4.34 3.38 2.30 6.74 1.97 2FJ7 2.53 4.69 2.93 2.92 3.76 3.66 6.34 2NQB 9.18 1.21 1.74 1.94 4.60 2.54 1.54 1.07 2NZD 2.66 2.63 2.24 8.64 3.65 3.16 2.20 2PYO 6.42 1.69 3.34 3.60 3.20 3.04 2.11 2.19 3B6F 3.42 4.06 2.56 3.01 3.45 2.66 2.77 3.03 3B6G 2.61 1.64 4.10 3.61 2.90 2.60 1.94 2.07 3C1B 9.82 1.73 1.72 1.43 4.83 2.16 1.06 1.49 3C1C 8.98 1.93 2.68 2.24 3.57 2.23 1.46 1.74 AV E . 4.37 2.21 3.10 3.16 4.20 3.48 2.37 3.48 ga0>ga1 ga0<ga1 gc0>gc1 gc0<gc1 gg0>gg1 gg0<gg1 ta0>ta1 ta0<ta1 Number 31 4 14 17 27 7 4 29 Percentage 88.60% 11.40% 45.20% 54.80% 79.40% 20.60% 12.10% 87.90% |