Paper Menu >>
Journal Menu >>
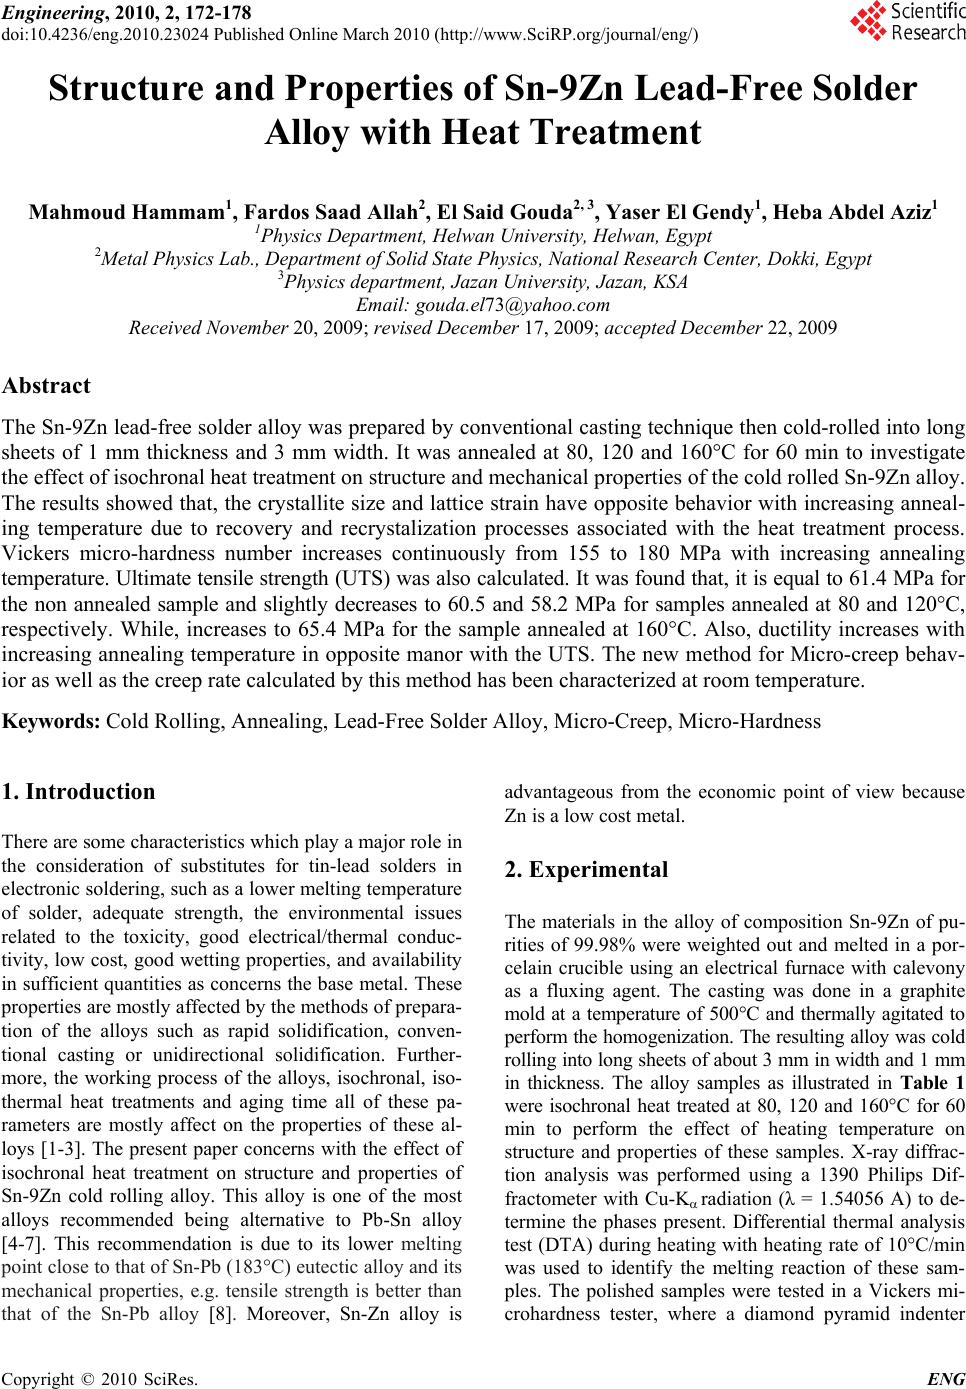 Engineering, 2010, 2, 172-178 doi:10.4236/eng.2010.23024 lished Online March 2010 (http://www.SciRP.org/journal/eng/) Copyright © 2010 SciRes. ENG Pub Structure and Properties of Sn-9Zn Lead-Free Solder Alloy with Heat Treatment Mahmoud Hammam1, Fardos Saad Allah2, El Said Gouda2, 3, Yaser El Gendy1, Heba Abdel Aziz1 1Physics Department, Helwan University, Helwan, Egypt 2Metal Physics Lab., Department of Solid State Physics, National Research Center, Dokki, Egypt 3Physics department, Jazan University, Jazan, KSA Email: gouda.el73@yahoo.com Received November 20, 2009; revised December 17, 2009; accepted December 22, 2009 Abstract The Sn-9Zn lead-free solder alloy was prepared by conventional casting technique then cold-rolled into long sheets of 1 mm thickness and 3 mm width. It was annealed at 80, 120 and 160°C for 60 min to investigate the effect of isochronal heat treatment on structure and mechanical properties of the cold rolled Sn-9Zn alloy. The results showed that, the crystallite size and lattice strain have opposite behavior with increasing anneal- ing temperature due to recovery and recrystalization processes associated with the heat treatment process. Vickers micro-hardness number increases continuously from 155 to 180 MPa with increasing annealing temperature. Ultimate tensile strength (UTS) was also calculated. It was found that, it is equal to 61.4 MPa for the non annealed sample and slightly decreases to 60.5 and 58.2 MPa for samples annealed at 80 and 120°C, respectively. While, increases to 65.4 MPa for the sample annealed at 160°C. Also, ductility increases with increasing annealing temperature in opposite manor with the UTS. The new method for Micro-creep behav- ior as well as the creep rate calculated by this method has been characterized at room temperature. Keywords: Cold Rolling, Annealing, Lead-Free Solder Alloy, Micro-Creep, Micro-Hardness 1. Introduction There are some characteristics which play a major role in the consideration of substitutes for tin-lead solders in electronic soldering, such as a lower melting temperature of solder, adequate strength, the environmental issues related to the toxicity, good electrical/thermal conduc- tivity, low cost, good wetting properties, and availability in sufficient quantities as concerns the base metal. These properties are mostly affected by the methods of prepara- tion of the alloys such as rapid solidification, conven- tional casting or unidirectional solidification. Further- more, the working process of the alloys, isochronal, iso- thermal heat treatments and aging time all of these pa- rameters are mostly affect on the properties of these al- loys [1-3]. The present paper concerns with the effect of isochronal heat treatment on structure and properties of Sn-9Zn cold rolling alloy. This alloy is one of the most alloys recommended being alternative to Pb-Sn alloy [4-7]. This recommendation is due to its lower melting point close to that of Sn-Pb (183°C) eutectic alloy and its mechanical properties, e.g. tensile strength is better than that of the Sn-Pb alloy [8]. Moreover, Sn-Zn alloy is advantageous from the economic point of view because Zn is a low cost metal. 2. Experimental The materials in the alloy of composition Sn-9Zn of pu- rities of 99.98% were weighted out and melted in a por- celain crucible using an electrical furnace with calevony as a fluxing agent. The casting was done in a graphite mold at a temperature of 500°C and thermally agitated to perform the homogenization. The resulting alloy was cold rolling into long sheets of about 3 mm in width and 1 mm in thickness. The alloy samples as illustrated in Table 1 were isochronal heat treated at 80, 120 and 160°C for 60 min to perform the effect of heating temperature on structure and properties of these samples. X-ray diffrac- tion analysis was performed using a 1390 Philips Dif- fractometer with Cu-K radiation (λ = 1.54056 A) to de- termine the phases present. Differential thermal analysis test (DTA) during heating with heating rate of 10°C/min was used to identify the melting reaction of these sam- ples. The polished samples were tested in a Vickers mi- crohardness tester, where a diamond pyramid indenter 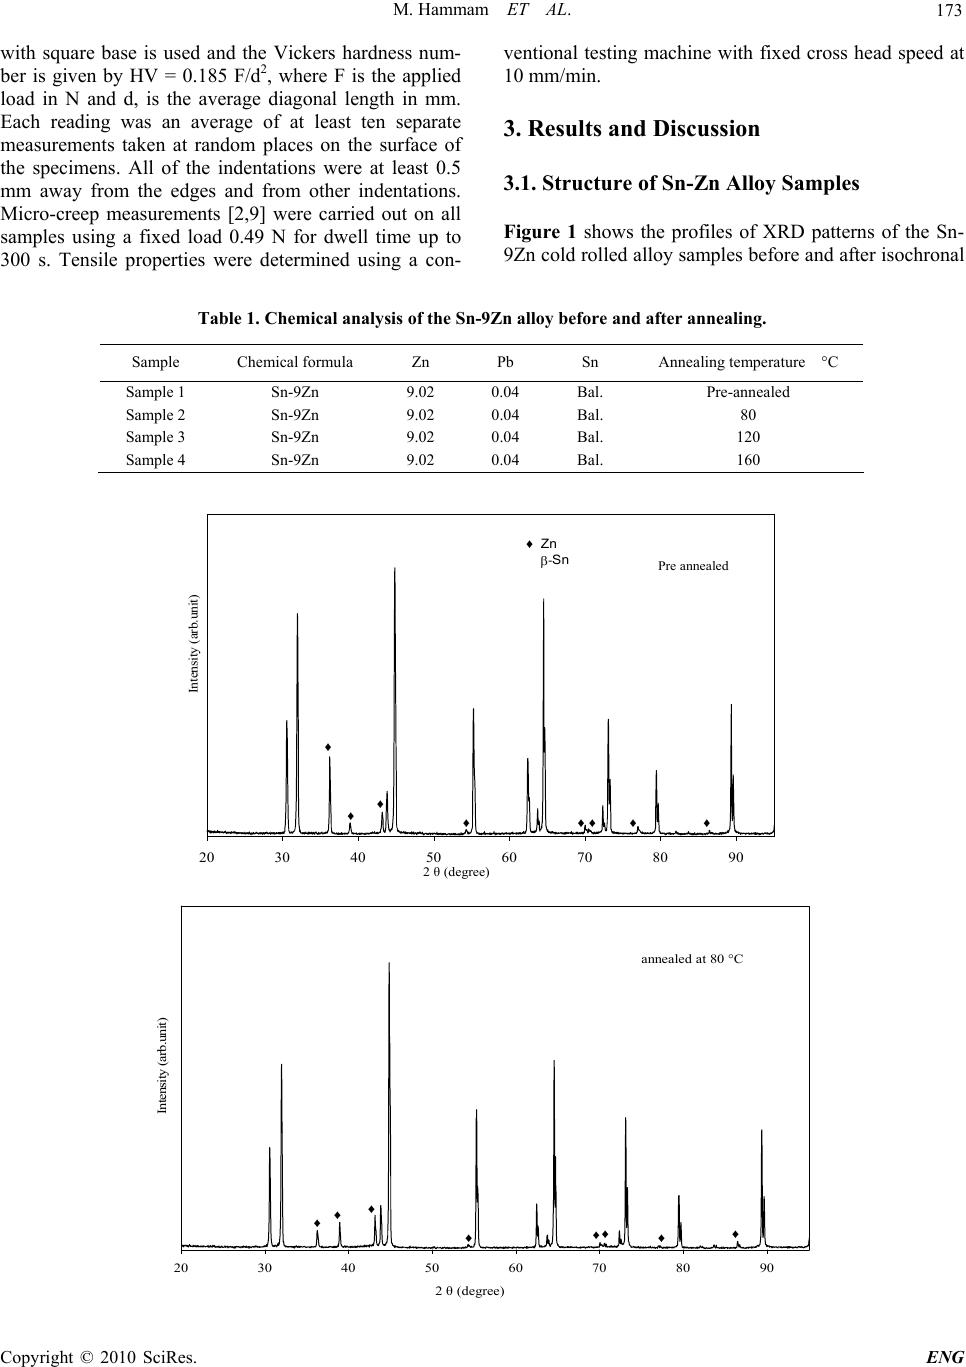 M. Hammam ET AL. 173 with square base is used and the Vickers hardness num- ber is given by HV = 0.185 F/d2, where F is the applied load in N and d, is the average diagonal length in mm. Each reading was an average of at least ten separate measurements taken at random places on the surface of the specimens. All of the indentations were at least 0.5 mm away from the edges and from other indentations. Micro-creep measurements [2,9] were carried out on all samples using a fixed load 0.49 N for dwell time up to 300 s. Tensile properties were determined using a con- ventional testing machine with fixed cross head speed at 10 mm/min. 3. Results and Discussion 3.1. Structure of Sn-Zn Alloy Samples Figure 1 shows the profiles of XRD patterns of the Sn- 9Zn cold rolled alloy samples before and after isochronal Table 1. Chemical analysis of the Sn-9Zn alloy before and after annealing. Sample Chemical formula Zn Pb Sn Annealing temperature °C Sample 1 Sn-9Zn 9.02 0.04 Bal. Pre-annealed Sample 2 Sn-9Zn 9.02 0.04 Bal. 80 Sample 3 Sn-9Zn 9.02 0.04 Bal. 120 Sample 4 Sn-9Zn 9.02 0.04 Bal. 160 20 30 4050 60 7080 90 Intensity (arb.unit) Pre annealed 2 θ (degree) ♦ ♦ ♦♦♦ ♦♦ ♦ Zn - Sn ♦ 20 30 40 50 6070 80 90 2 θ (degree) Intensity (arb.unit) annealed at 80 °C ♦ ♦ ♦ ♦♦ ♦♦♦ Copyright © 2010 SciRes. ENG  M. Hammam ET AL. 174 20 30 40 50 60 70 80 90 annealed at 120 °C 2 θ (degree) Intensity (arb.unit) ♦ ♦♦ ♦♦ ♦♦ 20 30 40 506070 80 90 annealed at 160 °C Intensity (arb.unit) 2 θ (degree) ♦ ♦ ♦ ♦ ♦♦ ♦ ♦ ♦ Figure 1. XRD patterns of Sn-9Zn alloy samples before and after annealing. heat treatment at 80, 120, and 160°C for 60 min. Each of the alloy samples exhibit the X-ray diffraction peaks due to β-Sn matrix phase with some precipitations of Zn as a secondary phase. The effect of the isochronal heat treat- ment is restricted only on the lattice strain and crystallite size [10] of the Sn-matrix phase as illustrated in Figure 2. The crystallite size of Sn-matrix is continuously increase- ed, while the lattice strain has an opposite behavior with increasing the annealing temperature as shown in Figure 2. Actually, cold rolling process may cause an increase in dislocation density then caused the lattice to be strained. Such an array of dislocations gives rise to a substantial strain energy stored in the lattice, so it becomes unstable thermodynamically relative to the undeformed one. Consequently, the deformed alloy will try to return to a state of lower free energy, i.e. a more perfect state through the continuous heat treatment process where thermally activated processes such as diffusion, cross slip and climb take place. 0 20 40 60 80 100 120 Sample 1Sample 2Sample 3Sample 4 Crystallite size nm 0 0.02 0.04 0.06 0.08 0.1 0.12 0.14 0.16 0.18 0.2 Lattice strain % Crystallite size nm Lattice strain Figure 2. Crystallite size and lattice strain of Sn-9Zn sam- ples before and after annealing. Copyright © 2010 SciRes. ENG  M. Hammam ET AL. 175 3.2. Thermal Properties of Sn-Zn Alloy Samples Figure 3 shows the typical DTA profiles of Sn-9Zn alloy samples before and after annealing at 80, 120 and 160ºC for 60 min during heating with heating rate 10°C/min. A large endothermic peak corresponding to the melting reaction was observed for each sample and seems to have the same physical origin. There is no any phase transition occur other than the melting. The melting point of each sample was determined as illustrated in Table 2. It shows a slight decrease of the melting point in a narrow range of temperatures (199.9 to 198.7°C). Also, the heat of fusion, ΔH, can be determined by H =KA/m, [11] where K, is a constant which is defined as a calibration coefficient that depends on the crucible shape and re- gards as a constant in the DTA system, m is the mass of the sample, and A is the area under the endothermic peak. A slight change of heat of fusion in the range of 82.9 to 87 was observed as illustrated in Table 2, which are lower values compared with that of Pb-Sn (104.2) [12]. This means, the Sn-Zn alloy is considered as the most beneficial material for saving energy. 3.3. Tensile Measurements Figure 4 shows the stress-strain curve of Sn-9Zn alloy samples before and after heat treatment. It shows an in- crease in the strain as the stress is increased by different amounts. The stress-strain curves can be divided into two regions; the first region which is a linear relation be- tween stress and strain ends at the strain ratio ~ 0.1 of the second region. The second region is slightly curved due to the yielding. Also, it is noticed that the annealed sam- ples have higher values than that of the non-annealed sample. It is also seen from Figure 4 that, after the peak tensile stresses at 0.1 strains, the alloy samples have a 050100 150 200250 300 Sample 1 Sample 2 Sample 3 Sample 4 ΔT (arb.unit) Tem p erature ºC 200.6 199.4 199.7 199.8 Figure 3. DTA endothermic peak of Sn-9Zn alloy samples. Table 2. Melting properties of Sn-9Zn samples before and after annealing. Sample Melting point ˚C Onset ˚C Offset ˚C ΔH ( J/g) Sample 1 199.9 193.8 212.7 82.9 Sample 2 198.7 187.5 211 84.2 Sample 3 198.9 188.9 211.2 87 Sample 4 199.1 190.1 211.8 86.6 0 10 20 30 40 50 60 70 80 0 0.1 0.20.3 0.4 0.5 0.6 Pre-annealed Sample annealed at 120 ℃ annealed at 160 ℃ Str ain Stress Mpa Figure 4. Stress-strain curve of the Sn-9Zn alloy samples. Copyright © 2010 SciRes. ENG  M. Hammam ET AL. 176 neck. Also, it indicates the deformation up to failure is distributed much more uniformly throughout the alloy volume. The ultimate tensile strength, UTS, which is the maximum engineering stress that a material can with- stand in tension, was calculated as illustrated in Figure 5. It is equal to 61.4 MPa for sample 1, which slightly de- creases to 60.5 and 58.2 MPa for samples 2 and 3, re- spectively. While, the value increases to its maximum value 65.4 MPa for sample 4. 3.4. Micro Hardness Measurement Micro-hardness measurement is a very sensitive to detect the structural changes of different soft solders. Usually, it is a non-destructive testing and can be the easiest way to determine the mechanical properties of the different phases of the structure. Figure 6 shows the variation of Vickers hardness number of Sn-9Zn alloy samples before and after heat treatment using loads of 0.098, 0.245 and 52 54 56 58 60 62 64 66 68 sample1sample 2sample 3sample 4 Ultimate tensile strength MPa 0 0.1 0.2 0.3 0.4 0.5 0.6 True strain UTS MPa True strain Figure 5. UTS and true strain of Sn-9Zn samples before and after annealing. 140 150 160 170 180 190 200 210 sample 1sample 2sample 3sample 4 Hardness MPa 0.098 N 0.245 N 0.49 N Figure 6. Hardness values of Sn-9Zn samples before and after annealing. Copyright © 2010 SciRes. ENG  M. Hammam ET AL. 177 0.49 N for fixed dwell time of 10 s. The hardness in- creases continuously as the annealing temperature is in- creased for the three load systems by the same manor. This increase can be attributed to the effect of heat treatment that decreases the lattice strain induced through the cold rolling process. The hardening in metals and alloys induced by forming structure in which dislocation mobility is reduced due to the interaction of dislocations with impurity atoms and the formation of second phase particles. Also, reduction of the lattice strain leads to increase the hardness. Another point is noticed from this figure that the values of HV in all samples are decreased with increasing applied load, which well known as in- dentation size effect and agree with the results observed elsewhere [13,14]. 3.5. Micro-Creep Behavior Figure 7 shows the variation of local strain with indenta- tion time through the interval 0 to 300 s. All of the alloy samples have two stages namely as primary and secon- dary creep. The first stage starts from the beginning to 120 s, followed by the second stage up to 300 s. This 0 0.2 0.4 0.6 0.8 1 1.2 1.4 1.6 050100 150 200250 300 350 sample 1 sample 2 sample 3 sam p le 4 25 º C Time sec True strain Figure 7. Micro-creep curve of Sn-9Zn samples before and after annealing. 0 0.1 0.2 0.3 0.4 sample 1sample 2sample 3 sample 4 Creep rate % s -1 Figure 8. Creep rate of Sn-9Zn alloy samples. Copyright © 2010 SciRes. ENG  M. Hammam ET AL. Copyright © 2010 SciRes. ENG 178 stage called the steady state region in which the strain increases linearly with indentation time. The third stage of creep is not noticed here since it is impossible because this method is a compressed method. From the steady state region, the creep rate of the alloy samples can be calculated and the results are illustrated in Figure 8. It shows a continues decrease of creep rate with increasing annealing temperature which indicates that, the annealed samples have higher creep resistance due to the decrease of the lattice strain as illustrated from the X-ray diffrac- tion analysis. 4. Conclusions The present paper aimed to study the effect of annealing temperature i.e. 80, 120 and 160°C for 60 min on struc- ture and mechanical properties of Sn-9Zn alloy prepared by conventional casting technique then subjected to cold-rolling process. The results showed that: 1) The crystallite size of Sn-matrix phase was incre- ased continuously with increasing annealing temperature, while the lattice strain induced through the cold rolling process was decreased. 2) Vickers hardness number of this alloy increased continuously with increasing annealing temperature. Also, the hardness values were decreased with increasing applied load, which agree with other previous works. 3) The micro-creep behavior of this alloy was also de- scribed, which differ than that obtained by tensile meth- ods by the third stage of creep. So, the micro-creep method is not destructive method and useful for small samples of alloys. 4) The creep rate calculated by this method was decre- ased continuously with increasing annealing temperature. 5. References [1] M. Kamal and E. S. Gouda, “Effect of rapid solidification on structure and properties of some lead-free solder al- loy,” Materials and Manufacturing Processes, Vol. 21, pp. 736-740, 2006. [2] E. S. Gouda, E. Ahmed and F. Saad Allah, “Electrical and mechanical properties of Sn-5wt.%Sb alloy with an- nealing temperature,” European Physical Journal: Ap- plied Physics, Vol. 45, pp. 10901-10905, 2009. [3] E. S. Gouda, “Effect of cooling rate on structure and creep behavior of Sn-0.7 Cu-0.5 Zn lead-free solder al- loy,” European Physical Journal: Applied Physics, Vol. 48, pp. 20902-20906, 2009. [4] R. Islam, B. Wu, M. Alam, Y. Chan and W. Jillek, “In- vestigations on microhardness of Sn-Zn based lead-free solder alloys as replacement of Sn-Pb solder,” Alloys and Compounds, Vol. 392, pp. 149-158, 2005. [5] M. Kamal, M. Meikhail, A. Elbediwi and E. S. Gouda, “Study of structural changes and properties of Sn-9Zn lead free solder alloy with addition of different alloying elements,” Radiation Effects and Defects in Solids, Vol. 160, pp. 45-49, 2005. [6] J. Zhao, L. Qi, X. Wang and L. Wang, “Influence of Bi on microstructures evolution and mechanical properties in Sn-Ag-Cu lead-free solder,” Alloys and Compounds, Vol. 375, pp. 196, 2004. [7] M. Kamal and E. S. Gouda, “Enhancement of solder properties of Sn-9Zn lead-free solder alloy,” Crystal Re- search and Technology, Vol. 41, No. 12, pp. 1210-1213, 2006. [8] C. M. Wu, D. Q. Yu, C. M. T. Law and L. Wang, “ The properties of Sn-9Zn lead-free solder alloys doped with trace rare earth elements,” Electronic Materials, Vol. 31, pp. 921-927, 2002. [9] T. El-Ashram and R. Shalaby, “Effect of rapid solidifica- tion and small additions of Zn and Bi on structure and properties of Sn-Cu eutectic alloy,” Electronic Materials, Vol. 34, pp. 212-215, 2005. [10] B. E. Warren, “X-Ray diffraction,” Addison Wesley, Reading, MA, 1969. [11] M. Brown, “Introduction to thermal analysis,” Wiley, New York, pp. 33-35, 1986. [12] W. Wendlandt, “Thermal analysis,” Wiley, New York, pp. 271-274, 1986. [13] O. Uzuna, T. Karaaslan, M. Gogebakan and M. Keskin, “Hardness and microstructural characteristics of rapidly solidified Al-8-16 wt.%Si alloys,” Alloys and Com- pounds, Vol. 376, pp. 149, 2004. [14] M. Kamal, E. S. Gouda and L. Marei, “Effect of Bi addi- tion on hardness and micro creep behavior of Sn-3.5Ag rapidly solidified alloy,” Crystal Research and Technol- ogy, Vol. 44, No. 12, pp. 1308-1812, 2009. |