Paper Menu >>
Journal Menu >>
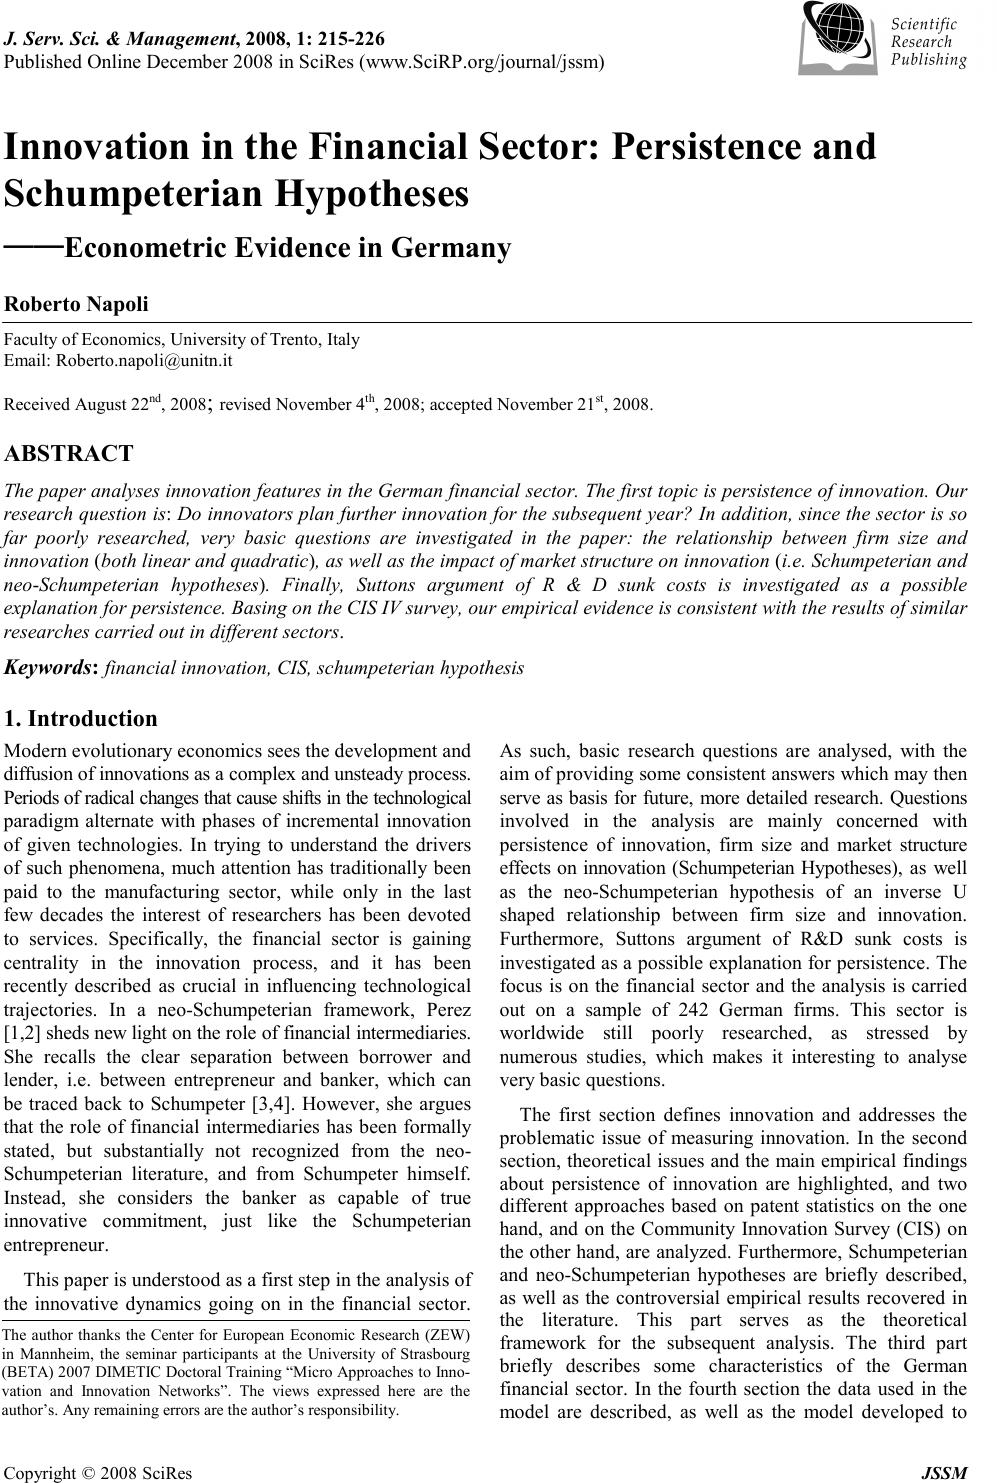 J. Serv. Sci. & Management, 2008, 1: 215-226 Published Online December 2008 in SciRes (www.SciRP.org/journal/jssm) Copyright © 2008 SciRes JSSM 1 Innovation in the Financial Sector: Persistence and Schumpeterian Hypotheses —— ———— ——Econometric Evidence in Germany Roberto Napoli Faculty of Economics, University of Trento, Italy Email: Roberto.napoli@unitn.it Received August 22 nd , 2008 ; revised November 4 th , 2008; accepted November 21 st , 2008. ABSTRACT The paper analyses innovation features in the German financial sector. The first topic is persistence of innovation. Our research question is: Do innovators plan further innovation for the subsequent year? In addition, since the sector is so far poorly researched, very basic questions are investigated in the paper: the relationship between firm size and innovation (both linear and quadratic), as well as the impact of market structure on innovation (i.e. Schumpeterian and neo-Schumpeterian hypotheses). Finally, Suttons argument of R & D sunk costs is investigated as a possible explanation for persistence. Basing on the CIS IV survey, our empirical evidence is consistent with the results of similar researches carried out in different sectors. Keywords: financial innovation, CIS, schumpeterian hypothesis 1. Introduction Modern evolutionary economics sees the development and diffusion of innovations as a complex and unsteady process. Periods of radical changes that cause shifts in the technological paradigm alternate with phases of incremental innovation of given technologies. In trying to understand the drivers of such phenomena, much attention has traditionally been paid to the manufacturing sector, while only in the last few decades the interest of researchers has been devoted to services. Specifically, the financial sector is gaining centrality in the innovation process, and it has been recently described as crucial in influencing technological trajectories. In a neo-Schumpeterian framework, Perez [1,2] sheds new light on the role of financial intermediaries. She recalls the clear separation between borrower and lender, i.e. between entrepreneur and banker, which can be traced back to Schumpeter [3,4]. However, she argues that the role of financial intermediaries has been formally stated, but substantially not recognized from the neo- Schumpeterian literature, and from Schumpeter himself. Instead, she considers the banker as capable of true innovative commitment, just like the Schumpeterian entrepreneur. This paper is understood as a first step in the analysis of the innovative dynamics going on in the financial sector. As such, basic research questions are analysed, with the aim of providing some consistent answers which may then serve as basis for future, more detailed research. Questions involved in the analysis are mainly concerned with persistence of innovation, firm size and market structure effects on innovation (Schumpeterian Hypotheses), as well as the neo-Schumpeterian hypothesis of an inverse U shaped relationship between firm size and innovation. Furthermore, Suttons argument of R&D sunk costs is investigated as a possible explanation for persistence. The focus is on the financial sector and the analysis is carried out on a sample of 242 German firms. This sector is worldwide still poorly researched, as stressed by numerous studies, which makes it interesting to analyse very basic questions. The first section defines innovation and addresses the problematic issue of measuring innovation. In the second section, theoretical issues and the main empirical findings about persistence of innovation are highlighted, and two different approaches based on patent statistics on the one hand, and on the Community Innovation Survey (CIS) on the other hand, are analyzed. Furthermore, Schumpeterian and neo-Schumpeterian hypotheses are briefly described, as well as the controversial empirical results recovered in the literature. This part serves as the theoretical framework for the subsequent analysis. The third part briefly describes some characteristics of the German financial sector. In the fourth section the data used in the model are described, as well as the model developed to The author thanks the Center for European Economic Re search (ZEW) in Mannheim, the seminar participants at the University of Strasbourg (BETA) 2007 DIMETIC Doctoral Training “Micro Approaches to Inno- vation and Innovation Networks”. The views ex pressed here are the author’s. Any remaining errors are the author’s responsibility.  216 Roberto Napoli Copyright © 2008 SciRes JSSM investigate persistence and the different hypotheses highlighted in earlier paragraphs; subsequently, the results of the model are presented. The final part discusses the findings and concludes with some suggestion for possible extensions of the model. 2. Defining and Measuring Innovation In the present work, a firm having introduced a new or improved product or service or a new or improved process during the period covered by the survey, is considered an innovator. This means that we consider as an innovator a firm which reported innovative activities in the last three years, in terms of new products/services/processes introduced into the market. However it may be problematic to identify these innovations. In fact, the intangible nature of services, as well as the close interaction between production and consumption, makes the distinction between product and process innovation unclear. In addition, there is no clear cut between what should be considered true innovation and, on the other hand, what should be viewed as mere product differentiation. Unfortunately, incremental innovation, which is typical for the service sector and is highly interesting when analysing innovation, is difficult to distinguish from mere product customization, which in turn has to be excluded from the analysis. The more, radical innovation in the Schumpeterian sense occurs very rarely and is often little more than a theoretical eventuality. This makes it quite difficult to identify financial innovations in terms of single events. For the purposes of the present work, three definitions are relevant 1 : - If the innovation involves new or significantly improved characteristics of the service offered to customers, it is a product innovation. - If the innovation involves new or significantly improved methods, equipment and/or skills used to perform the service, it is a process innovation. - If the innovation involves significant improvements in both the characteristics of the service offered and in the methods, equipment and/or skills used to perform the service, it is both a product and a process innovation. These definitions are reported in the Community Innovation Survey (CIS) questionnaire. Since CIS data are used in the present paper to test the empirical model, we adopt the same definitions of innovation. This seems reasonable, given that respondents to the CIS survey are asked to self-identify as an innovator or as a non innovator basing on the same definition. Measurement of innovation is a strongly debated issue in the economic literature. There are many different instruments to measure innovation. Input indicators like R&D expenditures belong to the first generation of 1 See Oslo Manual (OECD 2005), p. 53 innovation indicators. They relay on the assumption of linear relationship between inputs and outputs of innovation, which has been rejected from the literature especially since evolutionarists like e.g. Nelson, Winter, Dosi began to influence heavily the scientific community in the early eighties. Patent statistics are one of the most traditional indicator for firm innovativeness: as an output indicator, they may work properly for manufacturing sectors (however with strong and well known limitations, see e.g. Malerba et al. [5] but fail completely in capturing innovation in most services, where patents are not an effective instrument to prevent imitation. Interestingly, Lerner [6] analyzes the dramatic increase in financial patents, observed in the US financial market between 1996 and 2001, and explains it as a consequence of changes in the federal law. However, financial formulas cannot be patented in most countries outside the US, especially in Europe. Furthermore, financial formulas are often developed in Universities. All this factors make patents an unfit tool to measure innovation in the financial sector. A further group of measuring instruments, composed by those indicators capturing both inputs and outputs of innovation, as well as the process inbetween, overcome the drawbacks of “pure input” and “pure output” indicators, in that they recognize the complexity of the innovative phenomenon, at the cost of being often quite complicated themselves. Finally, a recently established instrument is the Community Innovation Survey (CIS), which has been introduced in Europe in the early nineties. Outcomes of the CIS approach are also highly disputed, due to the fact that self-definition of managers as an innovator is often considered too “soft” a tool to measure innovation 2 . 3. Previous Findings 3.1. Persistence of Innovation Schumpeter distinguished between two market situations, known as Schumpeter Mark I and Mark II. The idea of persistence can be found in Schumpeter Mark II, also called “deepening pattern of innovation” in Malerba and Orsenigo [7], as opposed to the “widening pattern” (Mark I). In Schumpeter Mark II a few well established firms with large R&D divisions accumulate knowledge and innovative capabilities, which results in continuous innovation. Similarly, Winter [8] defined two technological regimes: the entrepreneurial regime, characterized by small firms, low entry barriers and high mortality; and the routinized regime, where bigger firms establish solid R&D departments with structured innovative activity. Much of the literature investigating innovation persistence aims at identifying the one or the other innovative pattern in the analyzed sector. 2 See Tether [9] for an extensive analysis of advantages and drawbacks of CIS analysis 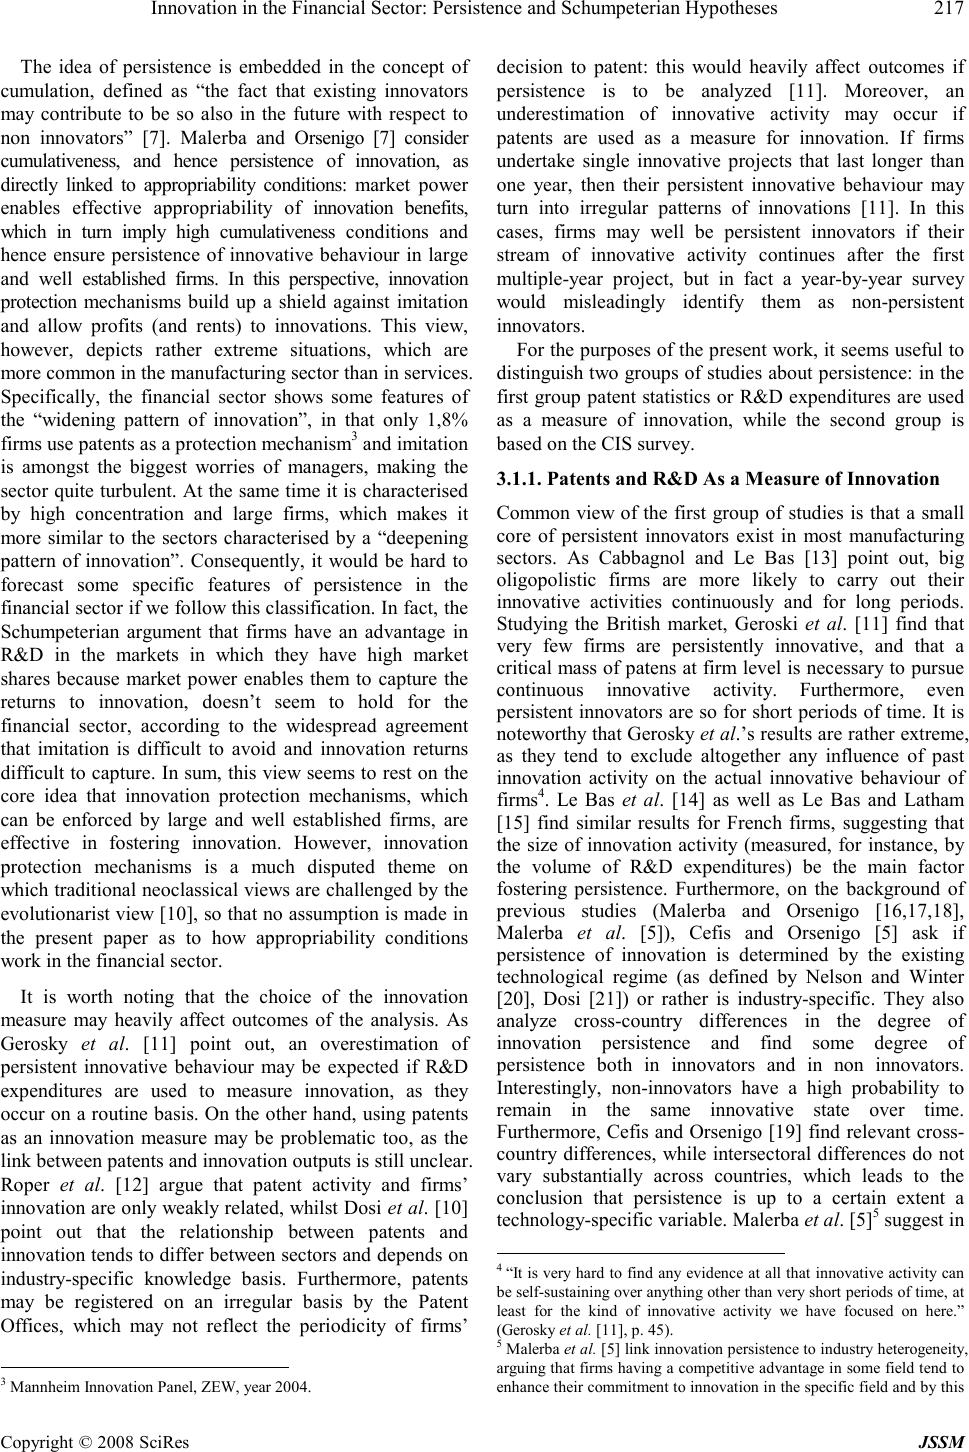 Innovation in the Financial Sector: Persistence and Schumpeterian Hypotheses 217 Copyright © 2008 SciRes JSSM The idea of persistence is embedded in the concept of cumulation, defined as “the fact that existing innovators may contribute to be so also in the future with respect to non innovators” [7]. Malerba and Orsenigo [7] consider cumulativeness, and hence persistence of innovation, as directly linked to appropriability conditions: market power enables effective appropriability of innovation benefits, which in turn imply high cumulativeness conditions and hence ensure persistence of innovative behaviour in large and well established firms. In this perspective, innovation protection mechanisms build up a shield against imitation and allow profits (and rents) to innovations. This view, however, depicts rather extreme situations, which are more common in the manufacturing sector than in services. Specifically, the financial sector shows some features of the “widening pattern of innovation”, in that only 1,8% firms use patents as a protection mechanism 3 and imitation is amongst the biggest worries of managers, making the sector quite turbulent. At the same time it is characterised by high concentration and large firms, which makes it more similar to the sectors characterised by a “deepening pattern of innovation”. Consequently, it would be hard to forecast some specific features of persistence in the financial sector if we follow this classification. In fact, the Schumpeterian argument that firms have an advantage in R&D in the markets in which they have high market shares because market power enables them to capture the returns to innovation, doesn’t seem to hold for the financial sector, according to the widespread agreement that imitation is difficult to avoid and innovation returns difficult to capture. In sum, this view seems to rest on the core idea that innovation protection mechanisms, which can be enforced by large and well established firms, are effective in fostering innovation. However, innovation protection mechanisms is a much disputed theme on which traditional neoclassical views are challenged by the evolutionarist view [10], so that no assumption is made in the present paper as to how appropriability conditions work in the financial sector. It is worth noting that the choice of the innovation measure may heavily affect outcomes of the analysis. As Gerosky et al. [11] point out, an overestimation of persistent innovative behaviour may be expected if R&D expenditures are used to measure innovation, as they occur on a routine basis. On the other hand, using patents as an innovation measure may be problematic too, as the link between patents and innovation outputs is still unclear. Roper et al. [12] argue that patent activity and firms’ innovation are only weakly related, whilst Dosi et al. [10] point out that the relationship between patents and innovation tends to differ between sectors and depends on industry-specific knowledge basis. Furthermore, patents may be registered on an irregular basis by the Patent Offices, which may not reflect the periodicity of firms’ 3 Mannheim Innovation Panel, ZEW, year 2004. decision to patent: this would heavily affect outcomes if persistence is to be analyzed [11]. Moreover, an underestimation of innovative activity may occur if patents are used as a measure for innovation. If firms undertake single innovative projects that last longer than one year, then their persistent innovative behaviour may turn into irregular patterns of innovations [11]. In this cases, firms may well be persistent innovators if their stream of innovative activity continues after the first multiple-year project, but in fact a year-by-year survey would misleadingly identify them as non-persistent innovators. For the purposes of the present work, it seems useful to distinguish two groups of studies about persistence: in the first group patent statistics or R&D expenditures are used as a measure of innovation, while the second group is based on the CIS survey. 3.1.1. Patents and R&D As a Measure of Innovation Common view of the first group of studies is that a small core of persistent innovators exist in most manufacturing sectors. As Cabbagnol and Le Bas [13] point out, big oligopolistic firms are more likely to carry out their innovative activities continuously and for long periods. Studying the British market, Geroski et al. [11] find that very few firms are persistently innovative, and that a critical mass of patens at firm level is necessary to pursue continuous innovative activity. Furthermore, even persistent innovators are so for short periods of time. It is noteworthy that Gerosky et al.’s results are rather extreme, as they tend to exclude altogether any influence of past innovation activity on the actual innovative behaviour of firms 4 . Le Bas et al. [14] as well as Le Bas and Latham [15] find similar results for French firms, suggesting that the size of innovation activity (measured, for instance, by the volume of R&D expenditures) be the main factor fostering persistence. Furthermore, on the background of previous studies (Malerba and Orsenigo [16,17,18], Malerba et al. [5]), Cefis and Orsenigo [5] ask if persistence of innovation is determined by the existing technological regime (as defined by Nelson and Winter [20], Dosi [21]) or rather is industry-specific. They also analyze cross-country differences in the degree of innovation persistence and find some degree of persistence both in innovators and in non innovators. Interestingly, non-innovators have a high probability to remain in the same innovative state over time. Furthermore, Cefis and Orsenigo [19] find relevant cross- country differences, while intersectoral differences do not vary substantially across countries, which leads to the conclusion that persistence is up to a certain extent a technology-specific variable. Malerba et al. [5] 5 suggest in 4 “It is very hard to find any evidence at all that innovative activity can be self-sustaining over anything other than very short periods of time, at least for the kind of innovative activity we have focused on here.” (Gerosky et al. [11], p. 45). 5 Malerba et al. [5] link innovation persistence to industry heterogeneity, arguing that firms having a competitive advantage in some field tend to enhance their commitment to innovation in the specific field and by this 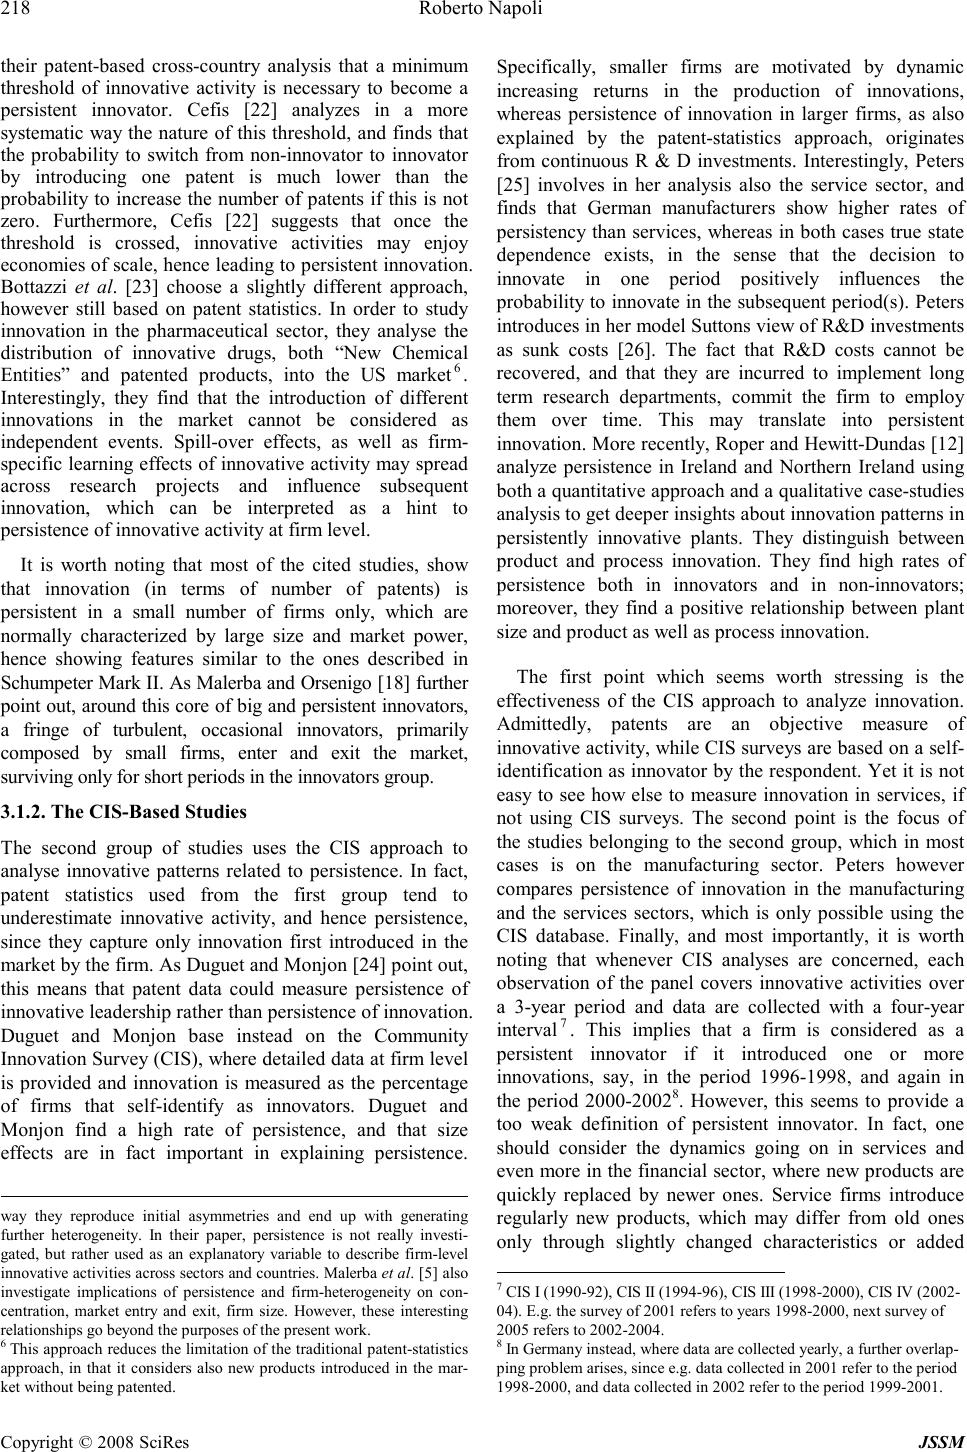 218 Roberto Napoli Copyright © 2008 SciRes JSSM their patent-based cross-country analysis that a minimum threshold of innovative activity is necessary to become a persistent innovator. Cefis [22] analyzes in a more systematic way the nature of this threshold, and finds that the probability to switch from non-innovator to innovator by introducing one patent is much lower than the probability to increase the number of patents if this is not zero. Furthermore, Cefis [22] suggests that once the threshold is crossed, innovative activities may enjoy economies of scale, hence leading to persistent innovation. Bottazzi et al. [23] choose a slightly different approach, however still based on patent statistics. In order to study innovation in the pharmaceutical sector, they analyse the distribution of innovative drugs, both “New Chemical Entities” and patented products, into the US market 6 . Interestingly, they find that the introduction of different innovations in the market cannot be considered as independent events. Spill-over effects, as well as firm- specific learning effects of innovative activity may spread across research projects and influence subsequent innovation, which can be interpreted as a hint to persistence of innovative activity at firm level. It is worth noting that most of the cited studies, show that innovation (in terms of number of patents) is persistent in a small number of firms only, which are normally characterized by large size and market power, hence showing features similar to the ones described in Schumpeter Mark II. As Malerba and Orsenigo [18] further point out, around this core of big and persistent innovators, a fringe of turbulent, occasional innovators, primarily composed by small firms, enter and exit the market, surviving only for short periods in the innovators group. 3.1.2. The CIS-Based Studies The second group of studies uses the CIS approach to analyse innovative patterns related to persistence. In fact, patent statistics used from the first group tend to underestimate innovative activity, and hence persistence, since they capture only innovation first introduced in the market by the firm. As Duguet and Monjon [24] point out, this means that patent data could measure persistence of innovative leadership rather than persistence of innovation. Duguet and Monjon base instead on the Community Innovation Survey (CIS), where detailed data at firm level is provided and innovation is measured as the percentage of firms that self-identify as innovators. Duguet and Monjon find a high rate of persistence, and that size effects are in fact important in explaining persistence. way they reproduce initial asymmetries and end up with generating further heterogeneity. In their paper, persistence is not really investi- gated, but rather used as an explanatory variable to describe firm-level innovative activities across sectors and countries. Malerba et al. [5] also investigate implications of persistence and firm-heterogeneity on con- centration, market entry and exit, firm size. However, these interesting relationships go beyond the purposes of the present work. 6 This approach reduces the limitation of the traditional patent-statistics approach, in that it considers also new products introduced in the mar- ket without being patented. Specifically, smaller firms are motivated by dynamic increasing returns in the production of innovations, whereas persistence of innovation in larger firms, as also explained by the patent-statistics approach, originates from continuous R & D investments. Interestingly, Peters [25] involves in her analysis also the service sector, and finds that German manufacturers show higher rates of persistency than services, whereas in both cases true state dependence exists, in the sense that the decision to innovate in one period positively influences the probability to innovate in the subsequent period(s). Peters introduces in her model Suttons view of R&D investments as sunk costs [26]. The fact that R&D costs cannot be recovered, and that they are incurred to implement long term research departments, commit the firm to employ them over time. This may translate into persistent innovation. More recently, Roper and Hewitt-Dundas [12] analyze persistence in Ireland and Northern Ireland using both a quantitative approach and a qualitative case-studies analysis to get deeper insights about innovation patterns in persistently innovative plants. They distinguish between product and process innovation. They find high rates of persistence both in innovators and in non-innovators; moreover, they find a positive relationship between plant size and product as well as process innovation. The first point which seems worth stressing is the effectiveness of the CIS approach to analyze innovation. Admittedly, patents are an objective measure of innovative activity, while CIS surveys are based on a self- identification as innovator by the respondent. Yet it is not easy to see how else to measure innovation in services, if not using CIS surveys. The second point is the focus of the studies belonging to the second group, which in most cases is on the manufacturing sector. Peters however compares persistence of innovation in the manufacturing and the services sectors, which is only possible using the CIS database. Finally, and most importantly, it is worth noting that whenever CIS analyses are concerned, each observation of the panel covers innovative activities over a 3-year period and data are collected with a four-year interval 7 . This implies that a firm is considered as a persistent innovator if it introduced one or more innovations, say, in the period 1996-1998, and again in the period 2000-2002 8 . However, this seems to provide a too weak definition of persistent innovator. In fact, one should consider the dynamics going on in services and even more in the financial sector, where new products are quickly replaced by newer ones. Service firms introduce regularly new products, which may differ from old ones only through slightly changed characteristics or added 7 CIS I (1990-92), CIS II (1994-96), CIS III (1998-2000), CIS IV (2002- 04). E.g. the survey of 2001 refers to years 1998-2000, next survey of 2005 refers to 2002-2004. 8 In Germany instead, where data are collected yearly, a further overlap- ping problem arises, since e.g. data collected in 2001 refer to the period 1998-2000, and data collected in 2002 refer to the period 1999-2001.  Innovation in the Financial Sector: Persistence and Schumpeterian Hypotheses 219 Copyright © 2008 SciRes JSSM services. In this sense, they appear to be persistent innovators over short periods of time. Interestingly, prevailing in the timing of the launch of new products into the market is the most important strategy of German financial firms to overperform competitors (Napoli [27]) 9 . This suggests that financial innovations “expire” very quickly, and firms react by replacing them quickly with new innovations. As a consequence, the analysis based on subsequent waves of three-year periods, may lead to an artificial overestimation of persistence. Instead, the period under analysis should be kept as short as possible to correctly identify persistent innovators. One way to overcome this problem is proposed by Peters [25], who uses input measures (innovation expenditures), which are available on a yearly basis, rather than output measures. However, this point is problematic too, as it assumes that innovation inputs transform linearly into innovation outputs, thereby denying much of the evolutionary literature dealing with learning effects, human capital contribution, complexity of the whole innovative process etc. In the present work a further solution is proposed. The idea is to keep the time lag as short as possible 10 , so as to capture firms that innovate in the three-year period and plan to innovate immediately thereafter, i.e. in the subsequent year. These firms would be then defined as persistent innovators. Admittedly, this may not suffice to assess persistence in longer periods. However it allows a stronger assessment of persistence of innovation in the short run, which seems interesting given the short life-cycle of innovations in the financial sector. In contrast, a different approach which would identify as a persistent innovator a firm which introduced innovations in the period, say, 1998-2000 and then again in 2002- 2004, seems less adequate given the mentioned characteristics of the financial sector, where products are quickly replaced and easily imitated (see e.g. Tufano [28], Roper and Hewitt-Dundas [12]). There are some counterarguments to the existence of persistence, like e.g. standardization. Once a new technology has been successfully introduced and sufficiently imposed as a standard in the market, some conservative-rather than innovative-forces can be at work in the firm, and make continuous innovation or persistency less likely. In this direction work path dependence, learning processes and network externalities, thus reinforcing standardization 11 and perhaps discouraging further innovation from the innovator itself, which may now be more concerned with establishing a market for its new product rather than developing new ideas. 9 “Timing advantage” (‘Zeitlicher Vorsprung’) is seen as the most effec- tive way to protect IPR in the German financial sector (MIP, 2005 sur- vey). 10 Needless to say, this contrasts with the necessity to measure persis- tence over a longer period. 11 See e.g. Teece [29]. Furthermore, firms could cannibalise rents of their own innovations by introducing new products, hence having a negative incentive towards persistent innovation (“replacement effect”, see Le Bas, Latham 2004). However, the opposite may hold as well: new products introduced in period t may complete or improve the performance of products introduced in period t (Gilbert and Newberry [30]). 3.2. Schumpeterian and Neo-Schumpeterian Hypotheses There is a broad literature dealing with the so called Schumpeterian hypotheses 12 , i.e. with the relationship between market structure and innovation on the one hand, and firm size and innovation on the other hand. There is no doubt that the search for consistent findings in this area failed in coming up with general results (see e.g. Symeonidis [31], Teece [29]). Still, some firm-size or market structure effects on innovation may be relevant in subsectors, and failing in capturing them may lead to incomplete explanations. Gellatly and Peters [32] for example, analysing three service subsectors, find higher innovation rates in more concentrated segments (financial services) than in less concentrated ones (communication and technical business services). Our data suggest that a size effect exists in the German financial sector. The 242 analyzed firms have been divided into 10 subgroups, each with approximately 24 firms. The first group (1-53 employees) shows innovation rates which are lower than the average; the second group of firms (54-600 employees) moves around the mean, while the last group of large firms show the highest innovation rate. This figures suggest some positive relationship between size and innovation rate, which will hence be tested in the model. Figure 1. Source: Mannheim innovation panel 12 Kamien and Schwartz [33] summarize the neo-Schumpeterian hy- potheses and the inconclusive empirical work on these arguments. See also Cohen [34] and Cohen and Levin [35] and, more recently, Vaona and Pianta [36] for a literature review on the relationship between size and innovation. Innovating financial intermediaries by size class, Germany (number of employees, 2004) 63% 65% 44% 67% 81% 73% 75% 71% 87% 96% 72% 0% 20% 40% 60% 80% 100% 1-45-89-2627-53 54- 105 105- 219 220- 305 306- 600 601- 1500 1501> Innovationg financial intermediaries by size class, Germany (number of employees, 2004) 100% 80% 60% 40% 20% 0% 1- 4 5- 8 9- 26 27- 53 54- 105 105- 219 220- 305 306- 600 601- 1500 1501>  220 Roberto Napoli Copyright © 2008 SciRes JSSM The idea of the firm size being related to the innovative activity can be further expanded. It may well be that a positive relationship, which we expect to find between size and innovation, is quadratic rather than linear. It seems reasonable that the positive effect on innovation of one additional employee expires at a certain firm size level. This may be due to inefficiencies or to organizational problems, which may arise when the firm size grows. This is the so called “Neo-Schumpeterian hypothesis”, which is understood as an extension of the Schumpeterian hypothesis. In order to test it, the relationship between the squared size and innovation activity is analyzed. There are a few examples in the literature, where higher degree relationships have been found between firm size and R&D. Acs and Audretsch [37] and Siddharthan [38] report a quadratic U- shaped relationship, while further studies found also evidence of a cubic relationship between firm size and R&D activities (see Kumar and Aggarwal [39] for more details). The idea of a cubic relationship however, seems too extreme, and some doubts may arise as to how to interpret results. The quadratic relationship instead, seems interesting in terms of management issues: an inverse-U relationship, as argued by neo-Schumpeterians, would mean that expanding the firm size may ensure advantages in terms of innovative activity only up to a certain level, and may turn into an hampering factor if the firm becomes too large. To test this hypothesis in the model discussed later the square of firms size (number of employees) will be used as a regressor. It seems appropriate to keep in the model both measures of the firm size 13 , so as to investigate both the linear and the quadratic relationship of size with the probability to innovate. In fact, the outcome (which we expect) of a positive linear relationship between size and innovation would fall short of a complete explanation about the extent of this relationship (does size effects indefinitely foster innovation or do they expire once a certain level is reached?). In this case, introducing the second degree variable could add useful insights on that. In turn, the squared relationship alone would explain the relationship in a poor way, as the linear relationship cannot be inferred from the quadratic one 14 . As far as known, no studies have yet analysed persistence of innovative activities in financial firms, while only a few studies have recently tested Schumpeterian hypotheses in the financial sector [40,41]. None of them, however, concentrated on the neo-Schumpeterian hypothesis. More in general, the lack of empirical literature on the determinants of financial innovation has been repeatedly 13 I.e. the logarithm of employees and the squared logarithm of employ- ees. 14 As an example, if we find a negative quadratic relationship, but don’t know anything about the linear relationship, we are not able to under- stand if size has a positive or negative effect on innovation, as the nega- tive quadratic relationship contains both effects and does not allow, on its own, to understand which one prevails. stressed (see e.g. Frame and White [42], Heffernan et al. [40]). This makes the topic even more interesting, since the sector is gaining growing attention. The contribution of the present study to the literature is twofold. First, it is one of the few empirical studies of financial innovation. Second, it identifies some possible factors underlying financial innovation. The present study is based on CIS data to study persistence mainly for two reasons. The first concerns with the well recognized and already mentioned limitations of the patent statistics, like e.g. underestimation of innovative activity, which can be even more effective in services than in the manufacturing sector. But there is an even stronger argument that makes it impossible to use patent data. In fact, patents are not a widespread mechanism to protect innovations in the financial sector, since less than 2% of German bankers and insurers use them to protect innovation 15 . The neglect of patents as an effective protection mechanism is likely to hold also in neighbour States due to common laws at European level, which e.g. exclude patentability of financial formulas 16 . Furthermore, as Tufano [43] points out, the easily imitated nature of financial innovation does not lend itself to models based on patent statistics. 4. The German Financial Sector As shown in following figure, the incidence of big firms in the German financial sector is much higher than the incidence of big firms in German services. In fact, 677 out of 2.742 financial intermediaries (or 25%) have more than 250 employees, while the percentage falls to 5% if the whole service sector is considered. Concentration measures in the German financial sector are calculated basing on revenues stated by firms and reported in the 2005 MIP survey. The CR4 Concentration Ratio (40% for the financial sector) and the CR8 (60%) Distribution of German firms by size 41% 80% 35% 16% 25% 5% 0% 20% 40% 60% 80% 100% Financial sectorServices More than 250 50-250 Less than 50 Figure 2. Source: Mannheim innovation panel, 2004 15 Mannheim Innovation Panel, ZEW, year 2004. 16 Lerner [6] shows a dramatic increase in the number of U.S. financial patent awards due to patentability of financial formulas newly intro- duced in the U. S. law. However, similar patterns are not likely to show up in Europe. 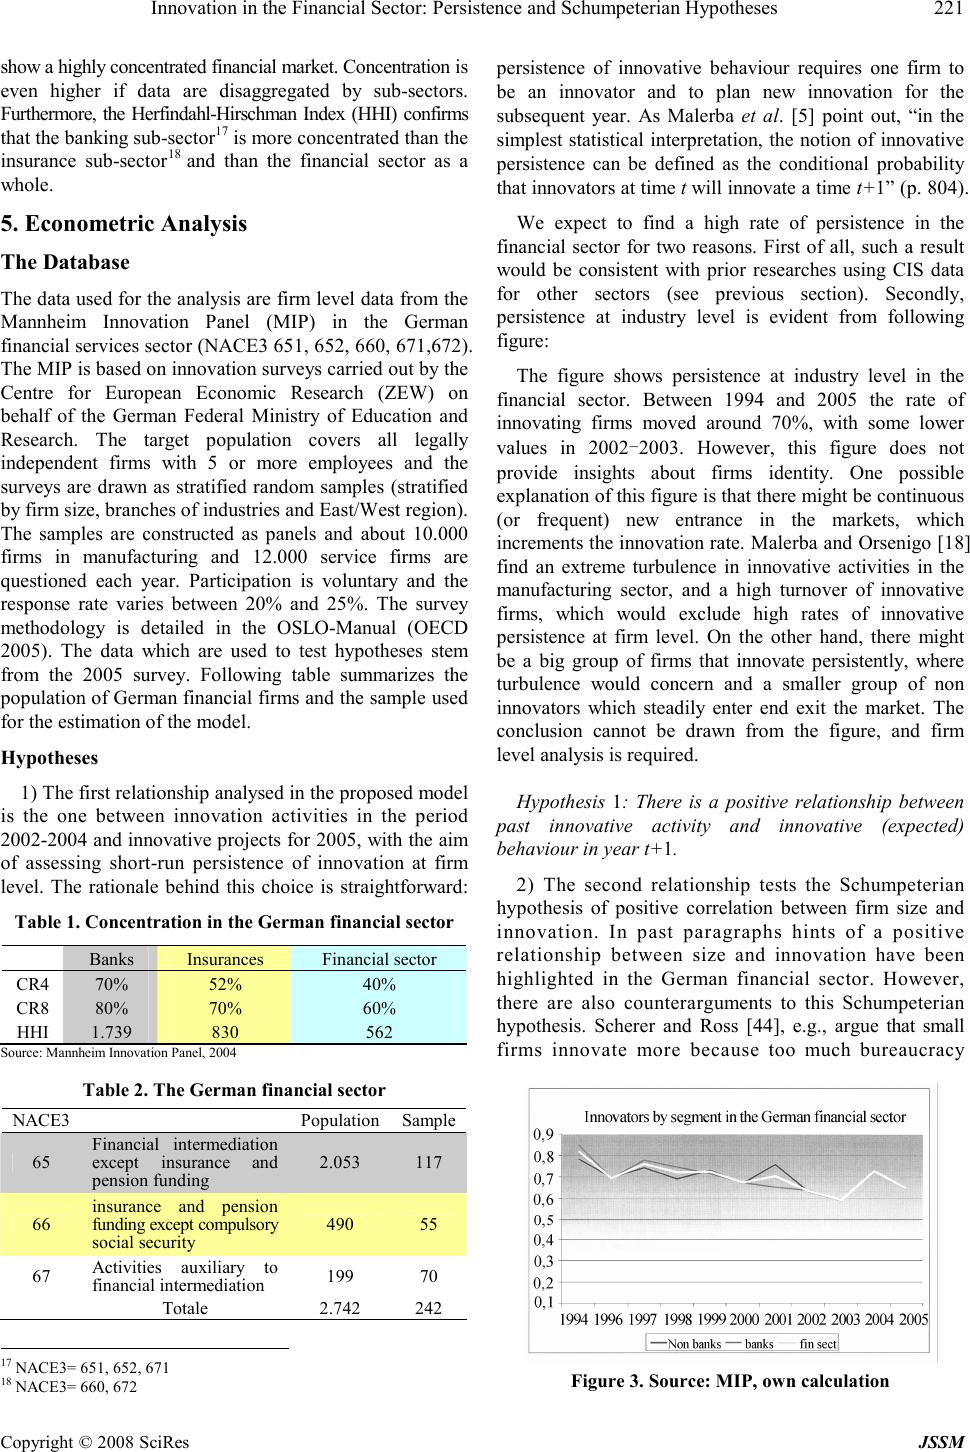 Innovation in the Financial Sector: Persistence and Schumpeterian Hypotheses 221 Copyright © 2008 SciRes JSSM show a highly concentrated financial market. Concentration is even higher if data are disaggregated by sub-sectors. Furthermore, the Herfindahl-Hirschman Index (HHI) confirms that the banking sub-sector 17 is more concentrated than the insurance sub-sector 18 and than the financial sector as a whole. 5. Econometric Analysis The Database The data used for the analysis are firm level data from the Mannheim Innovation Panel (MIP) in the German financial services sector (NACE3 651, 652, 660, 671,672). The MIP is based on innovation surveys carried out by the Centre for European Economic Research (ZEW) on behalf of the German Federal Ministry of Education and Research. The target population covers all legally independent firms with 5 or more employees and the surveys are drawn as stratified random samples (stratified by firm size, branches of industries and East/West region). The samples are constructed as panels and about 10.000 firms in manufacturing and 12.000 service firms are questioned each year. Participation is voluntary and the response rate varies between 20% and 25%. The survey methodology is detailed in the OSLO-Manual (OECD 2005). The data which are used to test hypotheses stem from the 2005 survey. Following table summarizes the population of German financial firms and the sample used for the estimation of the model. Hypotheses 1) The first relationship analysed in the proposed model is the one between innovation activities in the period 2002-2004 and innovative projects for 2005, with the aim of assessing short-run persistence of innovation at firm level. The rationale behind this choice is straightforward: Table 1. Concentration in the German financial sector Banks Insurances Financial sector CR4 70% 52% 40% CR8 80% 70% 60% HHI 1.739 830 562 Source: Mannheim Innovation Panel, 2004 Table 2. The German financial sector NACE3 Population Sample 65 Financial intermediation except insurance and pension funding 2.053 117 66 insurance and pension funding except compulsory social security 490 55 67 Activities auxiliary to financial intermediation 199 70 Totale 2.742 242 17 NACE3= 651, 652, 671 18 NACE3= 660, 672 persistence of innovative behaviour requires one firm to be an innovator and to plan new innovation for the subsequent year. As Malerba et al. [5] point out, “in the simplest statistical interpretation, the notion of innovative persistence can be defined as the conditional probability that innovators at time t will innovate a time t+1” (p. 804). We expect to find a high rate of persistence in the financial sector for two reasons. First of all, such a result would be consistent with prior researches using CIS data for other sectors (see previous section). Secondly, persistence at industry level is evident from following figure: The figure shows persistence at industry level in the financial sector. Between 1994 and 2005 the rate of innovating firms moved around 70%, with some lower values in 2002-2003. However, this figure does not provide insights about firms identity. One possible explanation of this figure is that there might be continuous (or frequent) new entrance in the markets, which increments the innovation rate. Malerba and Orsenigo [18] find an extreme turbulence in innovative activities in the manufacturing sector, and a high turnover of innovative firms, which would exclude high rates of innovative persistence at firm level. On the other hand, there might be a big group of firms that innovate persistently, where turbulence would concern and a smaller group of non innovators which steadily enter end exit the market. The conclusion cannot be drawn from the figure, and firm level analysis is required. Hypothesis 1: There is a positive relationship between past innovative activity and innovative (expected) behaviour in year t+1. 2) The second relationship tests the Schumpeterian hypothesis of positive correlation between firm size and innovation. In past paragraphs hints of a positive relationship between size and innovation have been highlighted in the German financial sector. However, there are also counterarguments to this Schumpeterian hypothesis. Scherer and Ross [44], e.g., argue that small firms innovate more because too much bureaucracy Figure 3. Source: MIP, own calculation 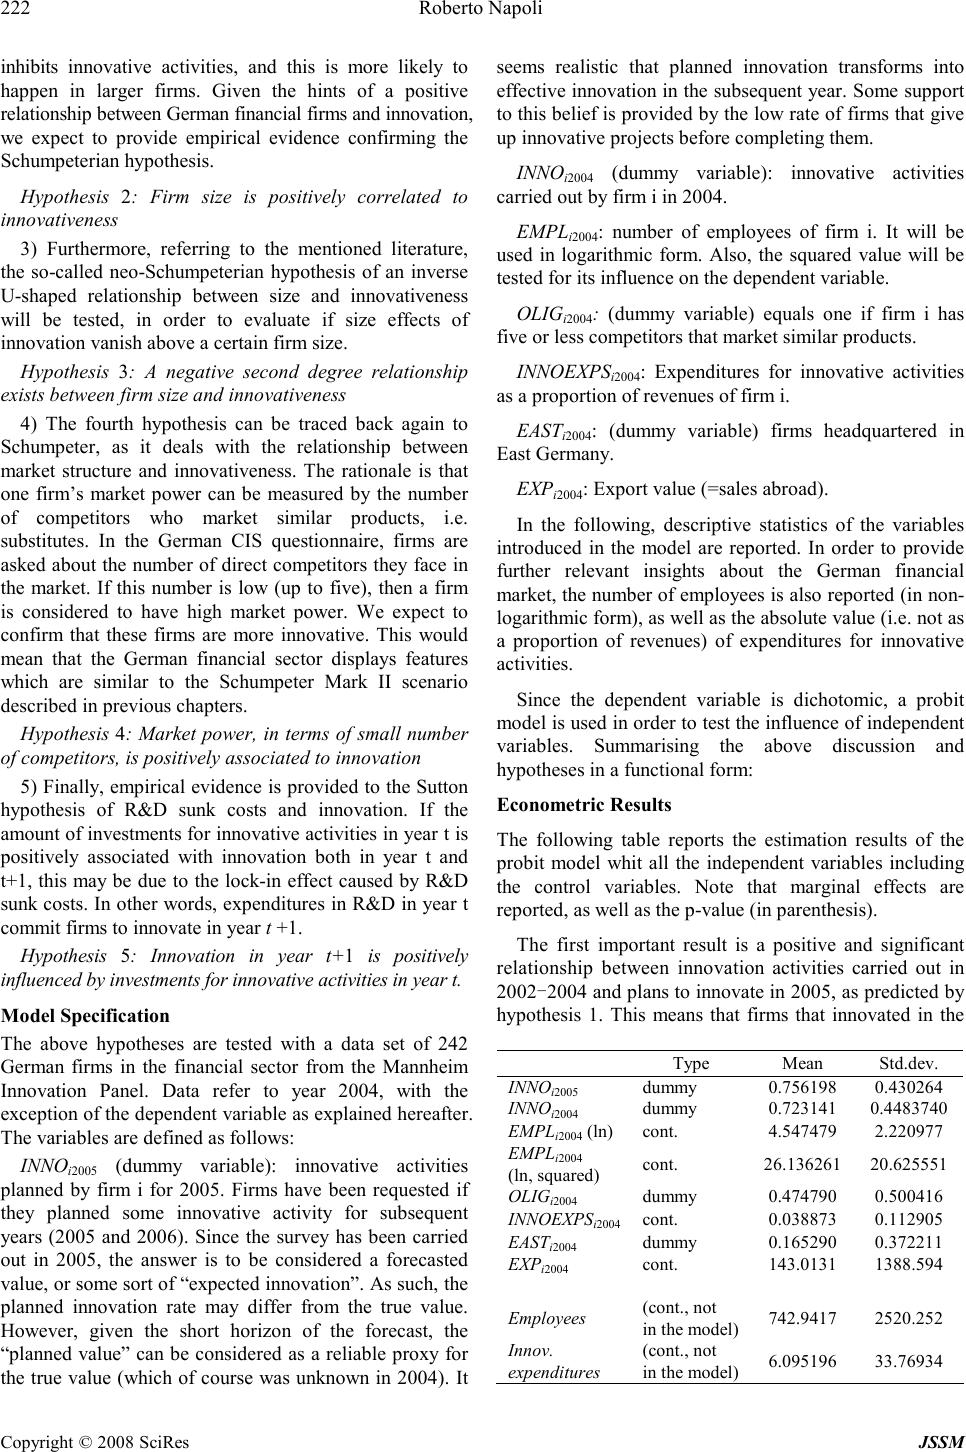 222 Roberto Napoli Copyright © 2008 SciRes JSSM inhibits innovative activities, and this is more likely to happen in larger firms. Given the hints of a positive relationship between German financial firms and innovation, we expect to provide empirical evidence confirming the Schumpeterian hypothesis. Hypothesis 2: Firm size is positively correlated to innovativeness 3) Furthermore, referring to the mentioned literature, the so-called neo-Schumpeterian hypothesis of an inverse U-shaped relationship between size and innovativeness will be tested, in order to evaluate if size effects of innovation vanish above a certain firm size. Hypothesis 3: A negative second degree relationship exists between firm size and innovativeness 4) The fourth hypothesis can be traced back again to Schumpeter, as it deals with the relationship between market structure and innovativeness. The rationale is that one firm’s market power can be measured by the number of competitors who market similar products, i.e. substitutes. In the German CIS questionnaire, firms are asked about the number of direct competitors they face in the market. If this number is low (up to five), then a firm is considered to have high market power. We expect to confirm that these firms are more innovative. This would mean that the German financial sector displays features which are similar to the Schumpeter Mark II scenario described in previous chapters. Hypothesis 4: Market power, in terms of small number of competitors, is positively associated to innovation 5) Finally, empirical evidence is provided to the Sutton hypothesis of R&D sunk costs and innovation. If the amount of investments for innovative activities in year t is positively associated with innovation both in year t and t+1, this may be due to the lock-in effect caused by R&D sunk costs. In other words, expenditures in R&D in year t commit firms to innovate in year t +1. Hypothesis 5: Innovation in year t+1 is positively influenced by investments for innovative activities in year t. Model Specification The above hypotheses are tested with a data set of 242 German firms in the financial sector from the Mannheim Innovation Panel. Data refer to year 2004, with the exception of the dependent variable as explained hereafter. The variables are defined as follows: INNO i2005 (dummy variable): innovative activities planned by firm i for 2005. Firms have been requested if they planned some innovative activity for subsequent years (2005 and 2006). Since the survey has been carried out in 2005, the answer is to be considered a forecasted value, or some sort of “expected innovation”. As such, the planned innovation rate may differ from the true value. However, given the short horizon of the forecast, the “planned value” can be considered as a reliable proxy for the true value (which of course was unknown in 2004). It seems realistic that planned innovation transforms into effective innovation in the subsequent year. Some support to this belief is provided by the low rate of firms that give up innovative projects before completing them. INNO i2004 (dummy variable): innovative activities carried out by firm i in 2004. EMPL i2004 : number of employees of firm i. It will be used in logarithmic form. Also, the squared value will be tested for its influence on the dependent variable. OLIG i2004 : (dummy variable) equals one if firm i has five or less competitors that market similar products. INNOEXPS i2004 : Expenditures for innovative activities as a proportion of revenues of firm i. EAST i2004 : (dummy variable) firms headquartered in East Germany. EXP i2004 : Export value (=sales abroad). In the following, descriptive statistics of the variables introduced in the model are reported. In order to provide further relevant insights about the German financial market, the number of employees is also reported (in non- logarithmic form), as well as the absolute value (i.e. not as a proportion of revenues) of expenditures for innovative activities. Since the dependent variable is dichotomic, a probit model is used in order to test the influence of independent variables. Summarising the above discussion and hypotheses in a functional form: Econometric Results The following table reports the estimation results of the probit model whit all the independent variables including the control variables. Note that marginal effects are reported, as well as the p-value (in parenthesis). The first important result is a positive and significant relationship between innovation activities carried out in 2002-2004 and plans to innovate in 2005, as predicted by hypothesis 1. This means that firms that innovated in the Type Mean Std.dev. INNO i2005 dummy 0.756198 0.430264 INNO i2004 dummy 0.723141 0.4483740 EMPL i2004 (ln) cont. 4.547479 2.220977 EMPL i2004 (ln, squared) cont. 26.136261 20.625551 OLIG i2004 dummy 0.474790 0.500416 INNOEXPS i2004 cont. 0.038873 0.112905 EAST i2004 dummy 0.165290 0.372211 EXP i2004 cont. 143.0131 1388.594 Employees (cont., not in the model) 742.9417 2520.252 Innov. expenditures (cont., not in the model) 6.095196 33.76934 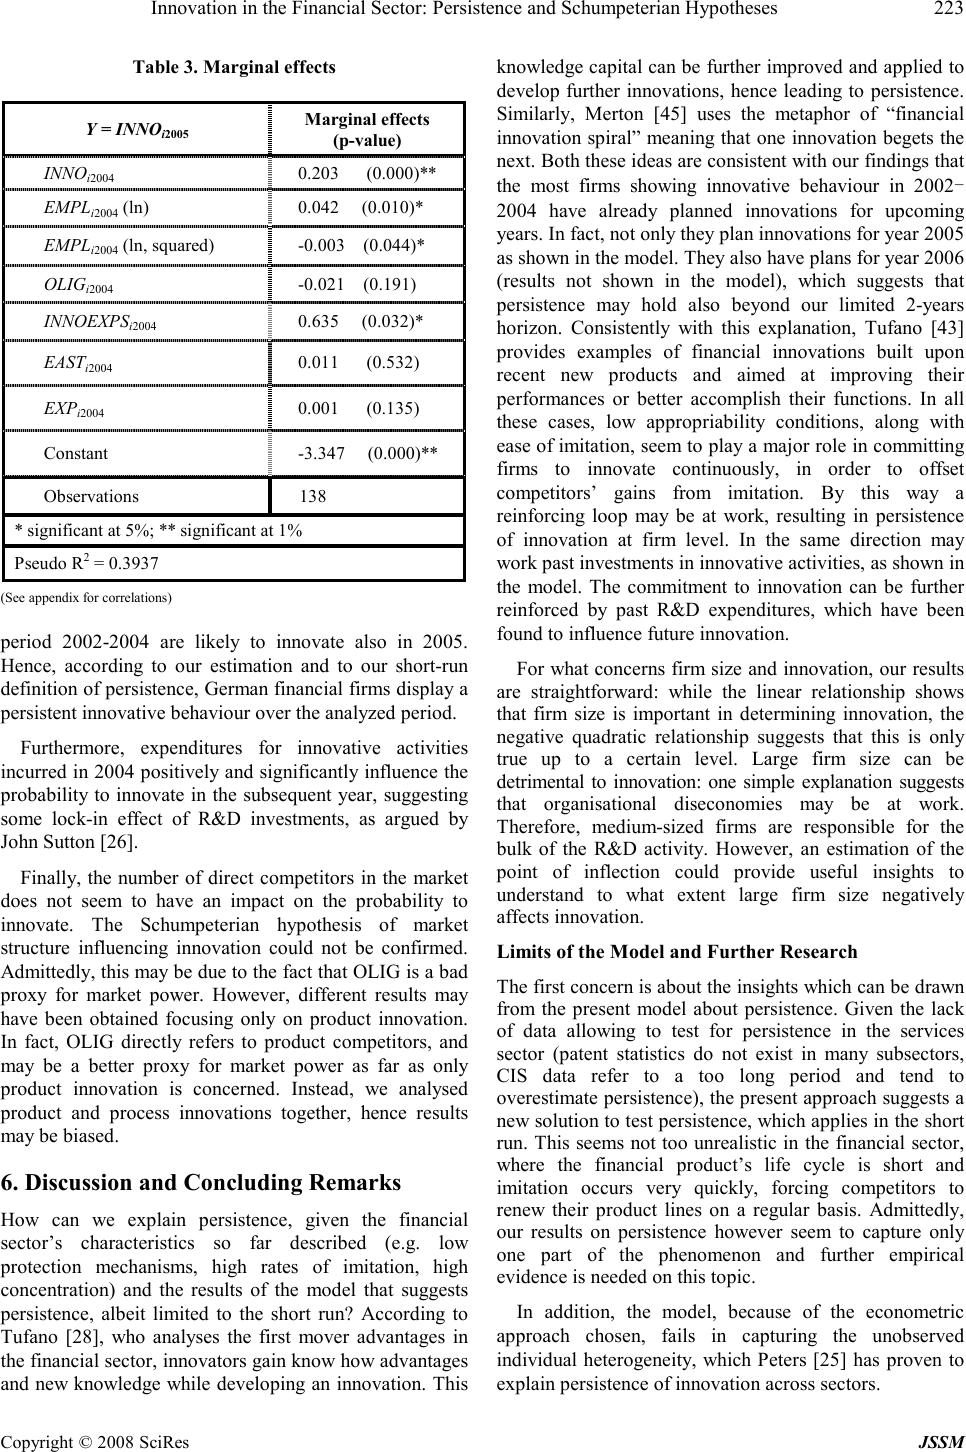 Innovation in the Financial Sector: Persistence and Schumpeterian Hypotheses 223 Copyright © 2008 SciRes JSSM Table 3. Marginal effects Y = INNO i2005 Marginal effects (p-value) INNO i2004 0.203 (0.000)** EMPL i2004 (ln) 0.042 (0.010)* EMPL i2004 (ln, squared) -0.003 (0.044)* OLIG i2004 -0.021 (0.191) INNOEXPS i2004 0.635 (0.032)* EAST i2004 0.011 (0.532) EXP i2004 0.001 (0.135) Constant -3.347 (0.000)** Observations 138 * significant at 5%; ** significant at 1% Pseudo R 2 = 0.3937 (See appendix for correlations) period 2002-2004 are likely to innovate also in 2005. Hence, according to our estimation and to our short-run definition of persistence, German financial firms display a persistent innovative behaviour over the analyzed period. Furthermore, expenditures for innovative activities incurred in 2004 positively and significantly influence the probability to innovate in the subsequent year, suggesting some lock-in effect of R&D investments, as argued by John Sutton [26]. Finally, the number of direct competitors in the market does not seem to have an impact on the probability to innovate. The Schumpeterian hypothesis of market structure influencing innovation could not be confirmed. Admittedly, this may be due to the fact that OLIG is a bad proxy for market power. However, different results may have been obtained focusing only on product innovation. In fact, OLIG directly refers to product competitors, and may be a better proxy for market power as far as only product innovation is concerned. Instead, we analysed product and process innovations together, hence results may be biased. 6. Discussion and Concluding Remarks How can we explain persistence, given the financial sector’s characteristics so far described (e.g. low protection mechanisms, high rates of imitation, high concentration) and the results of the model that suggests persistence, albeit limited to the short run? According to Tufano [28], who analyses the first mover advantages in the financial sector, innovators gain know how advantages and new knowledge while developing an innovation. This knowledge capital can be further improved and applied to develop further innovations, hence leading to persistence. Similarly, Merton [45] uses the metaphor of “financial innovation spiral” meaning that one innovation begets the next. Both these ideas are consistent with our findings that the most firms showing innovative behaviour in 2002- 2004 have already planned innovations for upcoming years. In fact, not only they plan innovations for year 2005 as shown in the model. They also have plans for year 2006 (results not shown in the model), which suggests that persistence may hold also beyond our limited 2-years horizon. Consistently with this explanation, Tufano [43] provides examples of financial innovations built upon recent new products and aimed at improving their performances or better accomplish their functions. In all these cases, low appropriability conditions, along with ease of imitation, seem to play a major role in committing firms to innovate continuously, in order to offset competitors’ gains from imitation. By this way a reinforcing loop may be at work, resulting in persistence of innovation at firm level. In the same direction may work past investments in innovative activities, as shown in the model. The commitment to innovation can be further reinforced by past R&D expenditures, which have been found to influence future innovation. For what concerns firm size and innovation, our results are straightforward: while the linear relationship shows that firm size is important in determining innovation, the negative quadratic relationship suggests that this is only true up to a certain level. Large firm size can be detrimental to innovation: one simple explanation suggests that organisational diseconomies may be at work. Therefore, medium-sized firms are responsible for the bulk of the R&D activity. However, an estimation of the point of inflection could provide useful insights to understand to what extent large firm size negatively affects innovation. Limits of the Model and Further Research The first concern is about the insights which can be drawn from the present model about persistence. Given the lack of data allowing to test for persistence in the services sector (patent statistics do not exist in many subsectors, CIS data refer to a too long period and tend to overestimate persistence), the present approach suggests a new solution to test persistence, which applies in the short run. This seems not too unrealistic in the financial sector, where the financial product’s life cycle is short and imitation occurs very quickly, forcing competitors to renew their product lines on a regular basis. Admittedly, our results on persistence however seem to capture only one part of the phenomenon and further empirical evidence is needed on this topic. In addition, the model, because of the econometric approach chosen, fails in capturing the unobserved individual heterogeneity, which Peters [25] has proven to explain persistence of innovation across sectors. 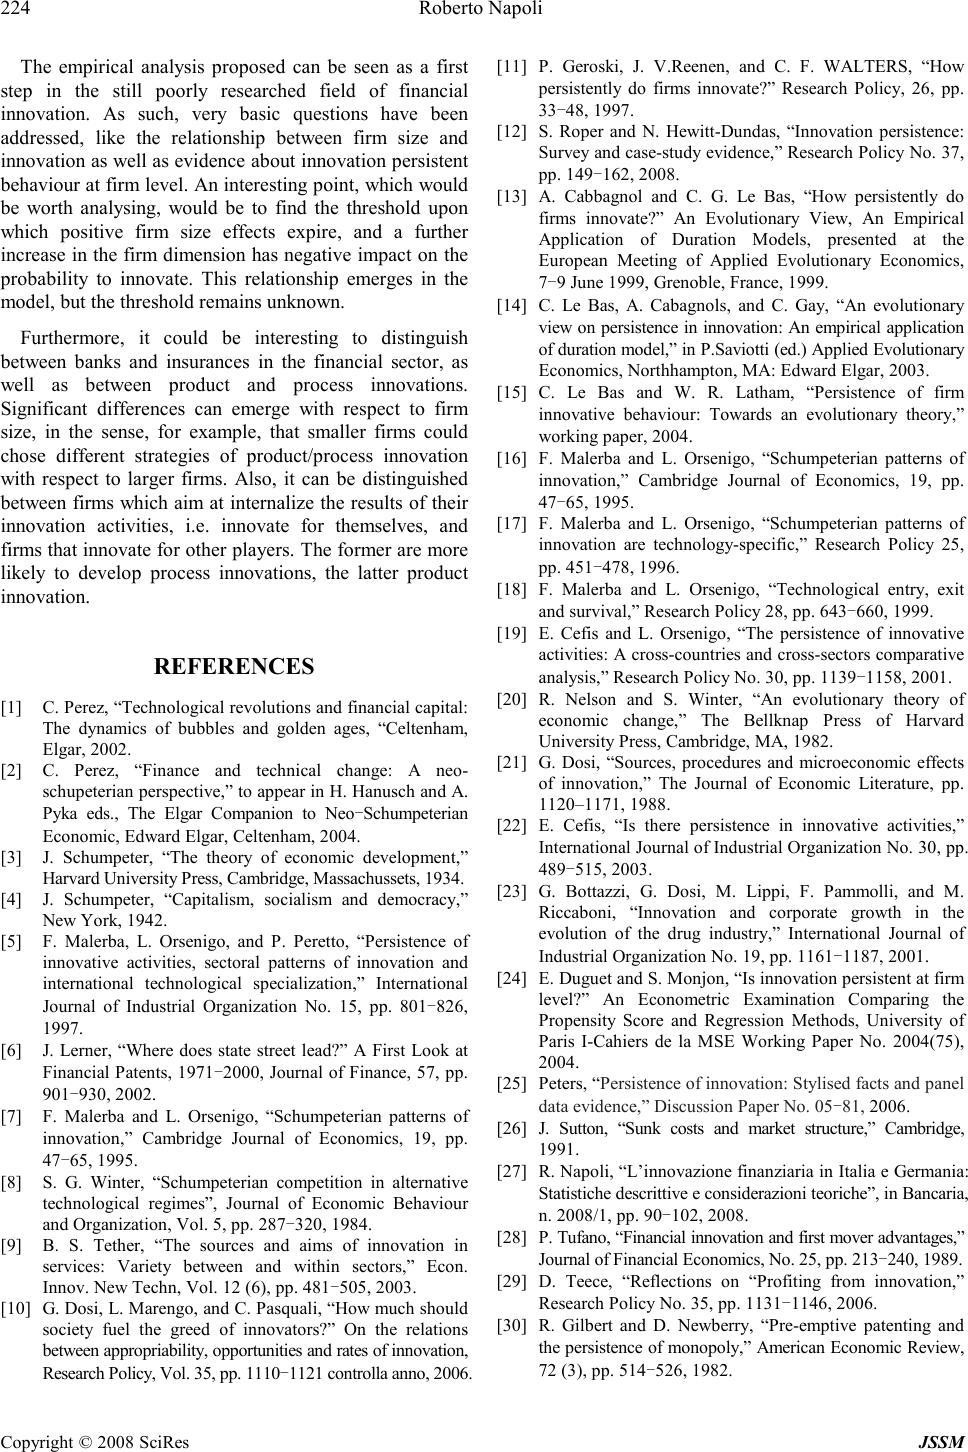 224 Roberto Napoli Copyright © 2008 SciRes JSSM The empirical analysis proposed can be seen as a first step in the still poorly researched field of financial innovation. As such, very basic questions have been addressed, like the relationship between firm size and innovation as well as evidence about innovation persistent behaviour at firm level. An interesting point, which would be worth analysing, would be to find the threshold upon which positive firm size effects expire, and a further increase in the firm dimension has negative impact on the probability to innovate. This relationship emerges in the model, but the threshold remains unknown. Furthermore, it could be interesting to distinguish between banks and insurances in the financial sector, as well as between product and process innovations. Significant differences can emerge with respect to firm size, in the sense, for example, that smaller firms could chose different strategies of product/process innovation with respect to larger firms. Also, it can be distinguished between firms which aim at internalize the results of their innovation activities, i.e. innovate for themselves, and firms that innovate for other players. The former are more likely to develop process innovations, the latter product innovation. REFERENCES [1] C. Perez, “Technological revolutions and financial capital: The dynamics of bubbles and golden ages, “Celtenham, Elgar, 2002. [2] C. Perez, “Finance and technical change: A neo- schupeterian perspective,” to appear in H. Hanusch and A. Pyka eds., The Elgar Companion to Neo-Schumpeterian Economic, Edward Elgar, Celtenham, 2004. [3] J. Schumpeter, “The theory of economic development,” Harvard University Press, Cambridge, Massachussets, 1934. [4] J. Schumpeter, “Capitalism, socialism and democracy,” New York, 1942. [5] F. Malerba, L. Orsenigo, and P. Peretto, “Persistence of innovative activities, sectoral patterns of innovation and international technological specialization,” International Journal of Industrial Organization No. 15, pp. 801-826, 1997. [6] J. Lerner, “Where does state street lead?” A First Look at Financial Patents, 1971-2000, Journal of Finance, 57, pp. 901-930, 2002. [7] F. Malerba and L. Orsenigo, “Schumpeterian patterns of innovation,” Cambridge Journal of Economics, 19, pp. 47-65, 1995. [8] S. G. Winter, “Schumpeterian competition in alternative technological regimes”, Journal of Economic Behaviour and Organization, Vol. 5, pp. 287-320, 1984. [9] B. S. Tether, “The sources and aims of innovation in services: Variety between and within sectors,” Econ. Innov. New Techn, Vol. 12 (6), pp. 481-505, 2003. [10] G. Dosi, L. Marengo, and C. Pasquali, “How much should society fuel the greed of innovators?” On the relations between appropriability, opportunities and rates of innovation, Research Policy, Vol. 35, pp. 1110-1121 controlla anno, 2006. [11] P. Geroski, J. V.Reenen, and C. F. WALTERS, “How persistently do firms innovate?” Research Policy, 26, pp. 33-48, 1997. [12] S. Roper and N. Hewitt-Dundas, “Innovation persistence: Survey and case-study evidence,” Research Policy No. 37, pp. 149-162, 2008. [13] A. Cabbagnol and C. G. Le Bas, “How persistently do firms innovate?” An Evolutionary View, An Empirical Application of Duration Models, presented at the European Meeting of Applied Evolutionary Economics, 7-9 June 1999, Grenoble, France, 1999. [14] C. Le Bas, A. Cabagnols, and C. Gay, “An evolutionary view on persistence in innovation: An empirical application of duration model,” in P.Saviotti (ed.) Applied Evolutionary Economics, Northhampton, MA: Edward Elgar, 2003. [15] C. Le Bas and W. R. Latham, “Persistence of firm innovative behaviour: Towards an evolutionary theory,” working paper, 2004. [16] F. Malerba and L. Orsenigo, “Schumpeterian patterns of innovation,” Cambridge Journal of Economics, 19, pp. 47-65, 1995. [17] F. Malerba and L. Orsenigo, “Schumpeterian patterns of innovation are technology-specific,” Research Policy 25, pp. 451-478, 1996. [18] F. Malerba and L. Orsenigo, “Technological entry, exit and survival,” Research Policy 28, pp. 643-660, 1999. [19] E. Cefis and L. Orsenigo, “The persistence of innovative activities: A cross-countries and cross-sectors comparative analysis,” Research Policy No. 30, pp. 1139-1158, 2001. [20] R. Nelson and S. Winter, “An evolutionary theory of economic change,” The Bellknap Press of Harvard University Press, Cambridge, MA, 1982. [21] G. Dosi, “Sources, procedures and microeconomic effects of innovation,” The Journal of Economic Literature, pp. 1120–1171, 1988. [22] E. Cefis, “Is there persistence in innovative activities,” International Journal of Industrial Organization No. 30, pp. 489-515, 2003. [23] G. Bottazzi, G. Dosi, M. Lippi, F. Pammolli, and M. Riccaboni, “Innovation and corporate growth in the evolution of the drug industry,” International Journal of Industrial Organization No. 19, pp. 1161-1187, 2001. [24] E. Duguet and S. Monjon, “Is innovation persistent at firm level?” An Econometric Examination Comparing the Propensity Score and Regression Methods, University of Paris I-Cahiers de la MSE Working Paper No. 2004(75), 2004. [25] Peters, “Persistence of innovation: Stylised facts and panel data evidence,” Discussion Paper No. 05-81, 2006. [26] J. Sutton, “Sunk costs and market structure,” Cambridge, 1991. [27] R. Napoli, “L’innovazione finanziaria in Italia e Germania: Statistiche descrittive e considerazioni teoriche”, in Bancaria, n. 2008/1, pp. 90-102, 2008. [28] P. Tufano, “Financial innovation and first mover advantages,” Journal of Financial Economics, No. 25, pp. 213-240, 1989. [29] D. Teece, “Reflections on “Profiting from innovation,” Research Policy No. 35, pp. 1131-1146, 2006. [30] R. Gilbert and D. Newberry, “Pre-emptive patenting and the persistence of monopoly,” American Economic Review, 72 (3), pp. 514-526, 1982. 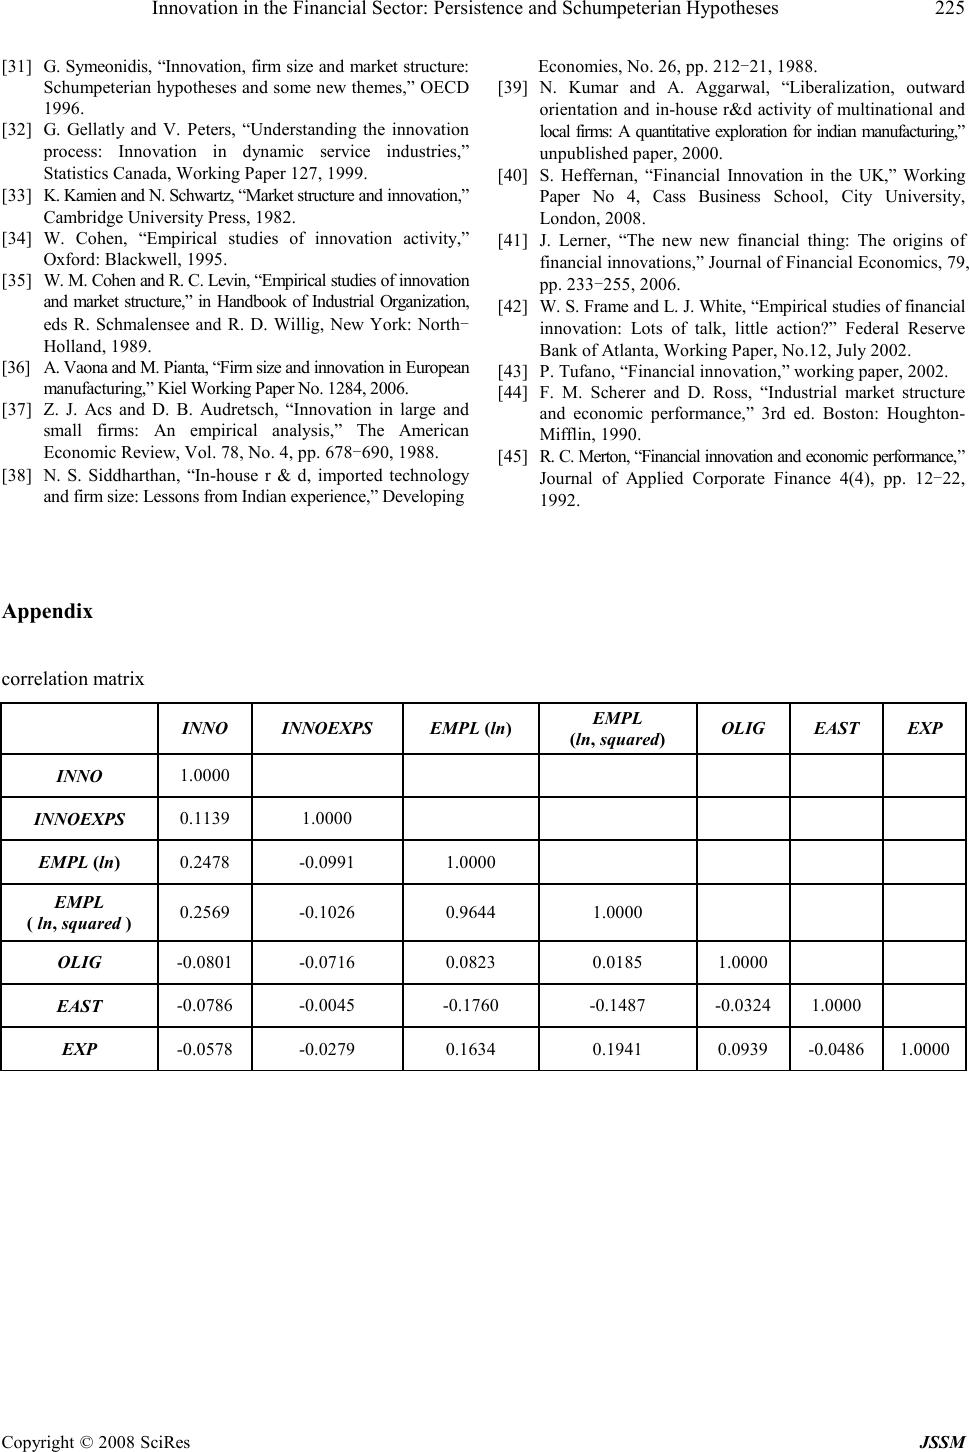 Innovation in the Financial Sector: Persistence and Schumpeterian Hypotheses 225 Copyright © 2008 SciRes JSSM [31] G. Symeonidis, “Innovation, firm size and market structure: Schumpeterian hypotheses and some new themes,” OECD 1996. [32] G. Gellatly and V. Peters, “Understanding the innovation process: Innovation in dynamic service industries,” Statistics Canada, Working Paper 127, 1999. [33] K. Kamien and N. Schwartz, “Market structure and innovation,” Cambridge University Press, 1982. [34] W. Cohen, “Empirical studies of innovation activity,” Oxford: Blackwell, 1995. [35] W. M. Cohen and R. C. Levin, “Empirical studies of innovation and market structure,” in Handbook of Industrial Organization, eds R. Schmalensee and R. D. Willig, New York: North- Holland, 1989. [36] A. Vaona and M. Pianta, “Firm size and innovation in European manufacturing,” Kiel Working Paper No. 1284, 2006. [37] Z. J. Acs and D. B. Audretsch, “Innovation in large and small firms: An empirical analysis,” The American Economic Review, Vol. 78, No. 4, pp. 678-690, 1988. [38] N. S. Siddharthan, “In-house r & d, imported technology and firm size: Lessons from Indian experience,” Developing Economies, No. 26, pp. 212-21, 1988. [39] N. Kumar and A. Aggarwal, “Liberalization, outward orientation and in-house r&d activity of multinational and local firms: A quantitative exploration for indian manufacturing,” unpublished paper, 2000. [40] S. Heffernan, “Financial Innovation in the UK,” Working Paper No 4, Cass Business School, City University, London, 2008. [41] J. Lerner, “The new new financial thing: The origins of financial innovations,” Journal of Financial Economics, 79, pp. 233-255, 2006. [42] W. S. Frame and L. J. White, “Empirical studies of financial innovation: Lots of talk, little action?” Federal Reserve Bank of Atlanta, Working Paper, No.12, July 2002. [43] P. Tufano, “Financial innovation,” working paper, 2002. [44] F. M. Scherer and D. Ross, “Industrial market structure and economic performance,” 3rd ed. Boston: Houghton- Mifflin, 1990. [45] R. C. Merton, “Financial innovation and economic performance,” Journal of Applied Corporate Finance 4(4), pp. 12-22, 1992. Appendix correlation matrix INNO INNOEXPS EMPL (ln) EMPL (ln, squared) OLIG EAST EXP INNO 1.0000 INNOEXPS 0.1139 1.0000 EMPL (ln) 0.2478 -0.0991 1.0000 EMPL ( ln, squared ) 0.2569 -0.1026 0.9644 1.0000 OLIG -0.0801 -0.0716 0.0823 0.0185 1.0000 EAST -0.0786 -0.0045 -0.1760 -0.1487 -0.0324 1.0000 EXP -0.0578 -0.0279 0.1634 0.1941 0.0939 -0.0486 1.0000 |