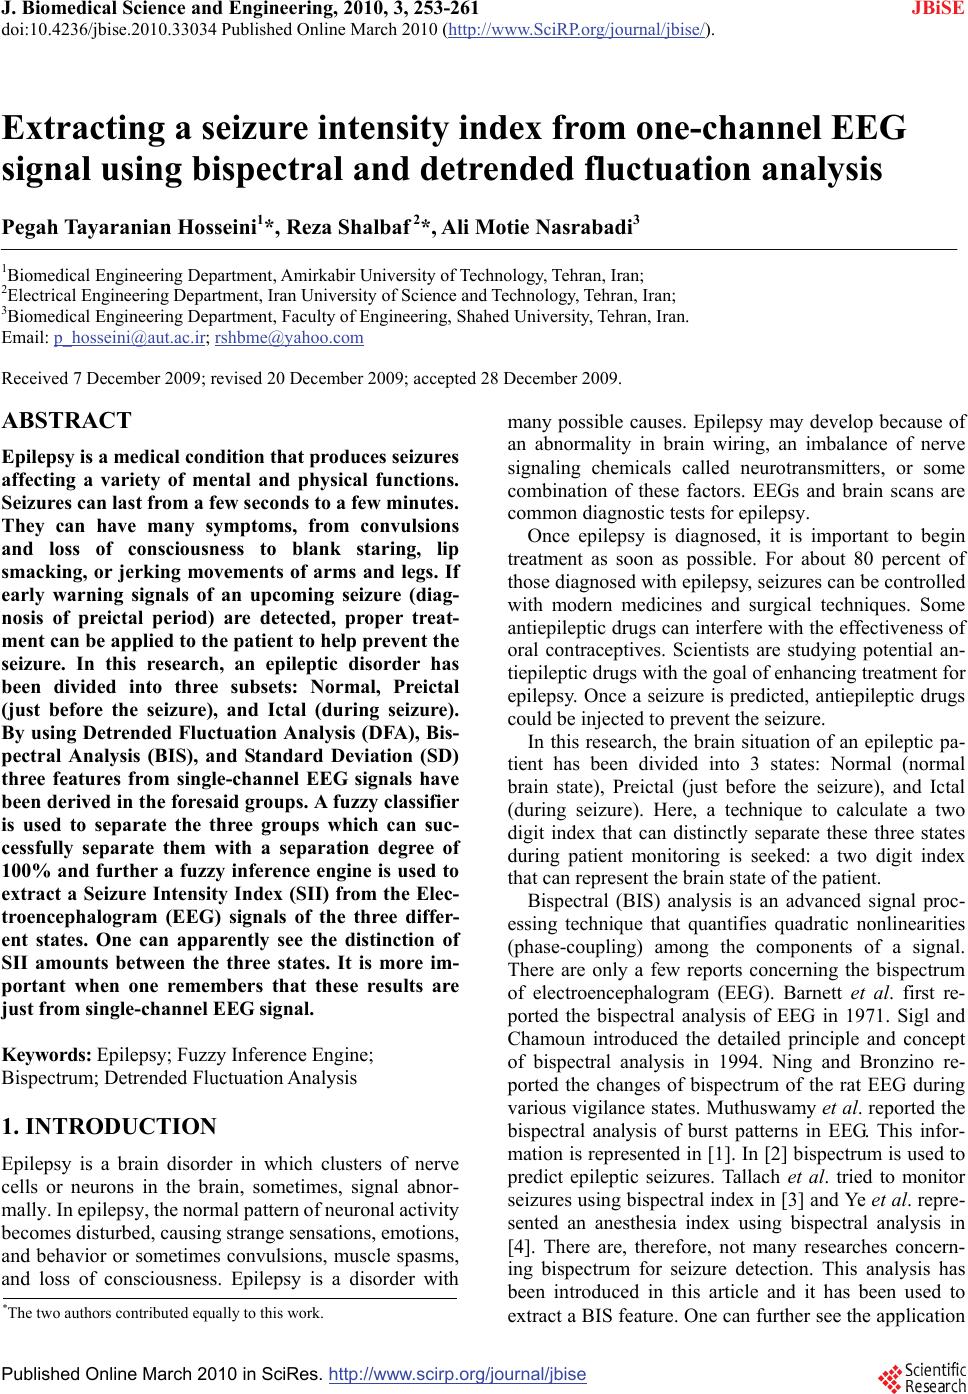
 J. Biomedical Science and Engineering, 2010, 3, 253-261 doi:10.4236/jbise.2010.33034 Published Online March 2010 (http://www.SciRP.org/journal/jbise/ JBiSE ). Published Online March 2010 in SciRes. http://www.scirp.org/journal/jbise Extracting a seizure intensity index from one-channel EEG signal using bispectral and detrended fluctuation analysis Pegah Tayaranian Hosseini1*, Reza Shalbaf 2*, Ali Motie Nasrabadi3 1Biomedical Engineering Department, Amirkabir University of Technology, Tehran, Iran; 2Electrical Engineering Department, Iran University of Science and Technology, Tehran, Iran; 3Biomedical Engineering Department, Faculty of Engineering, Shahed University, Tehran, Iran. Email: p_hosseini@aut.ac.ir; rshbme@yahoo.com Received 7 December 2009; revised 20 December 2009; accepted 28 December 2009. ABSTRACT Epilepsy is a medical condition that produces seizures affecting a variety of mental and physical functions. Seizures can last from a few seconds to a few minutes. They can have many symptoms, from convulsions and loss of consciousness to blank staring, lip smacking, or jerking movements of arms and legs. If early warning signals of an upcoming seizure (diag- nosis of preictal period) are detected, proper treat- ment can be applied to the patient to help prevent the seizure. In this research, an epileptic disorder has been divided into three subsets: Normal, Preictal (just before the seizure), and Ictal (during seizure). By using Detrended Fluctuation Analysis (DFA), Bis- pectral Analysis (BIS), and Standard Deviation (SD) three features from single-channel EEG signals have been derived in the foresaid groups. A fuzzy classifier is used to separate the three groups which can suc- cessfully separate them with a separation degree of 100% and further a fuzzy inference engine is used to extract a Seizure Intensity Index (SII) from the Elec- troencephalogram (EEG) signals of the three differ- ent states. One can apparently see the distinction of SII amounts between the three states. It is more im- portant when one remembers that these results are just from single-channel EEG signal. Keywords: Epilepsy; Fuzzy Inference Engine; Bispectrum; Detrended Fluctuation Analysis 1. INTRODUCTION Epilepsy is a brain disorder in which clusters of nerve cells or neurons in the brain, sometimes, signal abnor- mally. In epilepsy, the normal pattern of neuronal activity becomes disturbed, causing strange sensations, emotions, and behavior or sometimes convulsions, muscle spasms, and loss of consciousness. Epilepsy is a disorder with many possible causes. Epilepsy may develop because of an abnormality in brain wiring, an imbalance of nerve signaling chemicals called neurotransmitters, or some combination of these factors. EEGs and brain scans are common diagnostic tests for epilepsy. Once epilepsy is diagnosed, it is important to begin treatment as soon as possible. For about 80 percent of those diagnosed with epilepsy, seizures can be controlled with modern medicines and surgical techniques. Some antiepileptic drugs can interfere with the effectiveness of oral contraceptives. Scientists are studying potential an- tiepileptic drugs with the goal of enhancing treatment for epilepsy. Once a seizure is predicted, antiepileptic drugs could be injected to prevent the seizure. In this research, the brain situation of an epileptic pa- tient has been divided into 3 states: Normal (normal brain state), Preictal (just before the seizure), and Ictal (during seizure). Here, a technique to calculate a two digit index that can distinctly separate these three states during patient monitoring is seeked: a two digit index that can represent the brain state of the patient. Bispectral (BIS) analysis is an advanced signal proc- essing technique that quantifies quadratic nonlinearities (phase-coupling) among the components of a signal. There are only a few reports concerning the bispectrum of electroencephalogram (EEG). Barnett et al. first re- ported the bispectral analysis of EEG in 1971. Sigl and Chamoun introduced the detailed principle and concept of bispectral analysis in 1994. Ning and Bronzino re- ported the changes of bispectrum of the rat EEG during various vigilance states. Muthuswamy et al. reported the bispectral analysis of burst patterns in EEG. This infor- mation is represented in [1]. In [2] bispectrum is used to predict epileptic seizures. Tallach et al. tried to monitor seizures using bispectral index in [3] and Ye et al. repre- sented an anesthesia index using bispectral analysis in [4]. There are, therefore, not many researches concern- ing bispectrum for seizure detection. This analysis has been introduced in this article and it has been used to extract a BIS feature. One can further see the application *The two authors contributed equally to this work. 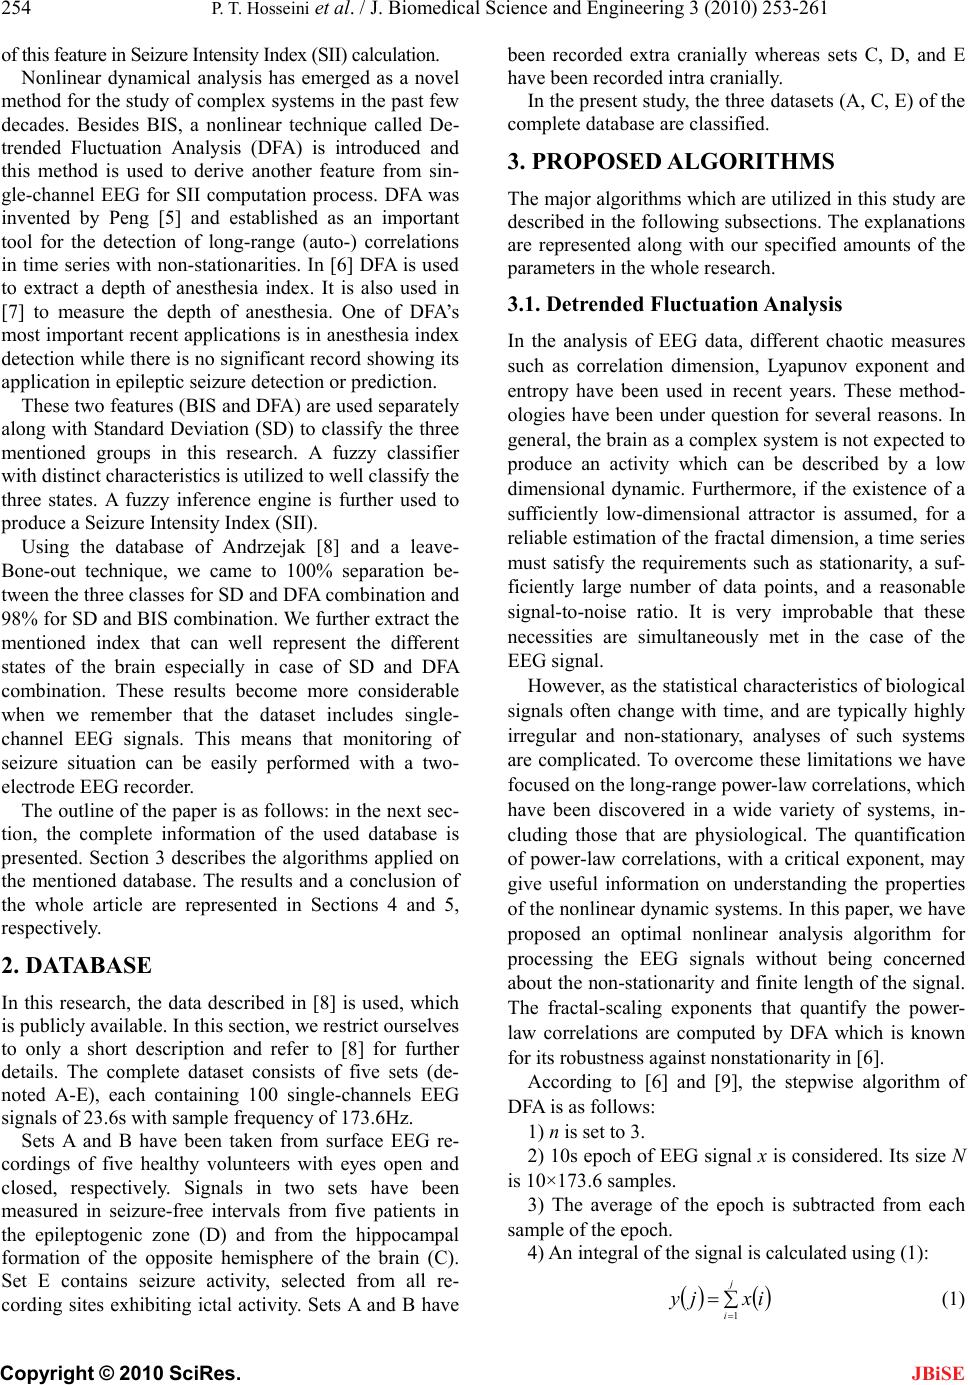 254 P. T. Hosseini et al. / J. Biomedical Science and Engineering 3 (2010) 253-261 Copyright © 2010 SciRes. JBiSE of this feature in Seizure Intensity Index (SII) calculation. Nonlinear dynamical analysis has emerged as a novel method for the study of complex systems in the past few decades. Besides BIS, a nonlinear technique called De- trended Fluctuation Analysis (DFA) is introduced and this method is used to derive another feature from sin- gle-channel EEG for SII computation process. DFA was invented by Peng [5] and established as an important tool for the detection of long-range (auto-) correlations in time series with non-stationarities. In [6] DFA is used to extract a depth of anesthesia index. It is also used in [7] to measure the depth of anesthesia. One of DFA’s most important recent applications is in anesthesia index detection while there is no significant record showing its application in epileptic seizure detection or prediction. These two features (BIS and DFA) are used separately along with Standard Deviation (SD) to classify the three mentioned groups in this research. A fuzzy classifier with distinct characteristics is utilized to well classify the three states. A fuzzy inference engine is further used to produce a Seizure Intensity Index (SII). Using the database of Andrzejak [8] and a leave- Bone-out technique, we came to 100% separation be- tween the three classes for SD and DFA combination and 98% for SD and BIS combination. We further extract the mentioned index that can well represent the different states of the brain especially in case of SD and DFA combination. These results become more considerable when we remember that the dataset includes single- channel EEG signals. This means that monitoring of seizure situation can be easily performed with a two- electrode EEG recorder. The outline of the paper is as follows: in the next sec- tion, the complete information of the used database is presented. Section 3 describes the algorithms applied on the mentioned database. The results and a conclusion of the whole article are represented in Sections 4 and 5, respectively. 2. DATABASE In this research, the data described in [8] is used, which is publicly available. In this section, we restrict ourselves to only a short description and refer to [8] for further details. The complete dataset consists of five sets (de- noted A-E), each containing 100 single-channels EEG signals of 23.6s with sample frequency of 173.6Hz. Sets A and B have been taken from surface EEG re- cordings of five healthy volunteers with eyes open and closed, respectively. Signals in two sets have been measured in seizure-free intervals from five patients in the epileptogenic zone (D) and from the hippocampal formation of the opposite hemisphere of the brain (C). Set E contains seizure activity, selected from all re- cording sites exhibiting ictal activity. Sets A and B have been recorded extra cranially whereas sets C, D, and E have been recorded intra cranially. In the present study, the three datasets (A, C, E) of the complete database are classified. 3. PROPOSED ALGORITHMS The major algorithms which are utilized in this study are described in the following subsections. The explanations are represented along with our specified amounts of the parameters in the whole research. 3.1. Detrended Fluctuation Analysis In the analysis of EEG data, different chaotic measures such as correlation dimension, Lyapunov exponent and entropy have been used in recent years. These method- ologies have been under question for several reasons. In general, the brain as a complex system is not expected to produce an activity which can be described by a low dimensional dynamic. Furthermore, if the existence of a sufficiently low-dimensional attractor is assumed, for a reliable estimation of the fractal dimension, a time series must satisfy the requirements such as stationarity, a suf- ficiently large number of data points, and a reasonable signal-to-noise ratio. It is very improbable that these necessities are simultaneously met in the case of the EEG signal. However, as the statistical characteristics of biological signals often change with time, and are typically highly irregular and non-stationary, analyses of such systems are complicated. To overcome these limitations we have focused on the long-range power-law correlations, which have been discovered in a wide variety of systems, in- cluding those that are physiological. The quantification of power-law correlations, with a critical exponent, may give useful information on understanding the properties of the nonlinear dynamic systems. In this paper, we have proposed an optimal nonlinear analysis algorithm for processing the EEG signals without being concerned about the non-stationarity and finite length of the signal. The fractal-scaling exponents that quantify the power- law correlations are computed by DFA which is known for its robustness against nonstationarity in [6]. According to [6] and [9], the stepwise algorithm of DFA is as follows: 1) n is set to 3. 2) 10s epoch of EEG signal x is considered. Its size N is 10×173.6 samples. 3) The average of the epoch is subtracted from each sample of the epoch. 4) An integral of the signal is calculated using (1): j i ixjy 1 (1) 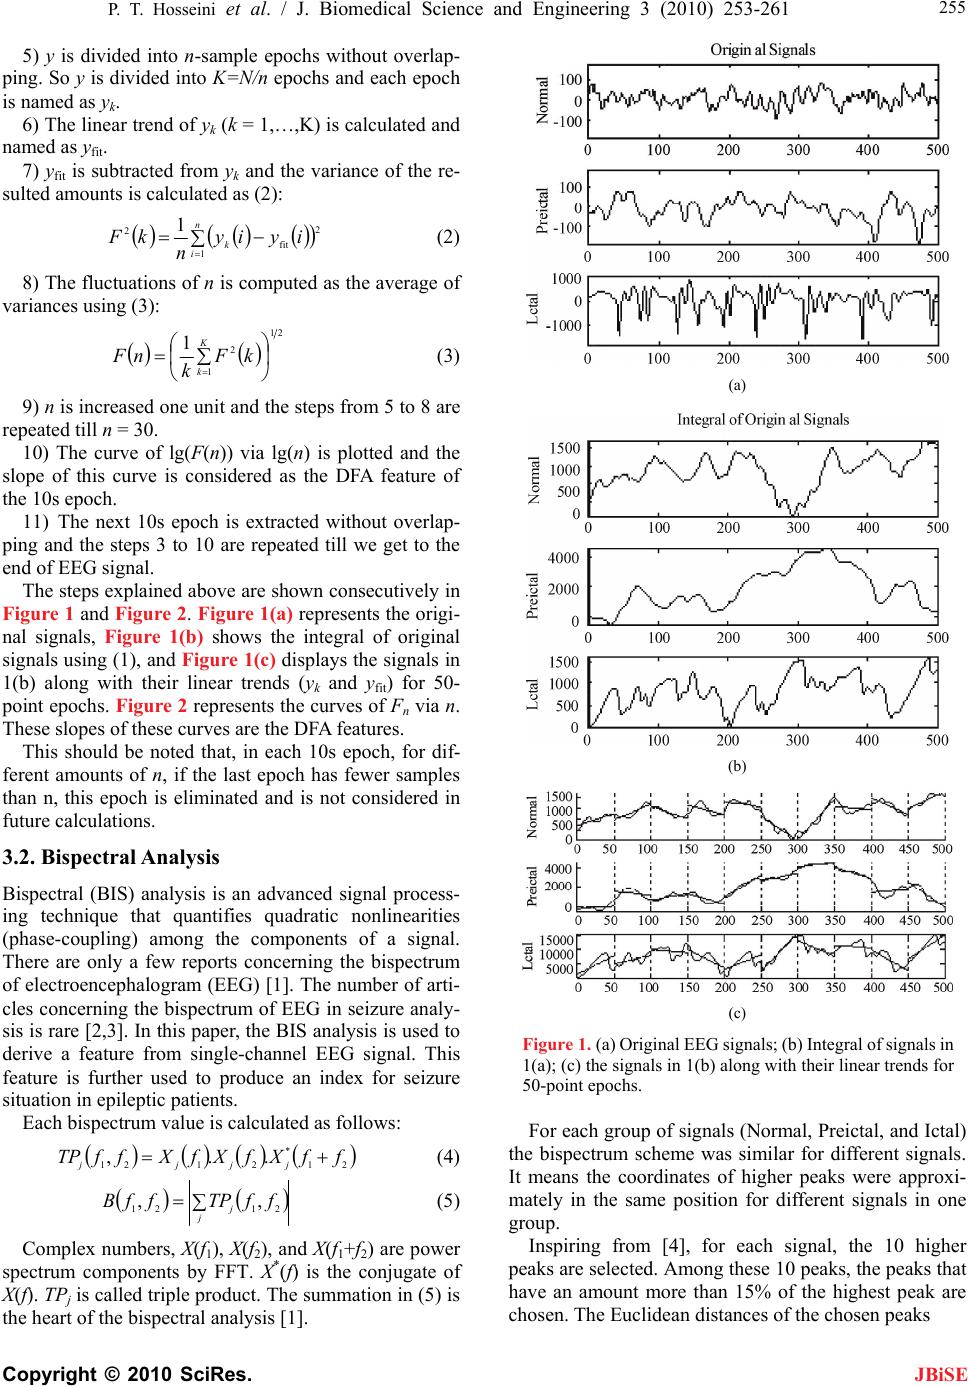 P. T. Hosseini et al. / J. Biomedical Science and Engineering 3 (2010) 253-261 Copyright © 2010 SciRes. 255 JBiSE 5) y is divided into n-sample epochs without overlap- ping. So y is divided into K=N/n epochs and each epoch is named as yk. 6) The linear trend of yk (k = 1,…,K) is calculated and named as yfit. 7) yfit is subtracted from yk and the variance of the re- sulted amounts is calculated as (2): n ikiyiy n kF 1 2 fit 21 (2) 8) The fluctuations of n is computed as the average of variances using (3): 21 1 2 1 K k kF k nF (3) 9) n is increased one unit and the steps from 5 to 8 are repeated till n = 30. 10) The curve of lg(F(n)) via lg(n) is plotted and the slope of this curve is considered as the DFA feature of the 10s epoch. 11) The next 10s epoch is extracted without overlap- ping and the steps 3 to 10 are repeated till we get to the end of EEG signal. The steps explained above are shown consecutively in Figure 1 and Figure 2. Figure 1(a) represents the origi- nal signals, Figure 1(b) shows the integral of original signals using (1), and Figure 1(c) displays the signals in 1(b) along with their linear trends (yk and yfit) for 50- point epochs. Figure 2 represents the curves of Fn via n. These slopes of these curves are the DFA features. This should be noted that, in each 10s epoch, for dif- ferent amounts of n, if the last epoch has fewer samples than n, this epoch is eliminated and is not considered in future calculations. 3.2. Bispectral Analysis Bispectral (BIS) analysis is an advanced signal process- ing technique that quantifies quadratic nonlinearities (phase-coupling) among the components of a signal. There are only a few reports concerning the bispectrum of electroencephalogram (EEG) [1]. The number of arti- cles concerning the bispectrum of EEG in seizure analy- sis is rare [2,3]. In this paper, the BIS analysis is used to derive a feature from single-channel EEG signal. This feature is further used to produce an index for seizure situation in epileptic patients. Each bispectrum value is calculated as follows: 21 * 2121..,ffXfXfXffTP jjjj (4) jjffTPffB 2121,, (5) Complex numbers, X(f1), X(f2), and X(f1+f2) are power spectrum components by FFT. X*(f) is the conjugate of X(f). TPj is called triple product. The summation in (5) is the heart of the bispectral analysis [1]. (a) (b) (c) Figure 1. (a) Original EEG signals; (b) Integral of signals in 1(a); (c) the signals in 1(b) along with their linear trends for 50-point epochs. For each group of signals (Normal, Preictal, and Ictal) the bispectrum scheme was similar for different signals. It means the coordinates of higher peaks were approxi- mately in the same position for different signals in one group. Inspiring from [4], for each signal, the 10 higher peaks are selected. Among these 10 peaks, the peaks that have an amount more than 15% of the highest peak are chosen. The Euclidean distances of the chosen peaks  256 P. T. Hosseini et al. / J. Biomedical Science and Engineering 3 (2010) 253-261 Copyright © 2010 SciRes. JBiSE Figure 2. The Fn curves of the EEG signals of Figure 1(a) for different n’s. Their slopes are the final DFA features. from zero are calculated and summed together. The final amount is considered as the BIS feature of that signal. 3.3. Fuzzy Inference Engine In this section, we briefly describe the fuzzy classifica- tion method based on fuzzy if-then rules proposed in [10,11,12,13]. Designing membership functions (MF’s) is the fun- damental stage in constructing a fuzzy classifier. MF’s should partition the input space efficiently such that the different subsets of training patterns can be well learned by the classifier [13]. In the present study, input mem- bership functions are designed with respect to the data distribution pattern over each dimension (the box plots of the obtained features are represented in Section 4). Figure 3 shows the membership functions that were used for BIS, DFA, and SD inputs. As described later, the proposed fuzzy procedure has 2 inputs. Once the inputs are DFA and SD and the other time they are BIS and SD. The proposed fuzzy rule-based classification system consists of N fuzzy if-then rules each of which has a form as in (6): ,,...,2,1 , ... : 11 NjCFwithCisclassthenA isxandandAisxIfRRule jjjn njj (6) where Rj is the label of the j-th fuzzy if-then rule, Aj1,…, Ajn are antecedent fuzzy sets on the input range, Cj is the consequent class (i.e. one of the M given classes), and CFj is the grade of certainty of the fuzzy if-then rule Rj . There are two steps in the generation of fuzzy if-then rules: specification of antecedent part and determination of consequent class Cj and the grade of certainty CFj. The antecedent part of fuzzy if-then rules is specified manually. Then the consequent part (i.e. consequent class and the grade of certainty) is determined from the given training patterns [12]. Let us assume that m training patterns xp= (xp1, …, xpn), p=1 ,…, m, are given for an n-dimensional C-class pattern classification problem. It is also assumed that a weight wp, p=1, …, m, is assigned to each training pat- tern a priori. The consequent class Cj and the grade of certainty CFj of the if-then rule are determined in the following manner: Step 1: Calculate Class h(j) for Class h as (7): hClassxppjh p wxj Class. (7) where, pnjnpjpj xxx ... 11 (8) and jn is the membership function of the fuzzy set Ajn. In this paper, the fuzzy sets are used as in Figure 3. Step 2: Find the Class h that has the maximum value of Class h(j): jj k Mk h Class 1 ˆ Classmax (9) This should be noted that this fuzzy rule generation method can also be applied to the standard pattern clas- sification problem where there are no pattern weights. In this case, the class and the grade of certainty are deter- mined from training patterns by specifying a pattern weight as wp=1 for p=1,…, m. If two or more classes take the maximum value, the consequent class Cj of the rule Rj cannot be deter- mined uniquely. In this case, specify Cj as Cj= . If a single class h takes the maximum value, let Cj be class h . The grade of certainty CFj is determined as (10): hh h jj j CF Class ˆ Class (10) with: hh hj cˆ Class 1 1 (11) After both the consequent class Cj and the grade of certainty CFj are determined for all N rules, a new pat- tern x=(x1 ,…, xn) can be classified by the following pro- cedure. Calculate J (x) for j =1,…, N, as: jjjJ CCFxx.max (12) in which J is the number of winner rule. The class of the new pattern would be the CJ i.e. the class that has been assigned to rule number J. If two or more classes take the maximum value, then the classification of x is rejected (i.e. x is left as an 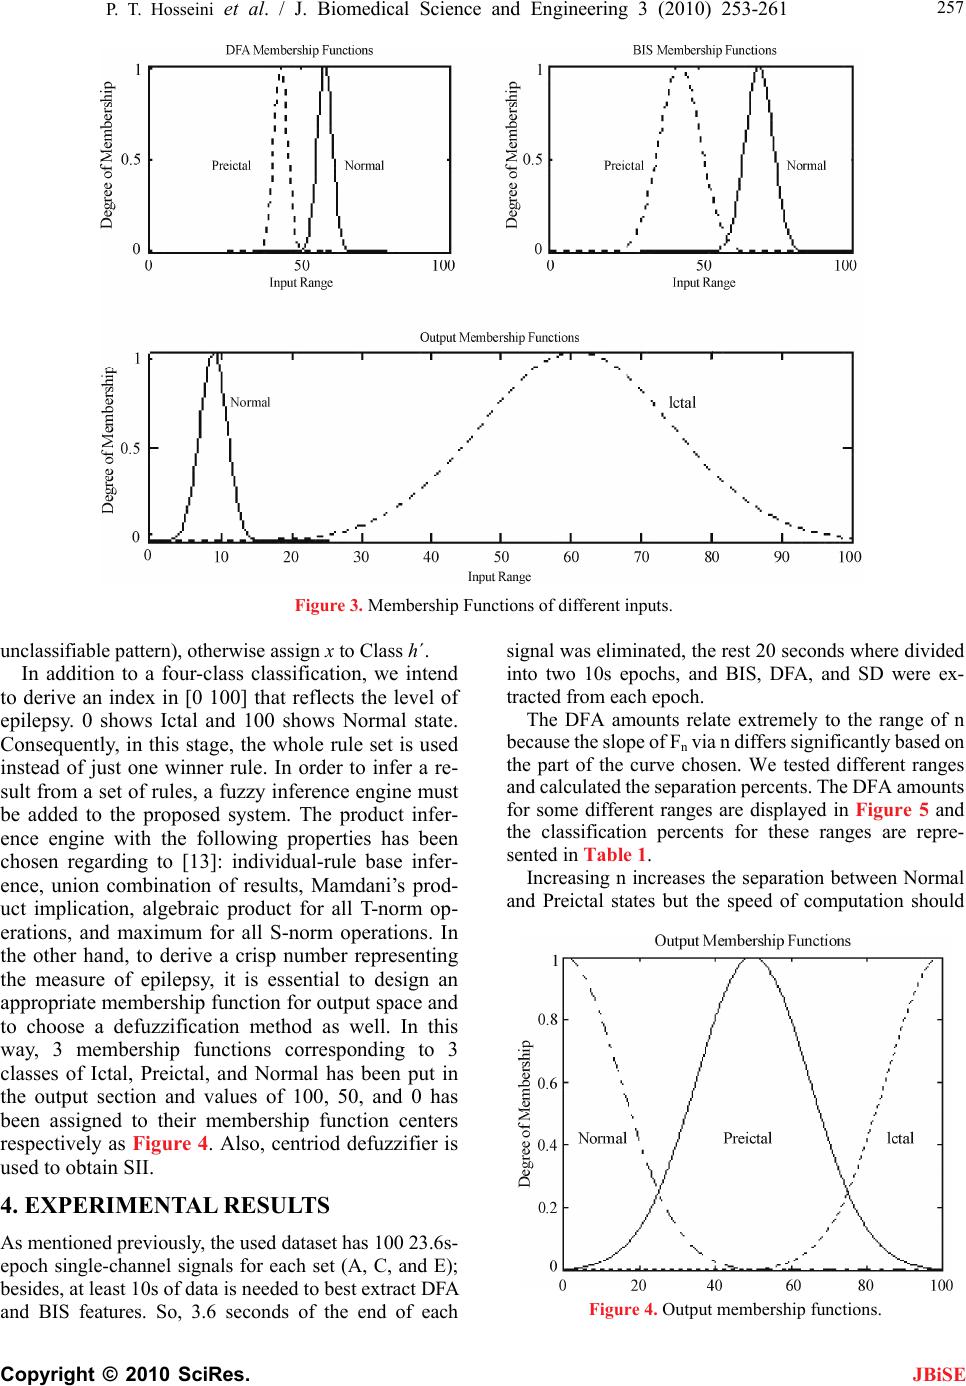 P. T. Hosseini et al. / J. Biomedical Science and Engineering 3 (2010) 253-261 Copyright © 2010 SciRes. 257 Figure 3. Membership Functions of different inputs. unclassifiable pattern), otherwise assign x to Class h´. In addition to a four-class classification, we intend to derive an index in [0 100] that reflects the level of epilepsy. 0 shows Ictal and 100 shows Normal state. Consequently, in this stage, the whole rule set is used instead of just one winner rule. In order to infer a re- sult from a set of rules, a fuzzy inference engine must be added to the proposed system. The product infer- ence engine with the following properties has been chosen regarding to [13]: individual-rule base infer- ence, union combination of results, Mamdani’s prod- uct implication, algebraic product for all T-norm op- erations, and maximum for all S-norm operations. In the other hand, to derive a crisp number representing the measure of epilepsy, it is essential to design an appropriate membership function for output space and to choose a defuzzification method as well. In this way, 3 membership functions corresponding to 3 classes of Ictal, Preictal, and Normal has been put in the output section and values of 100, 50, and 0 has been assigned to their membership function centers respectively as Figure 4. Also, centriod defuzzifier is used to obtain SII. JBiSE 4. EXPERIMENTAL RESULTS As mentioned previously, the used dataset has 100 23.6s- epoch single-channel signals for each set (A, C, and E); besides, at least 10s of data is needed to best extract DFA and BIS features. So, 3.6 seconds of the end of each signal was eliminated, the rest 20 seconds where divided into two 10s epochs, and BIS, DFA, and SD were ex- tracted from each epoch. The DFA amounts relate extremely to the range of n because the slope of Fn via n differs significantly based on the part of the curve chosen. We tested different ranges and calculated the separation percents. The DFA amounts for some different ranges are displayed in Figure 5 and the classification percents for these ranges are repre- sented in Table 1. Increasing n increases the separation between Normal and Preictal states but the speed of computation should Figure 4. Output membership functions. 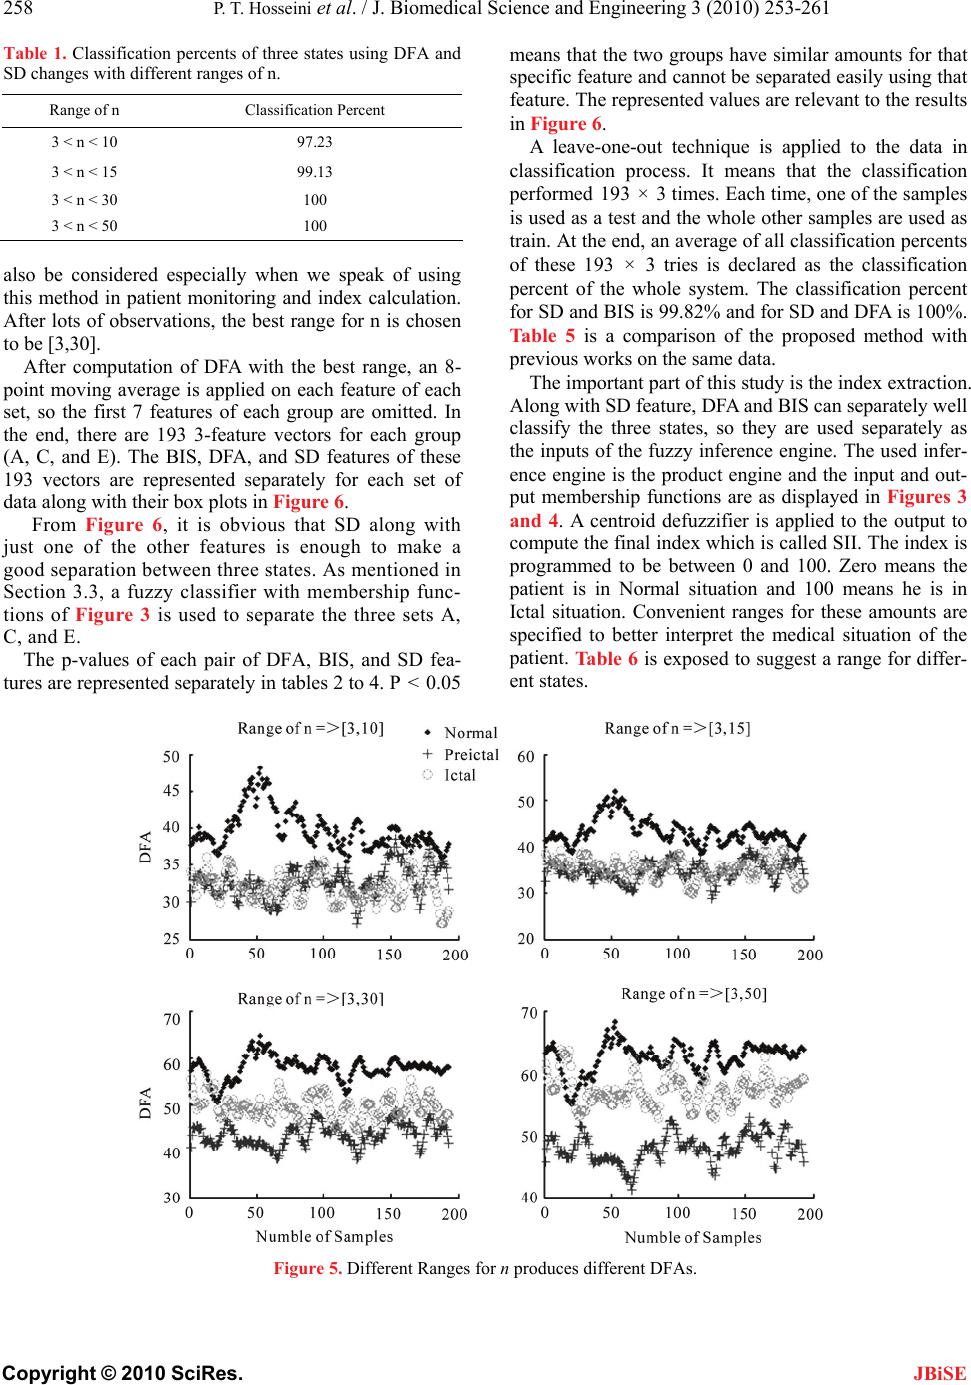 258 P. T. Hosseini et al. / J. Biomedical Science and Engineering 3 (2010) 253-261 Copyright © 2010 SciRes. JBiSE Table 1. Classification percents of three states using DFA and SD changes with different ranges of n. Range of n Classification Percent 3 < n < 10 97.23 3 < n < 15 99.13 3 < n < 30 100 3 < n < 50 100 also be considered especially when we speak of using this method in patient monitoring and index calculation. After lots of observations, the best range for n is chosen to be [3,30]. After computation of DFA with the best range, an 8- point moving average is applied on each feature of each set, so the first 7 features of each group are omitted. In the end, there are 193 3-feature vectors for each group (A, C, and E). The BIS, DFA, and SD features of these 193 vectors are represented separately for each set of data along with their box plots in Figure 6. From Figure 6, it is obvious that SD along with just one of the other features is enough to make a good separation between three states. As mentioned in Section 3.3, a fuzzy classifier with membership func- tions of Figure 3 is used to separate the three sets A, C, and E. The p-values of each pair of DFA, BIS, and SD fea- tures are represented separately in tables 2 to 4. P < 0.05 means that the two groups have similar amounts for that specific feature and cannot be separated easily using that feature. The represented values are relevant to the results in Figure 6. A leave-one-out technique is applied to the data in classification process. It means that the classification performed 193 × 3 times. Each time, one of the samples is used as a test and the whole other samples are used as train. At the end, an average of all classification percents of these 193 × 3 tries is declared as the classification percent of the whole system. The classification percent for SD and BIS is 99.82% and for SD and DFA is 100%. Table 5 is a comparison of the proposed method with previous works on the same data. The important part of this study is the index extraction. Along with SD feature, DFA and BIS can separately well classify the three states, so they are used separately as the inputs of the fuzzy inference engine. The used infer- ence engine is the product engine and the input and out- put membership functions are as displayed in Figures 3 and 4. A centroid defuzzifier is applied to the output to compute the final index which is called SII. The index is programmed to be between 0 and 100. Zero means the patient is in Normal situation and 100 means he is in Ictal situation. Convenient ranges for these amounts are specified to better interpret the medical situation of the patient. Table 6 is exposed to suggest a range for differ- ent states. Figure 5. Different Ranges for n produces different DFAs. 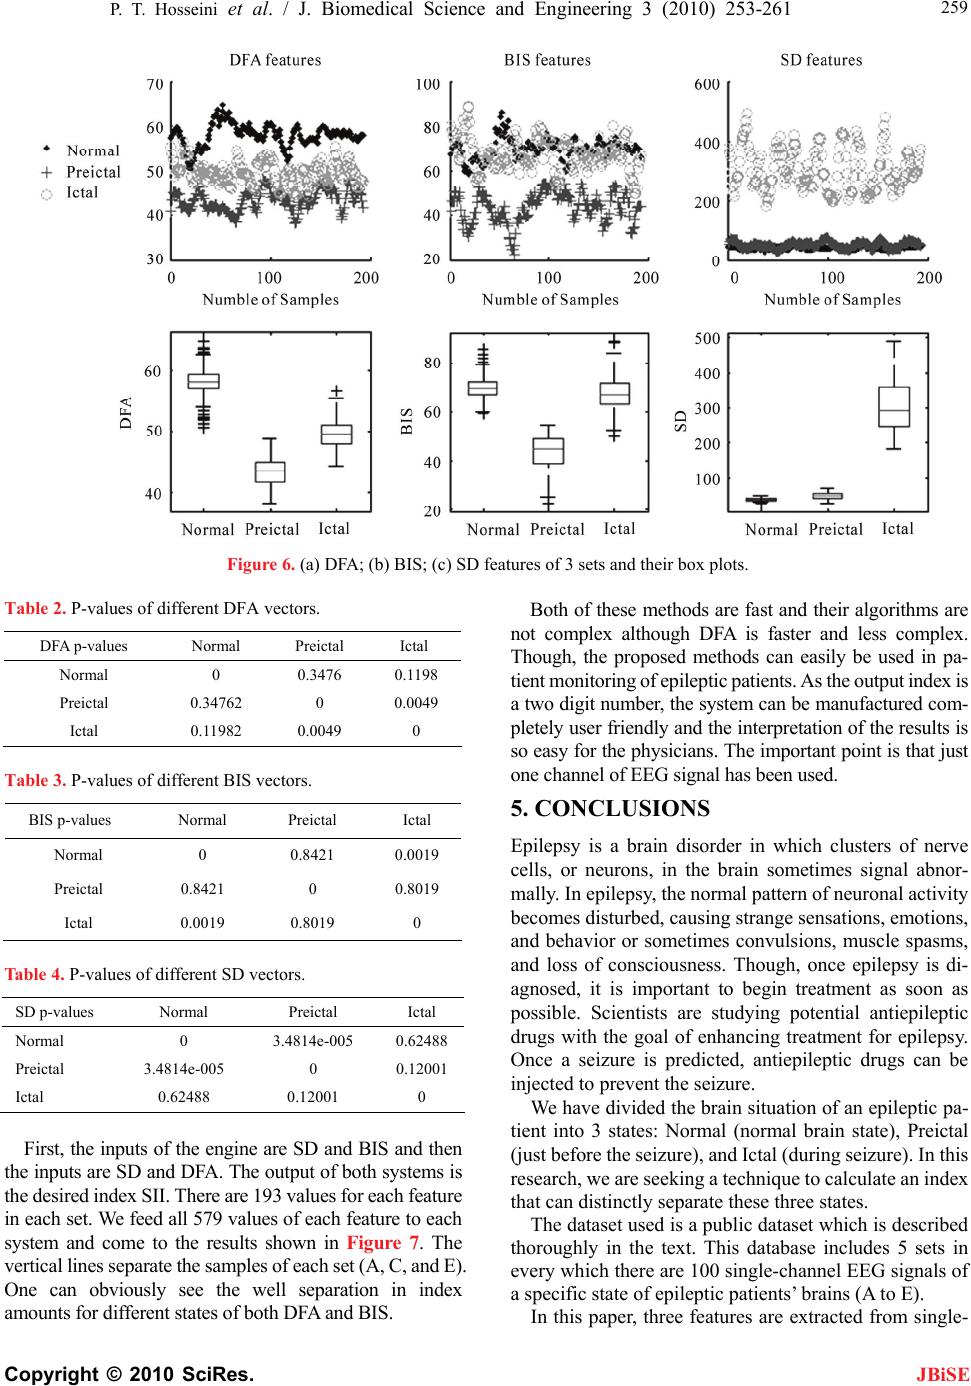 P. T. Hosseini et al. / J. Biomedical Science and Engineering 3 (2010) 253-261 Copyright © 2010 SciRes. 259 JBiSE Figure 6. (a) DFA; (b) BIS; (c) SD features of 3 sets and their box plots. Table 2. P-values of different DFA vectors. DFA p-values Normal Preictal Ictal Normal 0 0.3476 0.1198 Preictal 0.34762 0 0.0049 Ictal 0.11982 0.0049 0 Table 3. P-values of different BIS vectors. BIS p-values Normal Preictal Ictal Normal 0 0.8421 0.0019 Preictal 0.8421 0 0.8019 Ictal 0.0019 0.8019 0 Table 4. P-values of different SD vectors. SD p-values Normal Preictal Ictal Normal 0 3.4814e-005 0.62488 Preictal 3.4814e-005 0 0.12001 Ictal 0.62488 0.12001 0 First, the inputs of the engine are SD and BIS and then the inputs are SD and DFA. The output of both systems is the desired index SII. There are 193 values for each feature in each set. We feed all 579 values of each feature to each system and come to the results shown in Figure 7. The vertical lines separate the samples of each set (A, C, and E). One can obviously see the well separation in index amounts for different states of both DFA and BIS. Both of these methods are fast and their algorithms are not complex although DFA is faster and less complex. Though, the proposed methods can easily be used in pa- tient monitoring of epileptic patients. As the output index is a two digit number, the system can be manufactured com- pletely user friendly and the interpretation of the results is so easy for the physicians. The important point is that just one channel of EEG signal has been used. 5. CONCLUSIONS Epilepsy is a brain disorder in which clusters of nerve cells, or neurons, in the brain sometimes signal abnor- mally. In epilepsy, the normal pattern of neuronal activity becomes disturbed, causing strange sensations, emotions, and behavior or sometimes convulsions, muscle spasms, and loss of consciousness. Though, once epilepsy is di- agnosed, it is important to begin treatment as soon as possible. Scientists are studying potential antiepileptic drugs with the goal of enhancing treatment for epilepsy. Once a seizure is predicted, antiepileptic drugs can be injected to prevent the seizure. We have divided the brain situation of an epileptic pa- tient into 3 states: Normal (normal brain state), Preictal (just before the seizure), and Ictal (during seizure). In this research, we are seeking a technique to calculate an index that can distinctly separate these three states. The dataset used is a public dataset which is described thoroughly in the text. This database includes 5 sets in every which there are 100 single-channel EEG signals of a specific state of epileptic patients’ brains (A to E). In this paper, three features are extracted from single- 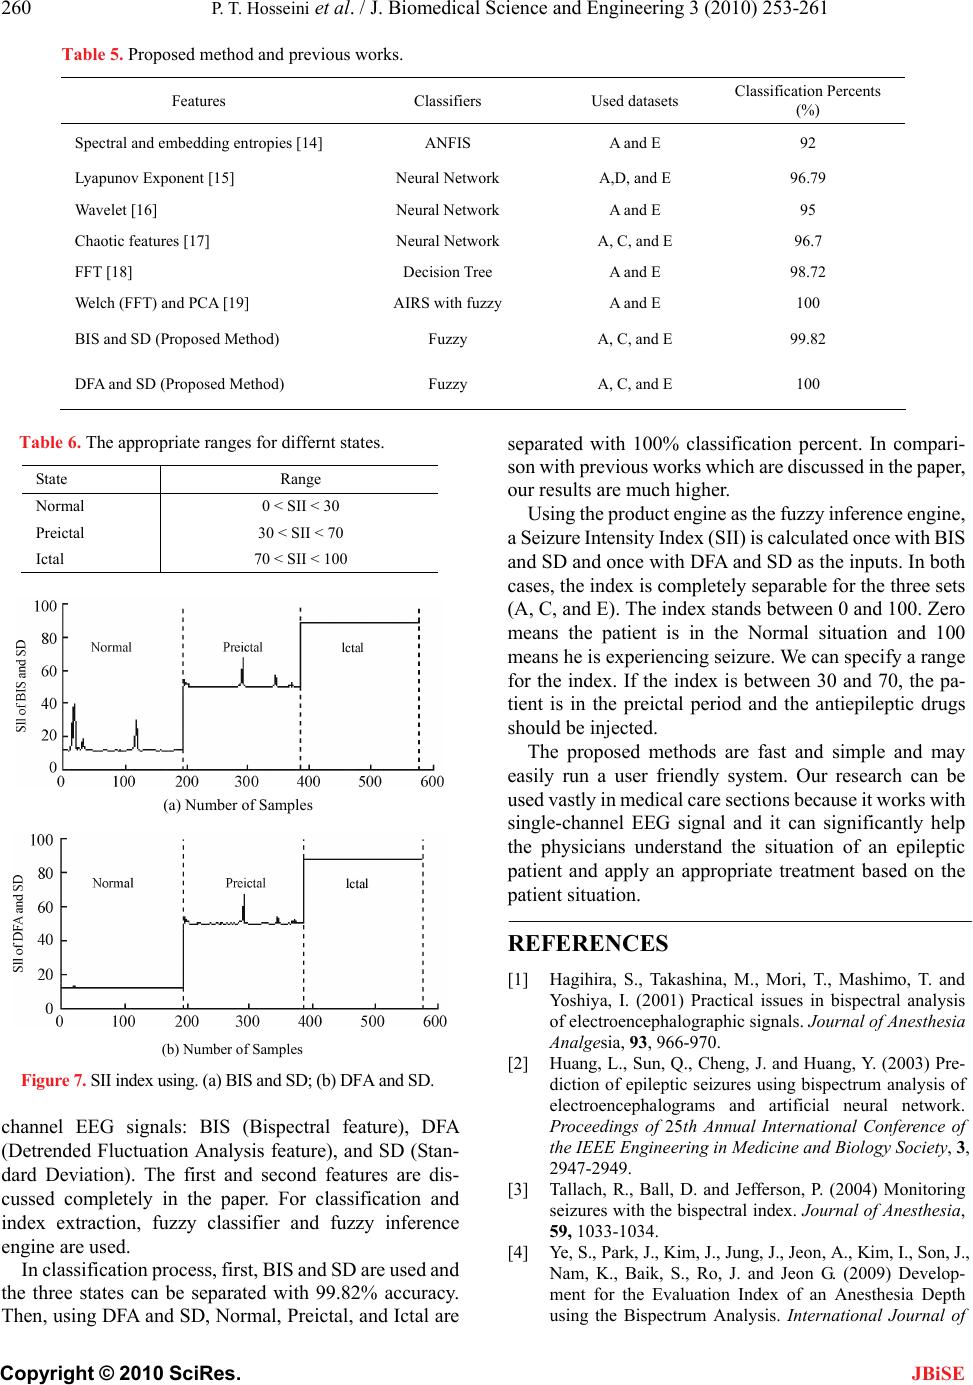 260 P. T. Hosseini et al. / J. Biomedical Science and Engineering 3 (2010) 253-261 Copyright © 2010 SciRes. JBiSE Table 5. Proposed method and previous works. Features Classifiers Used datasets Classification Percents (%) Spectral and embedding entropies [14] ANFIS A and E 92 Lyapunov Exponent [15] Neural Network A,D, and E 96.79 Wavelet [16] Neural Network A and E 95 Chaotic features [17] Neural Network A, C, and E 96.7 FFT [18] Decision Tree A and E 98.72 Welch (FFT) and PCA [19] AIRS with fuzzy A and E 100 BIS and SD (Proposed Method) Fuzzy A, C, and E 99.82 DFA and SD (Proposed Method) Fuzzy A, C, and E 100 Table 6. The appropriate ranges for differnt states. State Range Normal 0 < SII < 30 Preictal 30 < SII < 70 Ictal 70 < SII < 100 (a) Number of Samples (b) Number of Samples Figure 7. SII index using. (a) BIS and SD; (b) DFA and SD. channel EEG signals: BIS (Bispectral feature), DFA (Detrended Fluctuation Analysis feature), and SD (Stan- dard Deviation). The first and second features are dis- cussed completely in the paper. For classification and index extraction, fuzzy classifier and fuzzy inference engine are used. In classification process, first, BIS and SD are used and the three states can be separated with 99.82% accuracy. Then, using DFA and SD, Normal, Preictal, and Ictal are separated with 100% classification percent. In compari- son with previous works which are discussed in the paper, our results are much higher. Using the product engine as the fuzzy inference engine, a Seizure Intensity Index (SII) is calculated once with BIS and SD and once with DFA and SD as the inputs. In both cases, the index is completely separable for the three sets (A, C, and E). The index stands between 0 and 100. Zero means the patient is in the Normal situation and 100 means he is experiencing seizure. We can specify a range for the index. If the index is between 30 and 70, the pa- tient is in the preictal period and the antiepileptic drugs should be injected. The proposed methods are fast and simple and may easily run a user friendly system. Our research can be used vastly in medical care sections because it works with single-channel EEG signal and it can significantly help the physicians understand the situation of an epileptic patient and apply an appropriate treatment based on the patient situation. REFERENCES [1] Hagihira, S., Takashina, M., Mori, T., Mashimo, T. and Yoshiya, I. (2001) Practical issues in bispectral analysis of electroencephalographic signals. Journal of Anesthesia Analgesia, 93, 966-970. [2] Huang, L., Sun, Q., Cheng, J. and Huang, Y. (2003) Pre- diction of epileptic seizures using bispectrum analysis of electroencephalograms and artificial neural network. Proceedings of 25th Annual International Conference of the IEEE Engineering in Medicine and Biology Society, 3, 2947-2949. [3] Tallach, R., Ball, D. and Jefferson, P. (2004) Monitoring seizures with the bispectral index. Journal of Anesthesia, 59, 1033-1034. [4] Ye, S., Park, J., Kim, J., Jung, J., Jeon, A., Kim, I., Son, J., Nam, K., Baik, S., Ro, J. and Jeon G. (2009) Develop- ment for the Evaluation Index of an Anesthesia Depth using the Bispectrum Analysis. International Journal of  P. T. Hosseini et al. / J. Biomedical Science and Engineering 3 (2010) 253-261 Copyright © 2010 SciRes. 261 JBiSE Biological and Medical Sciences, 4, 67-70. [5] Peng, C., Buldyrev, S., Havlin, S., Simons, M., Stanley, H. and Goldberger, A. (1994) Mosaic organization of DNA nucleotides. Journal of Physical Review E, 49, 1685-1689. [6] Gifani, P., Rabiee, H., Hashemi, M., Taslimi, P. and Ghanbari, M. (2007) Optimal fractal-scaling analysis of human EEG dynamic for depth of anesthesia quantifica- tion. Journal of the Franklin Institute, 344, 212-229. [7] Jospin, M., Caminal, P., Jensen, E., Litvan, H., Vallverdu, M., Struys, M., Vereecke, H. and Kaplan, D. (2007) De- trended fluctuation analysis of EEG as a measure of depth of anesthesia. IEEE Transactions on Biomedical Engineering, 54, 840-846. [8] Andrzejak, R., Lehnertz, K., Rieke, C., Mormann, F., David, P. and Elger, C. (2001) Indications of nonlinear deterministic and finite dimensional structures in time series of brain electrical activity: Dependence on re- cording region and brain state. Journal of Physical Re- view E, 64, 061907. [9] Kantelhardta, J., Bundea, E., Regoa, H., Havlinb, S. and Bundea, A. (2001) Detecting long-range correlations with detrended Fluctuation analysis. Journal of Physica A, 295, 441-444. [10] Ishibuchi, H., Nozaki, K., Yamamoto, N. and Tanaka, H. (1995) Selecting fuzzy if-then rules for classification problems using genetic algorithms. IEEE Transactions on Fuzzy Systems, 3, 260-270. [11] Ishibuchi, H. and Nakashima, T. (2001) Effect of rule weights in fuzzy rule-based classification systems. IEEE Transactions on Fuzzy Systems, 9, 506-515. [12] Nakashima, T., Yokota, Y. and Ishibuchi, H. (2005) Learning fuzzy if-then rules for pattern classification with weighted training patterns. Proceedings of 4th Con- ference of the European Society for Fuzzy Logic and Technology and 11th Rencontres Francophones sur la Logique Floue et ses Applications, 1064-1069. [13] Esmaeili, V., Assareh, A., Shamsollahi, M., Moradi, M. and Arefian, N. (2008) Estimating the depth of anesthesia using fuzzy soft computation applied to EEG features. Journal of Intelligent Data Analysis, 12, 393-407. [14] Kannathal, N., Choo, M., Acharya, U. and Sadasivan, P. (2005) Entropies for detection of epilepsy in EEG. Jour- nal of Computer Methods and Programs in Biomedicine, 80, 187-194. [15] Guler, N., Ubeyli, E. and Guler, I. (2005) Recurrent neu- ral networks employing Lyapunov exponents for EEG signals classification. Journal of Expert Systems with Applications, 29, 506-514. [16] Subasi, A. (2007) EEG signal classification using wave- let feature extraction and a mixture of expert model. Jour- nal of Expert Systems with Applications, 32, 1084- 1093. [17] Dastidar, S., Adeli, H. and Dadmehr, N. (2007) Mixed- band wavelet-chaos-neural network methodology for epilepsy and epileptic seizure detection. IEEE Transac- tions on Biomedical Engineering, 54, 1545-1551. [18] Polat, K. and Gunes, S. (2007) Classification of epilepti- form EEG using a hybrid system based on decision tree classifier and fast Fourier transform. Journal of Applied Mathematics and Computation, 187, 1017-1026. [19] Polat, K. and Gunes, S. (2008) Artificial immune recog- nition system with fuzzy resource allocation mechanism classifier, principal component analysis and FFT method based new hybrid automated identification system for classification of EEG signals. Journal of Expert Systems with Applications, 34, 2039-2048.
|