J. Software Engineering & Applications, 2010, 3: 208-220
doi:10.4236/jsea.2010.33026 Published Online March 2010 (http://www.SciRP.org/journal/jsea)
Copyright © 2010 SciRes. JSEA
Automated Identification of Basic Control Charts
Patterns Using Neural Networks
Ahmed Shaban1, Mohammed Shalaby2, Ehab Abdelhafiez2, Ashraf S. Youssef1
1Faculty of Engineering, Fayoum University, Fayoum, Egypt; 2Faculty of Engineering, Cairo University, Giza, Egypt.
Email: ass00@fayoum.edu.eg, mashalaby@aucegypt.edu
Received November 11th, 2009; revised December 5th, 2009; accepted December 10th, 2009.
ABSTRACT
The identification of control chart patterns is very important in statistical process control. Control chart patterns are
categorized as natural and unnatural. The presence of unnatural patterns means that a process is out of statistical
control and there are assignable causes for process variation that should be investigated. This paper proposes an
artificial neural network algorithm to identify the three basic control chart patterns; natural, shift, and trend. This
identification is in addition to the traditional statistical detection of runs in data, since runs are one of the out of control
situations. It is assumed that a process starts as a natural pattern and then may undergo only one out of control pattern
at a time. The performance of the proposed algorithm was evaluated by measuring the probability of success in
identifying the three basic patterns accurately, and comparing these results with previous research work. The
comparison showed that the proposed algorithm realized better identification than others.
Keywords: Artificial Neural Networks (ANN), Control Charts, Control Charts Patterns, Statistical Process Control
(SPC), Natural Pattern, Shift Pattern, Trend Pattern
1. Introduction
With the widespread usage of automatic data acquisition
system for computer charting and analysis of manufac-
turing process data, there is a need to automate the anal-
ysis of process data with little or no human intervention
[1]. Many researchers tried to automate the analysis of
control chart patterns by developing Expert Systems to
limit the human intervention in the analysis process of
the control chart [2–4]. More recently; Artificial Neural
Network (ANN) approach had been investigated. Dislike
expert systems approaches; ANN does not require ex-
plicit rules to identify patterns. It acquires knowledge of
how to identify patterns by learning. Moreover ANN
models are expected to overcome the problem of high
false alarm rate; because it does not depend on any statis-
tical tests that are usually required for the traditional me-
thods. Also, no human intervention will be required
when applying ANN, and thus pattern identification can
be readily integrated with inspection and rapid manufac-
turing technologies.
Control charts patterns are categorized as natural and
unnatural patterns. The presence of an unnatural pattern
such as runs, shifts in process mean, or trends as shown
in Figure 1 means that a process is out of control. The
accurate identification of these unnatural patterns will
help the quality practitioners to determine the assignable
causes for process variation; because each unnatural pat-
tern has its related assignable causes.
Traditional control charts use only recent sample data
point to determine the status of the process based on the
control limits only. They do not provide any pattern re-
lated information. To increase a control chart sensitivity
many supplementary rules like zone tests or run rules
have been suggested by Grant and Leavenworth [5],
Nelson [6], and Western Electric [7] to assist quality
practitioners in detecting unnatural patterns. The primary
problems with applying run rules are that the application
of all the available rules simultaneously can yield an ex-
cess of false alarms due to the natural variability in the
process.
This paper proposes an Artificial Neural Network al-
gorithm to detect and identify the three basic control
chart patterns; natural, shift, and trend. Natural variation
is represented by normal (0, 1) variation, shift in process
mean is expressed in terms of number of standard devia-
tions and trend is expressed as the general slope of a
trend line. This identification of each pattern is in addi-
tion to the traditional statistical detection of data runs. A
run is a sequence of observations of increasing (decreas-
Automated Identification of Basic Control Charts Patterns Using Neural Networks209
ing) points or a sequence of observations above or below
the process mean [8]. It is assumed that a process starts
in control (has natural pattern) and then may undergo
only one out of control pattern at a time (see Figure 1).
For sake of simplicity only cases of upward shift and
trend patterns are investigated. The proposed algorithm
aims to provide a practitioner with a reliable and auto-
mated identification tool; the ANN is designed to maximize
the probability of success in identifying accurately only
these three basic patterns. The paper presents next a litera-
ture review, the design of the ANN network, the proposed
approach for ANN, testing of the ANN algorithm and fi-
nally the performance evaluation of the algorithm.
Natural
-5
-4
-3
-2
-1
0
1
2
3
4
5
13 57 9111315171921232527293133353739
Sampling time
Sample value
Shift in process mean
-5
-4
-3
-2
-1
0
1
2
3
4
5
135791113 15171921 2325272931 33 35 37 39
Sampling time
Sample value
Trend
-5
-4
-3
-2
-1
0
1
2
3
4
5
13 579111315171921232527293133353739
Sampling time
Sample value
Figure 1. Basic patterns of control charts
2. Artificial Neural Network Approaches
ANN is investigated as an alternative tool for the tradi-
tional statistical process control tools. Some researchers
tried to develop ANN models to detect sudden shifts in
mean, shifts in variance, or both, and the others tried to
develop ANN models to detect and identify all control
chart patterns.
Smith [9] trained a single neural network to simulta-
neously model X-bar and R charts. The single output
from the network was then interpreted simply as either
no shift; a shift in mean; or a shift in variance. The input
to smith’s model was the subgroup observations plus
some statistical characteristics obtained from the obser-
vations. Guo and Dooley [9] looked at positive shifts in
both mean and variance using back propagation neural
networks. Pugh [11,12] developed a back propagation
neural network to detect a sudden shift in a process mean.
Chang and Ho [13] developed a NN model that consists
of two stages; stage one to detect the process variance
change; and stage two to estimate the process variance
magnitude. Their work resembles the R-chart function;
where the R-chart signals out of control when the process
variance had shifted. They extended their work and pro-
posed an integrated neural network model to detect both
a sudden process mean shift, and variance shift [14]. Al-
so Dedeakayogullari and Burnak [15] developed two
independent ANNs networks, one to detect the process
mean change, and the second to detect the process vari-
ance change. The outputs of these two networks are ana-
lyzed to decide which shift has occurred. Cheng and
Cheng [16] combined the traditional variance charts and
ANN to detect the variance changes sources in a multi-
variate process. The traditional generalized variance
chart works as a variance shift detector. When an out-
of-control signal is generated, a classifier based ANN
will determine which variable is responsible for the va-
riance shift. Chena and Wang [17] developed an artificial
neural network model to supplement the multivariate X2
chart. The method identifies the characteristic or group of
characteristics that cause the signal, and also classifies
the magnitude of the shifts when the X2 statistic signals a
mean shift has occurred.
Guh and Hsieh [18] proposed a neural network model
to identify control chart unnatural patterns and estimate
key parameters of the identified pattern. The model was
intended to identify natural, upward shift, downward
shift, upward trend, downward trend, and cyclic pattern.
Guh [19] developed a hybrid learning-based model,
which integrates ANN and decision tree learning tech-
niques, to detect typical unnatural patterns, while identi-
fying the major parameter (such as the shift displacement
or trend slope) and the starting point of the detected pat-
tern. The model comprises two modules in series, Mod-
ule I and Module II. Module I, comprises a gen-
eral-purpose system that was designed and trained to
Copyright © 2010 SciRes. JSEA
Automated Identification of Basic Control Charts Patterns Using Neural Networks
210
detect various types of unnatural patterns, and imple-
ments a procedure for classifying the actual type of the
detected pattern. Module II is a special-purpose system
that comprises seven specialized networks that are de-
signed and trained to estimate the major parameters of
the unnatural patterns. Similarly [20–24], and [25] util-
ized ANN to develop pattern recognizers that identify the
abnormal control chart patterns.
Of special interest are the works of Cheng [26], Guh et al.
[19], and Gauri and Chakraborty [27]. Cheng [26] de-
veloped a neural network model to detect gradual trends
and sudden shifts in the process mean. The network
structure was consisting of, an input layer consists of 17
nodes (neuron), hidden layer consist of 9 nodes, and
output layer consist of only one node. The output node is
the decision node about the presence of trend or sudden
shift. His work emphasized only the detection (not the
identification) of the present pattern. He evaluated his
network by calculating the average run length and com-
paring with traditional control charts CUSUM and
EWMA.
This paper will focus on the identification of the three
basic patterns of control chart natural, upward shift and
upward trend see Figure 1. A new neural network design
will be discussed and a compatible training algorithm
with the network structure will be selected. Also A new
strategy to design the contents of the training data set
will be introduced to minimize the required training data
set size while improving the network performance.
3. Basic Neural Network Design
An artificial neural network consists mainly of an input
layer, hidden layers, and output layer. Each layer consists
of a set of processing elements or neurons, Figure 2.
Figure 3 represents a single neuron with R-elements
input vector. The individual element inputs p1, p2, p3... pR
are multiplied by weights w1,1, w1,2…w 1,R and the
weighted values are fed to the summing junction. Their
sum is simply Wp, the dot product of the (single row)
matrix W and the vector p. The neuron has a bias b,
which is summed with the weighted inputs Wp to form
the net input n. This sum, n, is the argument of the trans-
fer function f. The structure of the single neuron in Fig-
ure 3 is the same for all the neurons in the network. The
network connection weights and biases are being opti-
mized to learn the network to do its function.
The design of a network for a certain application con-
sists of the determination of the number of hidden layers,
number of neurons in each layer and the type of the
transfer function where there are many types of transfer
functions. The design of a suitable network is not an easy
task, as there are many NN architectures which would
satisfy an intended application [28]. Sagiroglu, Besdok
and Erler [29] emphasized that no systematic method to
Out
p
ut La
y
er
(
3 n
)
1 3
Hidden Layer 3 (25 n)
Hidden La
y
er 1
(
30 n
)
Hidden Layer 2 (25 n)
In
p
ut La
y
er
(
40 n
)
Identified Pattern
Process Data
(
40
p
oints
)
Figure 2. Network structure
p1
Figure 3. A single neuron [31]
select the optimum parameters. Guh [30] used the Ge-
netic Algorithm (GA) to determine the neural networks
configurations and the training parameters instead of
using the trial and error method but in his latest work he
used the selected parameters by trial and error method to
construct his network.
In this research a Multilayer feed forward Neural
Network trained with the back ropagation learning rule is
adopted to develop and train the network. In the literature
the number of the hidden layers ranges between 1 and 2.
Guh and Hsieh [18], Cheng [26], Gauri and Chakraborty
[27] and Assaleh and Al-assaf [21] used only one hidden
layer; Guh et al. [1] and Guh [19] used two hidden layers
in their networks. Guh et al. [1] reported that, networks
with two hidden layers performed better than those with
one hidden layer. In this research 3 hidden layers were
selected because this structure realized a good perform-
ance in a set of preliminary experiments. Also the size of
the network is selected to be large enough to overcome
the over fitting problem, one of the problems that occur
p2
p3
.
.
pR
b
w1,1
1
.
.
ƒ
n a
w1,R
Copyright © 2010 SciRes. JSEA
Automated Identification of Basic Control Charts Patterns Using Neural Networks
Copyright © 2010 SciRes. JSEA
211
was adopted to optimize the network weights. during neural network training is called over fitting [31].
The error on the training set is driven to a very small
value, but when new data is presented to the network the
error is large. The network has memorized the training
examples, but it has not learned to generalize to new sit-
uations. One method for improving network generaliza-
tion is to use a network that is just large enough to pro-
vide an adequate fit. The larger network, the more com-
plex the functions the network can create. Also the num-
ber of neurons in each hidden layer was selected based
on a set of preliminary experiments. Guh et al. [1] also
reported that, as the number of hidden neurons is in-
creased, the learning results are usually improved too. As
shown in Figure 2 the network architecture was selected
to be (40-30-25-25-3). The numbers of the hidden layers
were selected to be 3, the first hidden layer consists of 30
neurons, the second and the third consists of 25 neurons
each; the output layer consists of 3 neurons where each
neuron is assigned for a certain pattern from the three
patterns of interest.
This approach was used by many previous researchers
in this area. The training process is performed by intro-
ducing the training examples to the network; the output
neuron value is compared with a target value, the differ-
ence between the target and the actual values is calcu-
lated and represented by MSE. With the aid of the train-
ing algorithm the network weights should be optimized
to minimize the MSE see Figure 7. This process is re-
peated until a satisfactory MSE value is obtained. So that
a sufficient number of training examples sets are required
to train the neural networks. A Monte-Carlo simulation
approach was adopted by the previous researchers to
generate the training and testing data.
The Monte-Carlo simulation approach was adopted to
generate the basic three control chart patterns (Figure 1)
that may be exhibited by a control chart. The following
equations were used to generate these patterns.
Natural pattern x(t) = µ + n(t) σ (1)
Upward shift pattern x(t) = µ + n(t) σ + d (2)
Upward trend pattern x(t) = µ + n(t) σ + s t(3)
The transfer function is an essential element in neural
networks and has a great effect on their performance. In
the literature the hyperbolic tangent function (tansig) and
sigmoid transfer function (logsig) were adopted by many
researchers in developing their networks. As shown in
Figure 4 the tansig function receives an input and trans-
fers to an output ranges between -1 and 1, and the logsig
function transfers the input to the range 0 and 1. These
two functions work well with the back propagation algo-
rithm because they are differentiable functions and the
back propagation adjusts network weights based on the
MSE function’s gradient which is calculated by the first
partial derivatives of the MSE function. Guh et al. [1]
selected the sigmoid transfer function for the hidden and
output layers, but Gauri and Chakraborty [27] selected
the tansig function for the hidden layers and the logsig
for the output layer. Based on a set of preliminary ex-
periments the sigmoid transfer function was selected for
both the hidden and output layers of the neural network
in this study.
In the above equations x(t) is a random variable fol-
lowing the normal distribution and represents the sample
average value at a certain time t, µ is the natural process
mean, σ is the process standard deviation, and n(t) is the
natural variability element in the process, and follows the
normal distribution with µn = 0 and σn = 1. The term d in
the shift pattern equation represents the positive shift
displacement from the process in control mean. The term
s in the trend pattern equation represents the positive
trend pattern slope. The training data was generated with
µ = 0 and σ = 1 to ensure the generality of the network
for any process parameters.
In this research the identification window size consists
of 40 points, or 40 sampled observations, also this size
represents the size of the training examples. These 40
points actually represents the recently drawn samples
from the process. This size is nearly the average of the
different sizes used in the literature. In practical situa-
tions the process starts in control and then goes out of
control. Cheng [26] recommended training a network
with a mixture of natural and unnatural pattern to avoid
high type II error. Guh et al. [1] and Guh [19] assumed
that the process starts in-control and then goes out-of
control in the practical situations, and generated training
examples have size of 24 points include both in-control
and out of control points. This strategy will allow large
process change to be detected quickly by changing the
start time of the different parameters of the unnatural
patterns. In this study all the unnatural patterns start at
the 26th point in the training examples see Figure 5. All
the shift and trend training examples were generated to
have the first 25 points in control (natural pattern) and
4. Network Training Data Generation
Neural networks can not perform their functions without
training. In this research the supervised learning approach
Log-Sigmoid Transfer Function Tan-Sigmoid Transfer Function
Figure 4. Transfer functions [31]
Automated Identification of Basic Control Charts Patterns Using Neural Networks
212
Upward shift starts at 26th point
-4
-3
-2
-1
0
1
2
3
4
1 357 9111315171921232527293133353739
Sampling time
Sample value
Natural PartShift PartNatural Part
Upward trend starts at 26th point
-4
-3
-2
-1
0
1
2
3
4
1357911 13 1517 19 2123 25 272931 3335 37 39
Sampling time
Sample value
Natural PartTrend Part
Figure 5. Two training examples
the last 15 points are out of control and contain the un-
natural pattern (shift or trend) to simulate the practical
situations. The flowchart of the random patterns genera-
tion routine is given in Appendix A.
The details of the training data set and their related tar-
get values for the output neurons are recorded in Table 1.
The design of the contents of the training data set is
very important and has a great effect on the network
performance. No particular rules to design the appropri-
ate training data set were followed in the literature. Pre-
vious researchers were generating training examples at
multiple parameters for a single pattern to cover a wide
range of the pattern parameters. It was claimed that this
strategy will make the network handle a general problem.
Guh [19] for example, generated the shift pattern training
sets to cover a range of shift magnitudes from 1σ to 3σ.
Nine training sets were generated for the shift pattern
within this range; in increments of 0.25σ. Each set con-
sisted of 90 examples. Similarly 9 training data sets were
generated for the upward trend pattern, each data set
consists of 90 examples. This strategy was adopted near-
ly by all the reviewed work in this area. Training a net-
work with multiple patterns and multiple parameters for
each pattern is expected to make the network confused
and may lead to misclassifying the actual patterns to oth-
er patterns that have similar features and will also make
the learning process more difficult. Based on a set of
preliminary experiments, the misclassification problem
appeared at a certain pattern parameters. For example,
when a network was trained with trend of 0.05σ slope,
and 1σ shift the trend pattern was misclassified as natural
and vice versa. The network confusion happened because
the trend slope is very small and the length of the trend
pattern is also small this make the trend pattern very
similar to the natural. Confusion between the shift and
trend happens when training the network with multiple
trend and shift patterns parameters.
A new training strategy is adopted in this study by us-
ing less training data sets for each single pattern. The
injection of a certain training data sets with lesser num-
ber of parameters may help to solve this problem. In the
above example, when the training data set was only sup-
ported with another trend data set having a slope of 0.1
sigma the classification accuracy was improved over a
wide range of trend slopes. Table 2 presents five alterna-
tive training data sets each set contains a certain pattern
parameters. After investigating these alternatives, classi-
fication accuracy improved by training the network with
the lesser number parameters or with the addition of spe-
cific data set to solve a specific misclassification problem.
In Table 2, Set (5) was the best alternative where it real-
ized small MSE and excellent identification. Thus lesser
Copyright © 2010 SciRes. JSEA
Automated Identification of Basic Control Charts Patterns Using Neural Networks213
number of pattern parameters are recommended to train
the network. To train the network only one shift and two
trend slope parameters were used. Preliminary experi-
ments showed that networks trained by this way perform
better over a wide range of shift and trend parameters.
This approach also will minimize the required time to
train the network; because it requires smaller number and
sizes of training data sets. The selected structure of the
training data set is Set (5). Two hundred training exam-
ples were generated for each pattern parameter within the
selected data set, the sum of all the training examples is
800 which represents the size of the training data set. All
sampled observations within a particular example were
randomly generated from normal distribution, where a
single example consists of 40 observations. All examples
were filtered from runs, since runs can be easily detected
by traditional computational rules without the need for
the ANN algorithm. Any training example consists of 25
points of a natural pattern and the 15 points of a selected
unnatural pattern. All generated observations within any
example from a normal (0, 1) distribution will be filtered
from runs.
The presence of the runs affects the identification
process of the ANN badly. As shown in Figure 6(a) a
run starts at the 29th point in a natural pattern training
example, the run makes the series like shift, in Figure
6(b) the run makes the natural pattern like the trend pat-
tern, in Figures 6(c, d) the shift pattern may be approxi-
mated to trend pattern. Runs could be randomly gener-
ated during the random generation of the different exam-
ples. A simple computational process for runs was ap-
plied to identify two types of runs.
1) If 5 out of 6 points are monotone increasing or de-
creasing;
2) If 5 out of 6 points above or below the mean value.
Once run is detected, the corresponding example is
excluded from the data set. Figure 6 shows generated
training examples have runs.
5. Network Training Process
After preparing the training data set, the network must be
initialized for training. MATLAB 7 Neural Toolbox and
environment were used to develop and train the network.
The training patterns also were generated by MATLAB 7
generator. After initiating the network, the initial connec-
tion weights and biases were initialized by the built-in
Nguyen-Widrow initialization algorithm in MATLAB
[31].
Neural network is trained based on a comparison of
the output and the target, until the network output
matches the desired target (see Figure 7). Typically
many input/target pairs are used, in this supervised
learning approach to train a network. In Figure 7 the
input represents the training examples of the control chart
patterns, output is the obtained output neurons based on
the current values of the weights and biases, and the target
is the desired neurons’ output. As shown in Table 1 each
input pattern has its desired neuron’s output, target value.
The training process is an optimization process in
which the (performance or objective) function is the
Mean Square Error (MSE) and the decision variables are
the connection weights and biases. The target is to mini-
mize the MSE by changing and adjusting the weights and
biases to realize minimum MSE. There are many varia-
tions of the back propagation training algorithm, they
adjust the network weights by making many learning
cycles until the weights and biases reach their optimum
values which realize the minimum MSE. In the literature
the delta rule algorithm was adopted by many researchers
to train their networks. In this study the Resilient Back
propagation algorithm was adopted to train the network.
Table 1. Training data set structure
Output neurons desired output
Pattern Parameters Pattern start timeSize of train-
ing sets neuron1 neuron2 neuron3
Natural µ = 0, σ = 1 - 200 1 0 0
Upward Shift d =1σ 26 200 0 1 0
Upward Trend s = 0.05σ, 0.1σ 26 400 0 0 1
Table 2. Different alternatives training data sets
Training data set structure
Training data set Natural Shift magnitudes Trend slopes
Set(1) µ = 0, σ = 1 1σ, 2σ, 3σ 0.05σ, 0.1σ, 0.3σ, 0.5σ
Set(2) µ = 0, σ = 1 2σ 0.1σ
Set(3) µ = 0, σ = 1 2σ 0.05σ, 0.1σ
Set(4) µ = 0, σ = 1 1σ 0.05σ
Set(5) µ = 0, σ = 1 1σ 0.05σ, 0.1σ
**µ is the process mean and equal 0; and σ is the process standard deviation and equal 1.
Copyright © 2010 SciRes. JSEA
Automated Identification of Basic Control Charts Patterns Using Neural Networks
214
Sampling time
Sam
le value
Natural
-5
-4
-3
-2
-1
0
1
2
3
4
5
135791113 15 1719 21 23 2527 29 3133 35 37 39
Run starts at
29th point
6 consecutive
points and
above the
mean
(a)
Sample value
Natural
-5
-4
-3
-2
-1
0
1
2
3
4
5
1357911 13 15 1719 21 23 25 2729 31 33 35 37 39
Run starts at
33rd point
5 out of 6 points
incr easing
Sampling time
(b)
Sample value
Sampling time
Shift
-5
-4
-3
-2
-1
0
1
2
3
4
5
1 35 7 9111315171921232527293133353739
Run starts at 16th
point
more than 6
consecutive points
above the mean
(c)
Sampling time
Shift
-5
-4
-3
-2
-1
0
1
2
3
4
5
6
1357911 1315 17 19 21 23 25 27 29 3133 35 37 39
Run starts at
20th point
5 out of 6
points are
in
c
r
eas
in
g
Sample value
increasing
(d)
Figure 6. Training examples exhibiting runs
This algorithm was selected to be compatible with the
network structure to eliminate harmful effects of the se-
lected sigmoid functions. Sigmoid functions are charac-
terized by the fact that their slopes must approach zero
Copyright © 2010 SciRes. JSEA
Automated Identification of Basic Control Charts Patterns Using Neural Networks 215
Neural Network including connection
weights between neurons; and biases
Input
Compare
Output
Targets
Adjust weights and biases
Figure 7. Supervised training
as the input gets large, this causes a problem when using
steepest descent to train a multilayer network with sig-
moid functions. The gradient in this case can have a very
small magnitude and, therefore, cause small changes in
the weights and biases, even though the weights and bi-
ases are far from their optimal values. The purpose of the
resilient Back propagation training algorithm is to elimi-
nate these harmful effects of the magnitudes of the partial
derivatives. Only the sign of the derivative is used to
determine the direction of the weight update; the magni-
tude of the derivative has no effect on the weight update.
The network training convergence condition was set to
MSE = 10-40 and the maximum number of learning cy-
cles allowed to reach was set to be 100 epochs. While
network is trained by these parameters, the network con-
verged within 100 epochs as seen in Figure 8 with MSE
= 2.055×10⁻³⁵. The small MSE value was realized by
using less number of pattern parameters to train the net-
work. After training, the network was tested by the
training data set and realized 100% correct identification
for all the patterns.
6. Network Testing and Performance
Evaluation
After training the network, it must be tested and evalu-
ated to measure its effectiveness for use. Probability of
success measure was used by Guo and Dooly [10], Smith
[9], Assaleh and Al-assaf [21], Guh [19], and Gauri and
Chakraborty [27] to evaluate the performance of their
trained neural networks. Probability of success expresses
the percentage of correct identification, and it measures
the capability of the network to detect and classify the
pattern to the target class. In the literature the probability
of success was found under different names such as the
classification rate, the classification accuracy, recogni-
tion rate, and recognition accuracy. In this study the
probability of success term will be used instead of the
previous names. Al-assaf [32] and Guh [19] defined the
Figure 8. Training process output (MSE vs. Epoch number)
classification rate as the number of correctly recognized
examples divided by total number of examples.
To measure the probability of success a new set of da-
ta was randomly generated by using the patterns equa-
tions of Section 4. The trained network is tested at multi-
ple parameters for each pattern to assure the network
generalization for different pattern parameters. A set of
200 testing example was generated for each pattern pa-
rameter. Thus, a set of 200 testing example was gener-
ated for natural pattern; a total of 600 testing example
was generated for shift pattern to test the network at 1σ,
2σ, and 3σ; and a total of 800 testing example was gen-
erated for trend pattern to test the network at slopes of
0.05σ, 0.1σ, 0.3σ, and 0.5σ. As mentioned earlier, each
example consists of 40 points; 25 points of natural pat-
tern followed by 15 points of the tested patterns.
Table 3 exhibits the three target patterns (known by
construction of the testing examples), three possible
identifications patterns, and the percentage of success of
the ANN to identify a given target pattern. Three pattern
Copyright © 2010 SciRes. JSEA
Automated Identification of Basic Control Charts Patterns Using Neural Networks
216
parameters were used for upward shift and 4 parameters
were used for upward trend. Table entries represent the
average percentages of success resulted from testing 10
different randomly generated data sets for a single given
parameter. Table 4 exhibits the percentage mean, stan-
dard deviation, max and min of success of the 10 sam-
pled data sets for each pattern parameter. The fourth
column in Table 3 represents the percentage that the
ANN was unable to make an identification decision. The
following procedure was applied to all generated exam-
ples to obtain Table 3 results.
Step1: Input a testing example to the trained network;
Step2: Find the network output (the three values of the
three output neurons v1, v2, v3); and find maximum out-
put value vmax;
Step3: If vmax >= 0.01, then Identify the present pattern
based on vmax, if vmax comes from the first neuron the
pattern is natural; else if it comes from the second neuron
the pattern is upward shift; else the pattern is upward
trend;
Step4: Else if vmax < 0.01, the present pattern is un-
known.
Results of Table 3 show that the network can perform
well in identifying the three basic patterns of control chart
at a wide range of parameters. Moreover, the variation
between Min and Max percentage of success for replica-
tions of the data sets is minimal which implies robustness
in identification. However, a misclassification problem
happened between the natural and the trend pattern that
has small slope, where 1.8% of the natural testing exam-
ples were miss-classified as upward trend and 1.6% of the
upward trend that has slope 0.05σ was miss-classified as
natural. The misclassification happened because the up-
ward trend at small slopes like 0.05σ is very similar to
natural pattern; also the small pattern length in the testing
examples makes the upward trend very similar to natural.
Figure 9 shows two cases of similarity between natural
and upward trend with slope 0.05σ.
The ANN performance is compared to the reported
results in the literature. The percentage of success results
are compared with Al-assaf [32], Guh [19], and Gauri
and Chakraborty [27] results. Their reported results are
the most recent and appear to be the highest percentage
of success in identifying control chart patterns. Gauri and
Table 3. Average probability of success results based on 10 runs
ANN Identification Percentages
Target
Pattern
Testing
Parameter Natural Upward shift Upward trend Unknown
Natural 98.2 0 1.8 0
1 σ 0 100 0 0
2 σ 0 100 0 0
3 σ 0 100 0 0
Upward shift
Average 0 100 0 0
0.05 σ 1.6 0 98.35 0.05
0.1 σ 0 0.15 99.85 0
0.3 σ 0 0 100 0
0.5 σ 0 0 100 0
Upward trend
Average 0.4 0.038 99.55 0.013
Table 4. Probability of success results summary of the 10 runs
Actual Identification
Target Pattern
Average Standard deviation Max Min
Natural 98.2 0.258 98.5 98
1 σ 100 0 100 100
2 σ 100 0 100 100
Upward shift
3 σ 100 0 100 100
0.05 σ 98.35 0.669 99.5 97
0.1 σ 99.85 0.242 100 99.5
0.3 σ 100 0 100 100
Upward trend
0.5 σ 100 0 100 100
Copyright © 2010 SciRes. JSEA
Automated Identification of Basic Control Charts Patterns Using Neural Networks217
Upward trend with slope 0.05 starts at 26th point
-5
-4
-3
-2
-1
0
1
2
3
4
5
13579111315171921232527293133353739
Sampling time
Sampling value
Natural PartTrend Part
Natural
-5
-4
-3
-2
-1
0
1
2
3
4
5
1 3 57 9111315171921232527293133353739
Sampling time
Sampling value
Figure 9. The similarity between trend pattern and natural at small slopes
Chakraborty [27] developed two feature-based approaches
using heuristics and artificial neural network, which are
capable of recognizing eight control chart patterns. They
compared the results of the neural network with a heuris-
tic approach and stated that the neural network results
were better than heuristic results. Al-assaf [32] used the
probability of success to compare between three ap-
proaches (DC, MRWA, and MRWA + DSC) to detect
and classify the control chart unnatural patterns, his best
results was obtained by using MRWA + DSC, so these
results was used in the comparison. Guh [19] developed
a hybrid learning-based model for on-line detection and
analysis of control chart patterns; he trained a network to
recognize eight control chart patterns and integrated this
network in an algorithm to make it capable for on-line
control chart analysis. In his work, the neural network
testing results were reported based on the probability of
success. Table 5 summarizes the comparison with their
results.
The comparisons indicate that the trained network in
this study is comparable if not superior. It has a good
uniformly identification performance with the three basic
control chart patterns. This proves that changing the
network structure and using a compatible training algo-
rithm with the network structure has a great effect on the
Table 5. Results comparison based on the percentage of
success with the other authors
Pattern Proposed
ANN
Al-Assaf
(2004)
Guh
(2005)
Gauri and
Chakraborty
(2006)
Natural 98.2 88.60 90.59 94.87
Upward
shift 100 93.20 93.33 93.40
Upward
trend 99.55 94.60 95.43 96.53
network performance.
7. Conclusions
This paper investigates a new approach to train a neural
network to detect and identify the basic three control chart
patterns natural, upward shift, and upward trend in addition
to the traditional identification of runs. Instead of using a
large training data set only small one can be used to do the
job. Using a smaller training data set will make the network
training convergence easier and using smaller set of patterns
parameters in the training will eliminate the network to
confusion and misclassification. Also a new network struc-
ture and a compatible training algorithm were suggested to
make the network perform effectively. The results show that
network can perform effectively and the percentage of suc-
Copyright © 2010 SciRes. JSEA
Automated Identification of Basic Control Charts Patterns Using Neural Networks
218
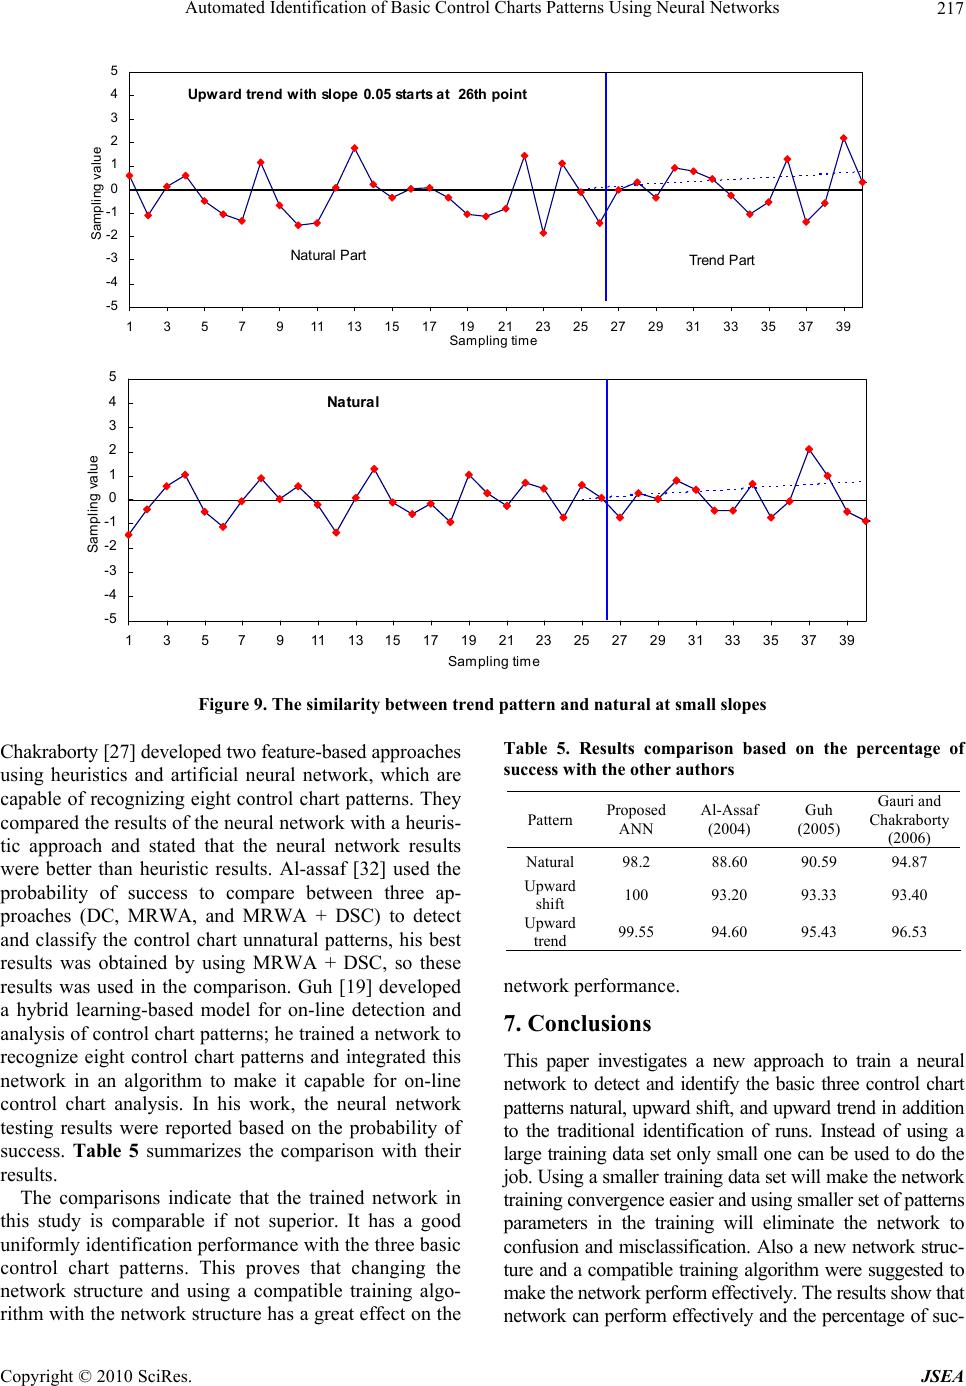
cess to identify a wide range of patterns is high and com-
parable if not superior to the previous reported results.
This proves that changing the network structure and us-
ing a compatible training algorithm with the network
structure has a great effect on the network performance.
REFERENCES
[1] R.-S. Guh, F. Zorriassatine, J. D. T. Tannock, and C. O’
Brien, “On-line control chart pattern detection and
discrimination: A neural network approach,” Articial
Intelligence in Engineering, Vol. 13, pp. 413–425, 1999.
[2] T. L. Lucy-Bouler, “Using autocorrelations, CUSUMs
and runs rules for control chart pattern recognition: An
expert system approach,” PhD dissertation, University of
Alabama, Tuscaloosa, 1991.
[3] C.-S. Cheng and N. F. Hubele, “Design of a knowledge-
based expert system for statistical process control,”
Computers and Industrial Engineering, Vol. 22, No. 4, pp.
501–517, 1992.
[4] J. A. Swift and J. H. Mize, “Out-of-control pattern
recognition and analysis for quality control charts using
Lisp-based systems,” Computers and Industrial Engineer-
ing, Vol. 28, No. 1, pp. 81–91, 1995.
[5] E. L. Grant and R. S. Leavenworth, “Statistical quality
control,” 7th Edition, McGraw-Hill, New York, 1996.
[6] L. S. Nelson, “The Shewhart control chart: Tests for
special causes,” Journal of Quality Technology, Vol. 16,
pp. 237–239, 1984.
[7] Western Electric, “Statistical quality control handbook,”
AT&T, Princeton, 1956.
[8] D. C. Montgomery, “Introduction to statistical quality
control,” 3rd Edition, Wiley, New York, 1996.
[9] A. E. Smith, “X-Bar and R control chart interpretation
using neural computing,” International Journal of
Production Research, Vol. 32, pp. 309–320, 1994.
[10] Y. Guo and K. J. Dooley, “Identification of change
structure in statistical process control,” International
Journal of Production Research, Vol. 30, pp. 1655–1669,
1992.
[11] G. A. Pugh, “Synthetic neural networks for process
control,” Computers and Industrial Engineering, Vol. 17,
pp. 24–26, 1989.
[12] G. A. Pugh, “A comparison of neural networks to SPC
charts,” Computers and Industrial Engineering, Vol. 21,
pp. 253–255, 1991.
[13] S. I. Chang and E. S. HO, “A two-stage neural network
approach for process variance change detection and
classification,” International Journal of Production
Research, Vol. 37, No. 7, pp. 1581–1599, 1999.
[14] S. I. Chang and E. S. Ho, “An integrated neural network
approach for simultaneous monitoring of process mean
and variance shifts a comparative study,” International
Journal of Production Research, Vol. 37, pp. 1881–1901,
1999.
[15] I. Dedeakayogullari and N. Burnak, “Determination of
mean and/or variance shifts with artificial neural net-
works,” International Journal of Production Research.
Vol. 37, No. 10, pp. 2191–2200, 1999.
[16] C.-S. Cheng and H.-P. Cheng, “Identifying the source of
variance shifts in the multivariate process using neural
networks and support vector machines,” Expert Systems
with Applications, Vol. 35, No. 1–2, pp. 198–206, 2008.
[17] L.-H. Chena and T.-Y. Wang, “Artificial neural networks
to classify mean shifts from multivariate X2 chart
signals,” Computers & Industrial Engineering, Vol. 47,
pp. 195–205, 2004.
[18] R.-S. Guh and Y.-C. Hsieh, “A neural network based
model for abnormal pattern recognition of control
charts,” Computers and Industrial Engineering, Vol. 36,
pp. 97–108, 1999.
[19] R.-S. Guh, “A hybrid learning-based model for on-line
detection and analysis of control chart patterns,”
Computers and Industrial Engineering, Vol. 49, pp.
35–62, 2005.
[20] M. B. Perry, J. K. Spoerre, and T. Velasco, “Control chart
pattern recognition using back propagation articial
neural networks,” International Journal of Production
Research, Vol. 39, pp. 3399–3418, 2001.
[21] K. Assaleh and Y. Al-assaf “Features extraction and
analysis for classifying causable patterns in control
charts,” Computers and Industrial Engineering, Vol. 49.
pp. 168–181, 2005.
[22] A. Hassan, M. S. N. Baksh, A. M. Shaharoun, and H.
Jamaluddin, “Improved SPC chart pattern recognition
using statistical features,” International Journal of
Production Research, Vol. 41, No. 7, pp. 1587–1603,
2003.
[23] A. Hassan, M. S. N. Baksh, A. M. Shaharoun, and H.
Jamaluddin, “Feature selection for SPC chart pattern
recognition using fractional factorial experimental
design,” Intelligent Production Machines and System:
2nd I*IPROMS Virtual International Conference, In: D.
T. Pham, E. E. Eldukhri, and A. J. Soroka Ed., Elsevier,
pp. 442–447, 3–14 July 2006.
[24] T. Zan, R.-Y. Fei, and M. Wang, “Research on abnormal
pattern recognition for control chart based on neural
network,” Beijing Gongye Daxue Xuebao, Journal of
Beijing University of Technology, Vol. 32, No. 8, pp.
673–676, 2006.
[25] Z. Chen, S. Lu, and S. Lam, “A hybrid system for SPC
concurrent pattern recognition,” Advanced Engineering
Informatics, Vol. 21, No. 3, pp. 303–310, 2007.
[26] C.-S. Cheng, “A multi-layer neural network model for
detecting changes in the process mean,” Computers and
Industrial Engineering, Vol. 28, No. 1, pp. 51–61, 1995.
[27] S. K. Gauri and S. Chakraborty, “Feature-based reco-
gnition of control chart patterns,” Computers and
Industrial Engineering, Vol. 51, pp. 726–742, 2006.
[28] F. Zorriassatine and J. D. T. Tannock, “A review of
neural networks for statistical process control,” Journal of
Intelligent Manufacturing, Vol. 9, pp. 209–224, 1998.
Copyright © 2010 SciRes. JSEA
Automated Identification of Basic Control Charts Patterns Using Neural Networks
Copyright © 2010 SciRes. JSEA
219
[29] S. Sagiroglu, E. Besdok, and M. Erler, “Control chart
pattern recognition using artificial neural networks,”
Turkish Journal of Electrical Engineering, Vol. 8, No. 2,
pp. 137–147, 2000.
[30] R.-S. Guh, “Optimizing feedforward neural networks for
control chart pattern recognition through genetic
algorithms,” International Journal of Pattern Recognition
and Articial Intelligence, Vol. 18, No. 2, pp. 75–99.
[31] H. Demuth, M. Beale, and M. Hagan “Neural network
toolbox user’s guide,” Math Works, Natick, MA, 2009.
[32] Y. Al-Assaf, “Recognition of control chart patterns using
multi-resolution wavelets analysis and neural networks,”
Computers and Industrial Engineering, Vol. 47, pp.
17–29, 2004.
Automated Identification of Basic Control Charts Patterns Using Neural Networks
220
Appendix A
Pattern generation detailed flowchart
Start
Input values of ,
XX
Shift Pattern
Input shift magnitude (d)
start position (T)
Input required no. of exam-
ples (m)
Generate another matrix X2 (m ×
(n-T))
2(, )(,)
XX
xijNd

Generate a matrix X1(m × T)
where 1(,)(,)
XX
xij N

Combine X1 and X2 to
form a matrix (m × n)
Input required pattern length (n)
Save the matrix in the
data file(DF)
No
Yes
Trend Pattern
Input trend slope (s) and
start position (T)
Input required no. of exam-
ples (m)
Generate a matrix X3(m × T)
3(,)(,)
XX
xij N

t = 1
t <= (n-T)
Generate a vector x4{t} has a size
(m×1)
4{}(, )(,)
XX
xtij Nst

t = t +1
Combine the vectors
X4 = x4{t = 1 :( n – T)}
Combine X3 and X4
Save the matrix in the data file(DF)
Natural Pattern
Input required no. of
examples (m)
Generate a matrix (m × n) of
random variables; each element
comes from normal distribution
(, )
XX
N

Save the matrix in the data
file(DF)
Copyright © 2010 SciRes. JSEA