Paper Menu >>
Journal Menu >>
 Journal of Environmental Protection, 2010, 1, 41-52 doi:10.4236/jep.2010.11006 Published Online March 2010 (http://www.SciRP.org/journal/jep) Copyright © 2010 SciRes JEP 1 Modeling of Climatic Parameters and Determination of Climatic Differences in the City of Elazig-Turkey and its Close Regions Sinan Akpinar1, Ebru Kavak Akpinar2* 1Physics Department, Firat University, Elazig, Turkey; 2Department of Mechanical Engineering, Firat University, Elazig, Turkey. Email: ebruakpinar@firat.edu.tr, kavakebru@hotmail.com Received December 27th, 2009; revised January 22nd, 2010; accepted January 22nd, 2010. ABSTRACT This study deals with the climatic parameters and the climatic differences in Elazig and its close regions (cities of Malatya, Tunceli, Bingöl, Erzincan). Data on mean monthly temperature, daily maximum-minimum temperature, rela- tive humidity, pressure, wind speed, rainfall, solar radiation and sunshine duration were analyzed and modeled for 10-year period, from 1994 to 2003. Malatya city was the hottest area whole period, while the Erzincan city was the coldest area. Maximum temperatures were at highest values in Tunceli. Minimum temperatures reached the warmest values in the Malatya. Erzincan city was the most hu mid area almo st thro ugh out th e period while Ma latya was the lea st humid area. Wind speed reached the highest values in the Elazig and the lowest values in the Tunceli. Pressure reached the highest values in the Malatya and the lowest values in the Erzincan. Direct solar radiation reached the highest val- ues in the Tunceli and the lowest values in the Erzincan. Sunshine duration reached the highest values in the Malatya and the lowest values in the Erzincan. A regression analysis was carried out by using the linear regression technique to model the climatic parameters. The models developed can be used in any study related to climatic and its effect on the environment and energy. The models developed in this study can be used for future predictions of the climatic parame- ters and analysing the en vironmental and energy related issues in Elazig and its close reg ions (cities of Malatya, Tun- celi, Bingöl, Erzincan). Keywords: Energy, Environment, Elazig, Erzincan, Malatya, Tunceli, Bingöl-Turkey, Relative Humidity, Solar Radiation, Sunshine Duration, Temperature, Weather Parameters, Wind Speed 1. Introduction Energy is one of the precious resources in the world. En- ergy conservation becomes a hot topic around people, not just for deferring the depletion date of fossil fuel but also concerning the environmental impact due to energy con- sumption [1]. Performance of environment-related sys- tems, such as heating, cooling, ventilating and air-condi- tioning of buildings (HVAC systems), solar collectors, solar cells, greenhouses, power plants and cooling towers, are dependent on weather variables like solar radiation, dry-bulb temperature, wet-bulb temperature, humidity, wind speed, etc. In order to calculate the performance of an existing system or to predict the energy consumption of a system in design step, the researcher/designer needs appropriate weather data [2]. A number of studies are found in the literature dealing with the weather characteristics, solar and wind energy related issues for different region of the World. Global solar irradiation (GSI) had been estimated in a number of studies by the known climatic parameters of bright sun- shine duration [3,4], cloud fraction [5,6], air temperature range [7], precipitation status [8], both temperature and rainfall [9] and both sunshine duration and cloud [10,11], trends to years of the weather parameters such as tem- perature, relative humidity, wind speed, dust and fog [12]. Climatic differences between urban and suburban have been studied by many other authors [13–19]. The main objective of the present study is 1) to investigate the climatic differences between Elazig city and its close regions, cities of Malatya, Tun- celi, Bingöl, Erzincan, for 10-year period, from 1994 to 2003. 2) to discuss the climatic parameters (such as tem- perature, relative humidity, wind speed, pressure, solar radiation, and sunshine duration) in the Elazig city and its close regions using the linear regression model. 2. Material and Methods 2.1 Features of Study Area City of Elazig (longitude; 38º 40’, latitude; 39º 14’, ele- vation of 991 m), Malatya (longitude; 38º 21’, latitude; 38º 19’, elevation of 898 m), Tunceli (longitude; 39º 07’,  42 Modeling of Climatic Parameters and Determination of Climatic Differences in the City of Elazig-Turkey and its Close Regions Copyright © 2010 SciRes JEP latitude; 39º 33’ elevation of 980 m), Bingöl (longitude; 38º 53’, latitude; 40º 29’, elevation of 1177 m) and Erz- incan (longitude; 39º 45’, latitude; 39º 30’, elevation of 1218 m) is situated in east Anatolia region of Turkey. City of Elazig, Malatya, Tunceli, Bingöl and Erzincan has a typical highland climate, in that it is generally cold in winter and hot in summer and there are considerable temperature differences between day and night. Location of Elazig, Malatya, Tunceli, Bingöl and Erzincan city can be shown from Figure 1. The mean monthly temperature, daily maximum–minimum temperature, relative humidity, pressure, wind speed, solar radiation and sunshine dura- tion were the measured meteorological parameters of this research. The measurements have been carried out by conventional meteorological instruments by the Turkish Meteorological State Department (TMSD). 2.2 Modelling of Climatic Parameters Statistical techniques of regression models are frequently used to study a set of experimental data. Adequacy and validity of the model is performed to determine if the model will function in a successful manner in its in- tended operating field. Linear regression analysis is a statistical tool by which a line is fitted through a set of experimental data using the least-squares method. Regression is used in a wide variety of applications in order to analyze how a single dependent variable is affected by the values of one or more independent variables. In this study, temperature, relative humidity, wind speed, pressure, solar radiation and sunshine duration collected for a period of 10 years (1994–2003) is modelled using linear regression analysis with 95% confidence level. For the purpose of checking the adequacy of the mod- els developed in this study, residual analysis was adopted. It is important to examine plots of residuals versus the corresponding predicted values of weather parameters to detect common patterns such as horizontal bands, out- ward openings, double bows, and curved bands [12]. The Figure 1. Location of city of Elazig, Erzincan, Tunceli, Malatya and Bingöl in Turkey desirable pattern for a good model is one in which the residuals are contained within a horizontal band. Model validation is also essential for model building, since a model that fits the data well may not work well for pre- dictions. 3. Results From the data obtained over a 10-year period between 1994 and 2003, the results of study were summarized at Table 1, results are as following: 3.1 The Differences in the Mean Monthly Temperatures From Figure 2, it can be seen that there was an evident difference at mean monthly temperatures between the investigated cities. Mean monthly temperatures was showed changing between 0.6 and 27.5°C for Elazig city, –0.9 and 24.7°C for Erzincan city, 0.3 and 27.8°C for Tunceli city, 1.6 and 27.9°C for Malatya city, –0.7 and 27.1°C for Bingöl city. The overall average temperature for 10 years was found to be about 13.19°C for Elazig, 11.50°C for Erzincan, 13.75°C for Tunceli, 14.14°C for Malatya, 12.56°C for Bingöl. While the Erzincan city was the coldest area whole period, Malatya city was the hottest area whole period. However, Malatya was warmer than Tunceli, Elazig and Bingöl in terms of av- erages, respectively. Mean monthly temperatures of city of Elazig, Tunceli and Bingöl were showed changing at the close values to each other for month of April, May, June, July, August, September, October, November. The highest difference in mean temperature between Elazig and Malatya, Elazig and Tunceli, Elazig and Bingol, Elazig and Erzincan was 1.5°C at September, –0.6°C at December, –1.6 °C at February and –2.8°C at July, re- spectively. The lowest difference in mean temperature between Elazig and Malatya, Elazig and Tunceli, Elazig and Bingol, Elazig and Erzincan was 0.3°C at December, 0.1°C at March and April, –0.1°C at August, September, November, May, June and –0.6°C at April, respectively. There was a mean temperature difference of 0.96, 0.083, –0.63 and –1.56°C between Elazig and Malatya, Elazig and Tunceli, Elazig and Bingol, Elazig and Erzincan, respectively (Table 1). These data can be seen that mean monthly temperatures of Elazig was about equal to mean monthly temperatures of Tunceli. 3.2 The Differences in Maximum Temperatures From Figure 3, maximum temperatures were at highest values in Tunceli, followed by Malatya, Elazig, Bingöl and Erzincan. Mean maximum monthly temperatures was showed changing between 4.3 and 34.8°C for Elazig city, 3.9 and 32.4 °C for Erzincan city, 4.8 and 35.3°C for Tunceli city, 5.2 and 34.4°C for Malatya city, 3.7 and 35.1°C for Bingöl city. While maximum temperatures 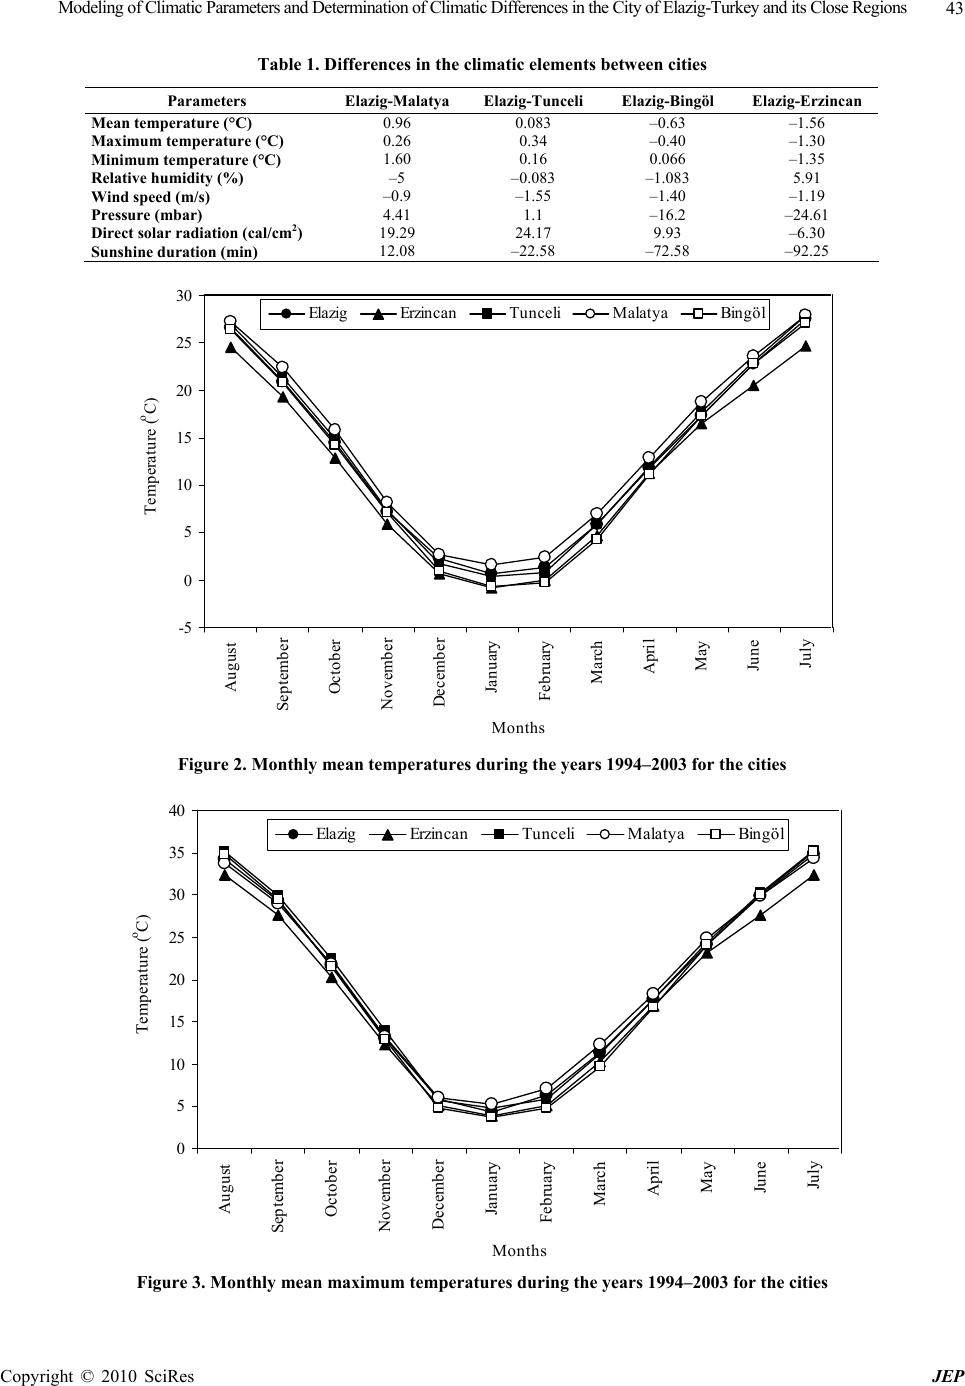 Modeling of Climatic Parameters and Determination of Climatic Differences in the City of Elazig-Turkey and its Close Regions Copyright © 2010 SciRes JEP 43 Table 1. Differences in the climatic elements between cities Parameters Elazig-Malatya Elazig-Tunceli Elazig-Bingöl Elazig-Erzincan Mean temperature (°C) 0.96 0.083 –0.63 –1.56 Maximum temperature (°C) 0.26 0.34 –0.40 –1.30 Minimum temperature (°C) 1.60 0.16 0.066 –1.35 Relative humidity (%) –5 –0.083 –1.083 5.91 Wind speed (m/s) –0.9 –1.55 –1.40 –1.19 Pressure (mbar) 4.41 1.1 –16.2 –24.61 Direct solar radiation (cal/cm2) 19.29 24.17 9.93 –6.30 Sunshine duration (min) 12.08 –22.58 –72.58 –92.25 -5 0 5 10 15 20 25 30 August Sept e mber October November December January February March April May Ju ne Ju l y Months Temperature ( o C) Elazig Erzincan Tunceli Malatya Bingöl Figure 2. Monthly mean temperatures during the years 1994–2003 for the cities 0 5 10 15 20 25 30 35 40 August Sept em ber October November December January Fe bruary March April May June July Months Temperature ( o C) Elazig Erzincan Tunceli Malatya Bingöl Figure 3. Monthly mean maximum temperatures during the years 1994–2003 for the cities 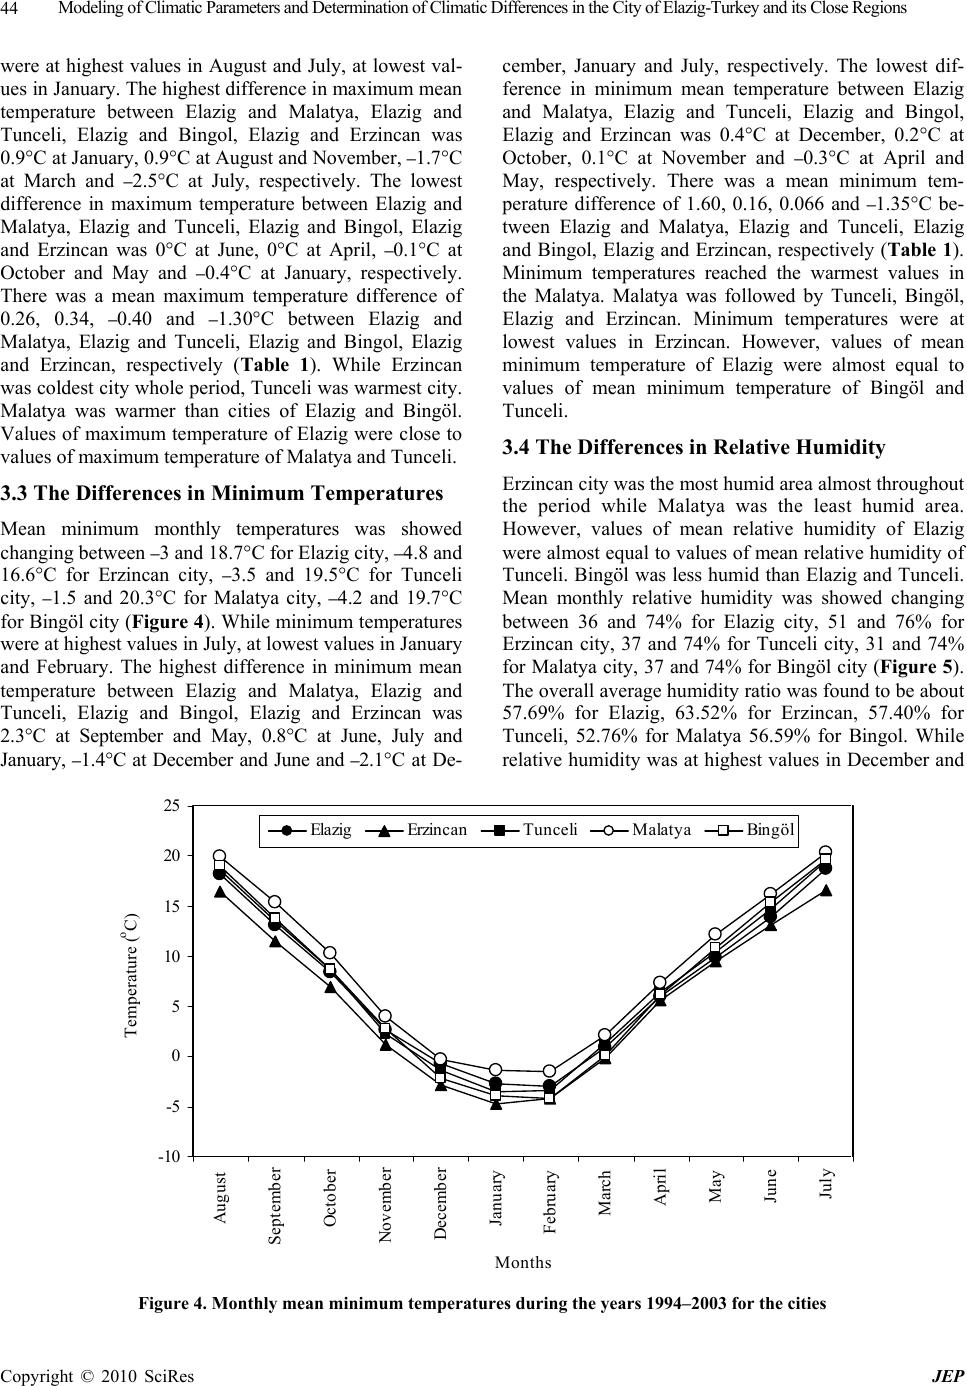 Modeling of Climatic Parameters and Determination of Climatic Differences in the City of Elazig-Turkey and its Close Regions Copyright © 2010 SciRes JEP 44 were at highest values in August and July, at lowest val- ues in January. The highest difference in maximum mean temperature between Elazig and Malatya, Elazig and Tunceli, Elazig and Bingol, Elazig and Erzincan was 0.9°C at January, 0.9°C at August and November, –1.7°C at March and –2.5°C at July, respectively. The lowest difference in maximum temperature between Elazig and Malatya, Elazig and Tunceli, Elazig and Bingol, Elazig and Erzincan was 0°C at June, 0°C at April, –0.1°C at October and May and –0.4°C at January, respectively. There was a mean maximum temperature difference of 0.26, 0.34, –0.40 and –1.30°C between Elazig and Malatya, Elazig and Tunceli, Elazig and Bingol, Elazig and Erzincan, respectively (Table 1). While Erzincan was coldest city whole period, Tunceli was warmest city. Malatya was warmer than cities of Elazig and Bingöl. Values of maximum temperature of Elazig were close to values of maximum temperature of Malatya and Tunceli. 3.3 The Differences in Minimum Temperatures Mean minimum monthly temperatures was showed changing between –3 and 18.7°C for Elazig city, –4.8 and 16.6°C for Erzincan city, –3.5 and 19.5°C for Tunceli city, –1.5 and 20.3°C for Malatya city, –4.2 and 19.7°C for Bingöl city (Figure 4). While minimum temperatures were at highest values in July, at lowest values in January and February. The highest difference in minimum mean temperature between Elazig and Malatya, Elazig and Tunceli, Elazig and Bingol, Elazig and Erzincan was 2.3°C at September and May, 0.8°C at June, July and January, –1.4°C at December and June and –2.1°C at De- cember, January and July, respectively. The lowest dif- ference in minimum mean temperature between Elazig and Malatya, Elazig and Tunceli, Elazig and Bingol, Elazig and Erzincan was 0.4°C at December, 0.2°C at October, 0.1°C at November and –0.3°C at April and May, respectively. There was a mean minimum tem- perature difference of 1.60, 0.16, 0.066 and –1.35°C be- tween Elazig and Malatya, Elazig and Tunceli, Elazig and Bingol, Elazig and Erzincan, respectively (Table 1). Minimum temperatures reached the warmest values in the Malatya. Malatya was followed by Tunceli, Bingöl, Elazig and Erzincan. Minimum temperatures were at lowest values in Erzincan. However, values of mean minimum temperature of Elazig were almost equal to values of mean minimum temperature of Bingöl and Tunceli. 3.4 The Differences in Relative Humidity Erzincan city was the most humid area almost throughout the period while Malatya was the least humid area. However, values of mean relative humidity of Elazig were almost equal to values of mean relative humidity of Tunceli. Bingöl was less humid than Elazig and Tunceli. Mean monthly relative humidity was showed changing between 36 and 74% for Elazig city, 51 and 76% for Erzincan city, 37 and 74% for Tunceli city, 31 and 74% for Malatya city, 37 and 74% for Bingöl city (Figure 5). The overall average humidity ratio was found to be about 57.69% for Elazig, 63.52% for Erzincan, 57.40% for Tunceli, 52.76% for Malatya 56.59% for Bingol. While relative humidity was at highest values in December and -10 -5 0 5 10 15 20 25 Augus t September October Novembe r Decembe r January February March April May June July Months Temperature ( o C) Elazig Erzincan Tunceli Malatya Bingöl Figure 4. Monthly mean minimum temperatures during the years 1994–2003 for the cities 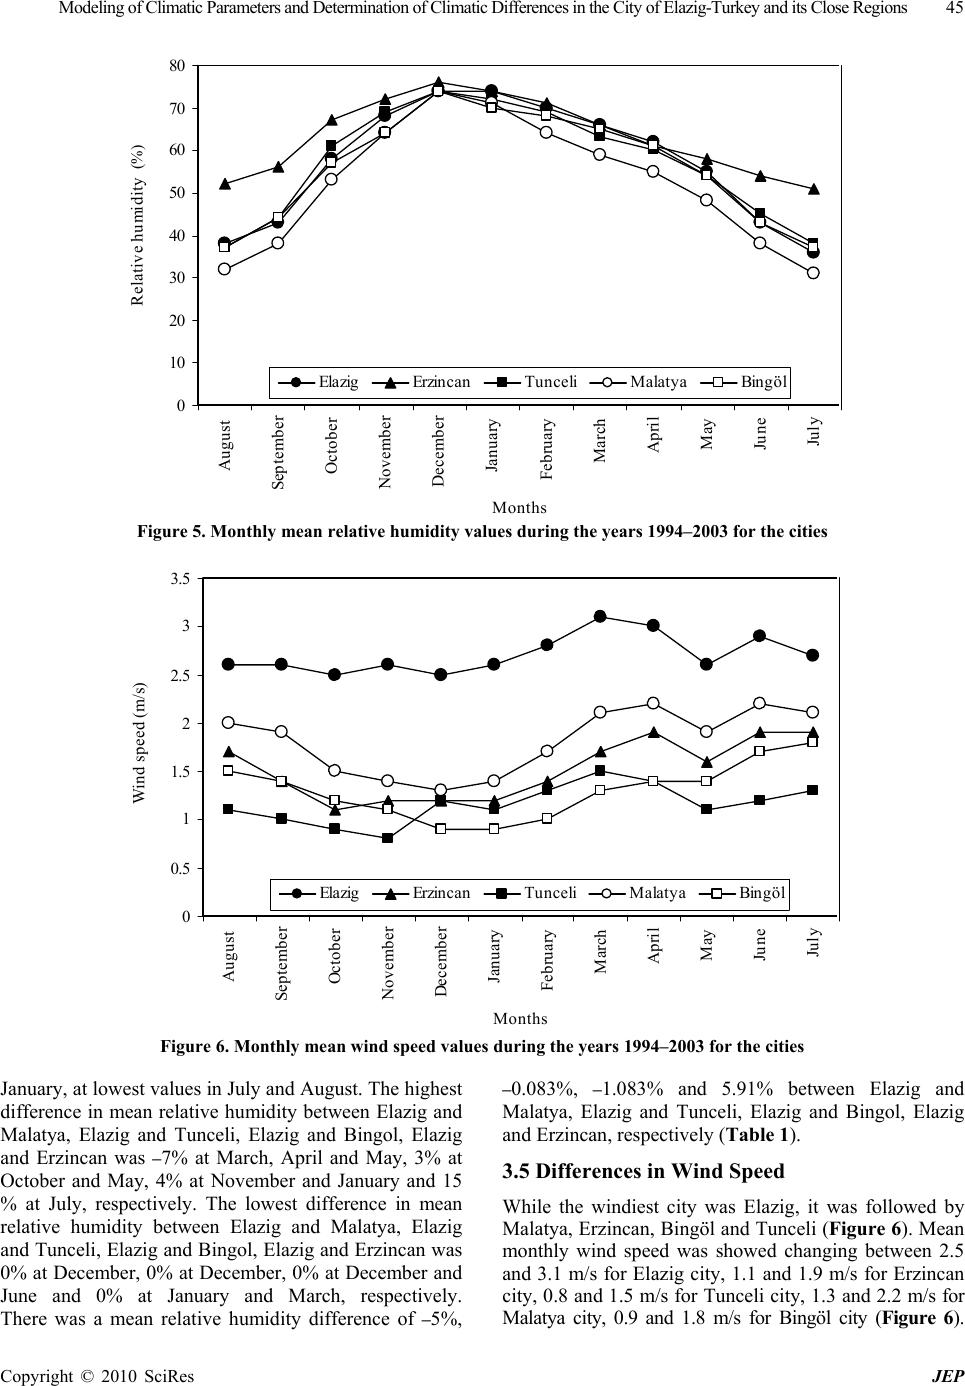 Modeling of Climatic Parameters and Determination of Climatic Differences in the City of Elazig-Turkey and its Close Regions 45 Copyright © 2010 SciRes JEP 0 10 20 30 40 50 60 70 80 August September October November December January February March April May June July Months Relative humidity (% Elazig Erzincan Tunceli Malatya Bingöl (%) Figure 5. Monthly mean relative humidity values during the years 1994–2003 for the cities 0 0.5 1 1.5 2 2.5 3 3.5 August September October November December January February March April May June July Months Wind speed (m/s) Elazig Erzincan Tunceli Malatya Bingöl Figure 6. Monthly mean wind speed values during the years 1994–2003 for the cities January, at lowest values in July and August. The highest difference in mean relative humidity between Elazig and Malatya, Elazig and Tunceli, Elazig and Bingol, Elazig and Erzincan was –7% at March, April and May, 3% at October and May, 4% at November and January and 15 % at July, respectively. The lowest difference in mean relative humidity between Elazig and Malatya, Elazig and Tunceli, Elazig and Bingol, Elazig and Erzincan was 0% at December, 0% at December, 0% at December and June and 0% at January and March, respectively. There was a mean relative humidity difference of –5%, –0.083%, –1.083% and 5.91% between Elazig and Malatya, Elazig and Tunceli, Elazig and Bingol, Elazig and Erzincan, respectively (Table 1). 3.5 Differences in Wind Speed While the windiest city was Elazig, it was followed by Malatya, Erzincan, Bingöl and Tunceli (Figure 6). Mean monthly wind speed was showed changing between 2.5 and 3.1 m/s for Elazig city, 1.1 and 1.9 m/s for Erzincan city, 0.8 and 1.5 m/s for Tunceli city, 1.3 and 2.2 m/s for Malatya city, 0.9 and 1.8 m/s for Bingöl city (Figure 6). 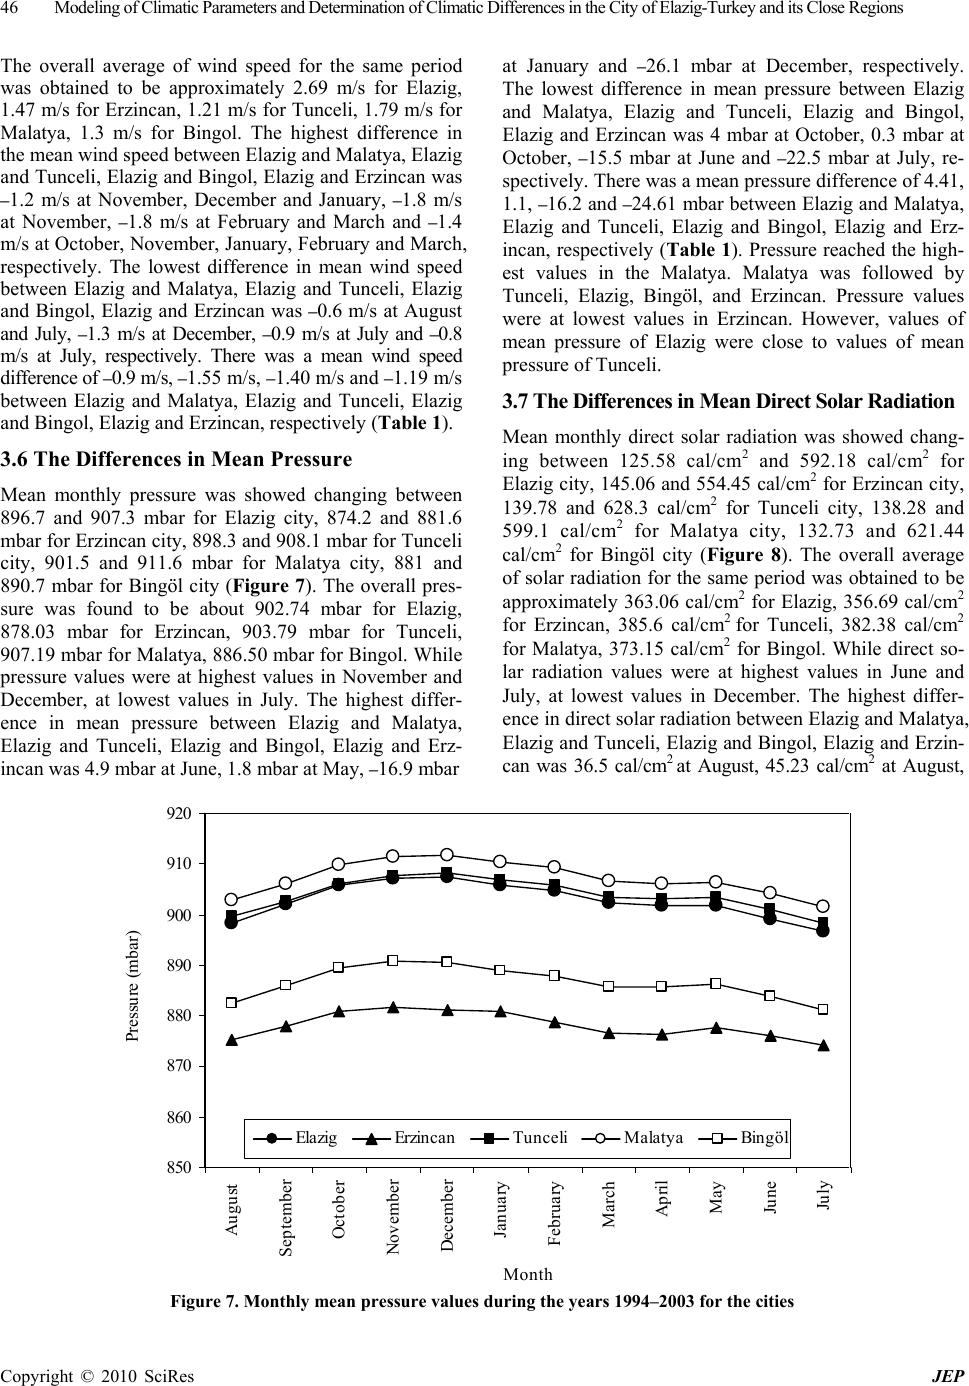 46 Modeling of Climatic Parameters and Determination of Climatic Differences in the City of Elazig-Turkey and its Close Regions Copyright © 2010 SciRes JEP The overall average of wind speed for the same period was obtained to be approximately 2.69 m/s for Elazig, 1.47 m/s for Erzincan, 1.21 m/s for Tunceli, 1.79 m/s for Malatya, 1.3 m/s for Bingol. The highest difference in the mean wind speed between Elazig and Malatya, Elazig and Tunceli, Elazig and Bingol, Elazig and Erzincan was –1.2 m/s at November, December and January, –1.8 m/s at November, –1.8 m/s at February and March and –1.4 m/s at October, November, January, February and March, respectively. The lowest difference in mean wind speed between Elazig and Malatya, Elazig and Tunceli, Elazig and Bingol, Elazig and Erzincan was –0.6 m/s at August and July, –1.3 m/s at December, –0.9 m/s at July and –0.8 m/s at July, respectively. There was a mean wind speed difference of –0.9 m/s, –1.55 m/s, –1.40 m/s and –1.19 m/s between Elazig and Malatya, Elazig and Tunceli, Elazig and Bingol, Elazig and Erzincan, respectively (Table 1). 3.6 The Differences in Mean Pressure Mean monthly pressure was showed changing between 896.7 and 907.3 mbar for Elazig city, 874.2 and 881.6 mbar for Erzincan city, 898.3 and 908.1 mbar for Tunceli city, 901.5 and 911.6 mbar for Malatya city, 881 and 890.7 mbar for Bingöl city (Figure 7). The overall pres- sure was found to be about 902.74 mbar for Elazig, 878.03 mbar for Erzincan, 903.79 mbar for Tunceli, 907.19 mbar for Malatya, 886.50 mbar for Bingol. While pressure values were at highest values in November and December, at lowest values in July. The highest differ- ence in mean pressure between Elazig and Malatya, Elazig and Tunceli, Elazig and Bingol, Elazig and Erz- incan was 4.9 mbar at June, 1.8 mbar at May, –16.9 mbar at January and –26.1 mbar at December, respectively. The lowest difference in mean pressure between Elazig and Malatya, Elazig and Tunceli, Elazig and Bingol, Elazig and Erzincan was 4 mbar at October, 0.3 mbar at October, –15.5 mbar at June and –22.5 mbar at July, re- spectively. There was a mean pressure difference of 4.41, 1.1, –16.2 and –24.61 mbar between Elazig and Malatya, Elazig and Tunceli, Elazig and Bingol, Elazig and Erz- incan, respectively (Table 1). Pressure reached the high- est values in the Malatya. Malatya was followed by Tunceli, Elazig, Bingöl, and Erzincan. Pressure values were at lowest values in Erzincan. However, values of mean pressure of Elazig were close to values of mean pressure of Tunceli. 3.7 The Differences in Mean Direct Solar Radiation Mean monthly direct solar radiation was showed chang- ing between 125.58 cal/cm2 and 592.18 cal/cm2 for Elazig city, 145.06 and 554.45 cal/cm2 for Erzincan city, 139.78 and 628.3 cal/cm2 for Tunceli city, 138.28 and 599.1 cal/cm2 for Malatya city, 132.73 and 621.44 cal/cm2 for Bingöl city (Figure 8). The overall average of solar radiation for the same period was obtained to be approximately 363.06 cal/cm2 for Elazig, 356.69 cal/cm2 for Erzincan, 385.6 cal/cm2 for Tunceli, 382.38 cal/cm2 for Malatya, 373.15 cal/cm2 for Bingol. While direct so- lar radiation values were at highest values in June and July, at lowest values in December. The highest differ- ence in direct solar radiation between Elazig and Malatya, Elazig and Tunceli, Elazig and Bingol, Elazig and Erzin- can was 36.5 cal/cm2 at August, 45.23 cal/cm2 at August, 850 860 870 880 890 900 910 920 Au gust Se pt e mbe r October November December January February March Apri l May June July Month Pressure (mbar) Elazig ErzincanTunceli Malatya Bingöl Figure 7. Monthly mean pressure values during the years 1994–2003 for the cities 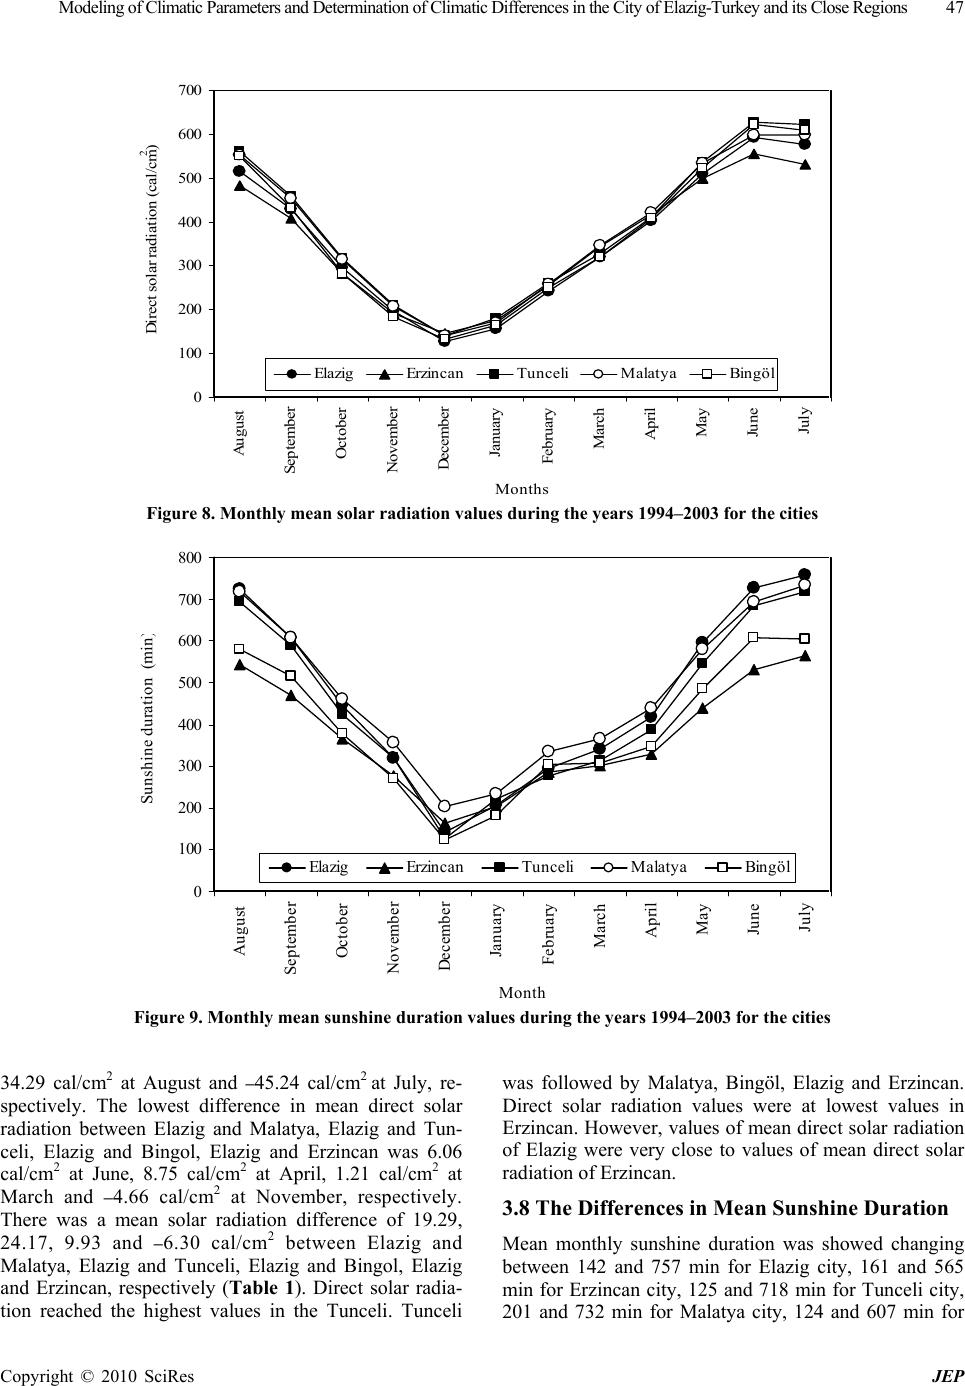 Modeling of Climatic Parameters and Determination of Climatic Differences in the City of Elazig-Turkey and its Close Regions 47 Copyright © 2010 SciRes JEP 0 100 200 300 400 500 600 700 August September October November December January Fe b r uar y March April May Ju n e July Months Direct solar radiation (cal/cm 2 ) Elazig Erzincan Tunceli Malatya Bingöl Figure 8. Monthly mean solar radiation values during the years 1994–2003 for the cities 0 100 200 300 400 500 600 700 800 August September October November December January Fe bruary March April May Ju ne Ju ly Month Sunshine duration (min ) Elazig Erzincan Tunceli Malatya Bingöl Figure 9. Monthly mean sunshine duration values during the years 1994–2003 for the cities 34.29 cal/cm2 at August and –45.24 cal/cm2 at July, re- spectively. The lowest difference in mean direct solar radiation between Elazig and Malatya, Elazig and Tun- celi, Elazig and Bingol, Elazig and Erzincan was 6.06 cal/cm2 at June, 8.75 cal/cm2 at April, 1.21 cal/cm2 at March and –4.66 cal/cm2 at November, respectively. There was a mean solar radiation difference of 19.29, 24.17, 9.93 and –6.30 cal/cm2 between Elazig and Malatya, Elazig and Tunceli, Elazig and Bingol, Elazig and Erzincan, respectively (Table 1). Direct solar radia- tion reached the highest values in the Tunceli. Tunceli was followed by Malatya, Bingöl, Elazig and Erzincan. Direct solar radiation values were at lowest values in Erzincan. However, values of mean direct solar radiation of Elazig were very close to values of mean direct solar radiation of Erzincan. 3.8 The Differences in Mean Sunshine Duration Mean monthly sunshine duration was showed changing between 142 and 757 min for Elazig city, 161 and 565 min for Erzincan city, 125 and 718 min for Tunceli city, 201 and 732 min for Malatya city, 124 and 607 min for 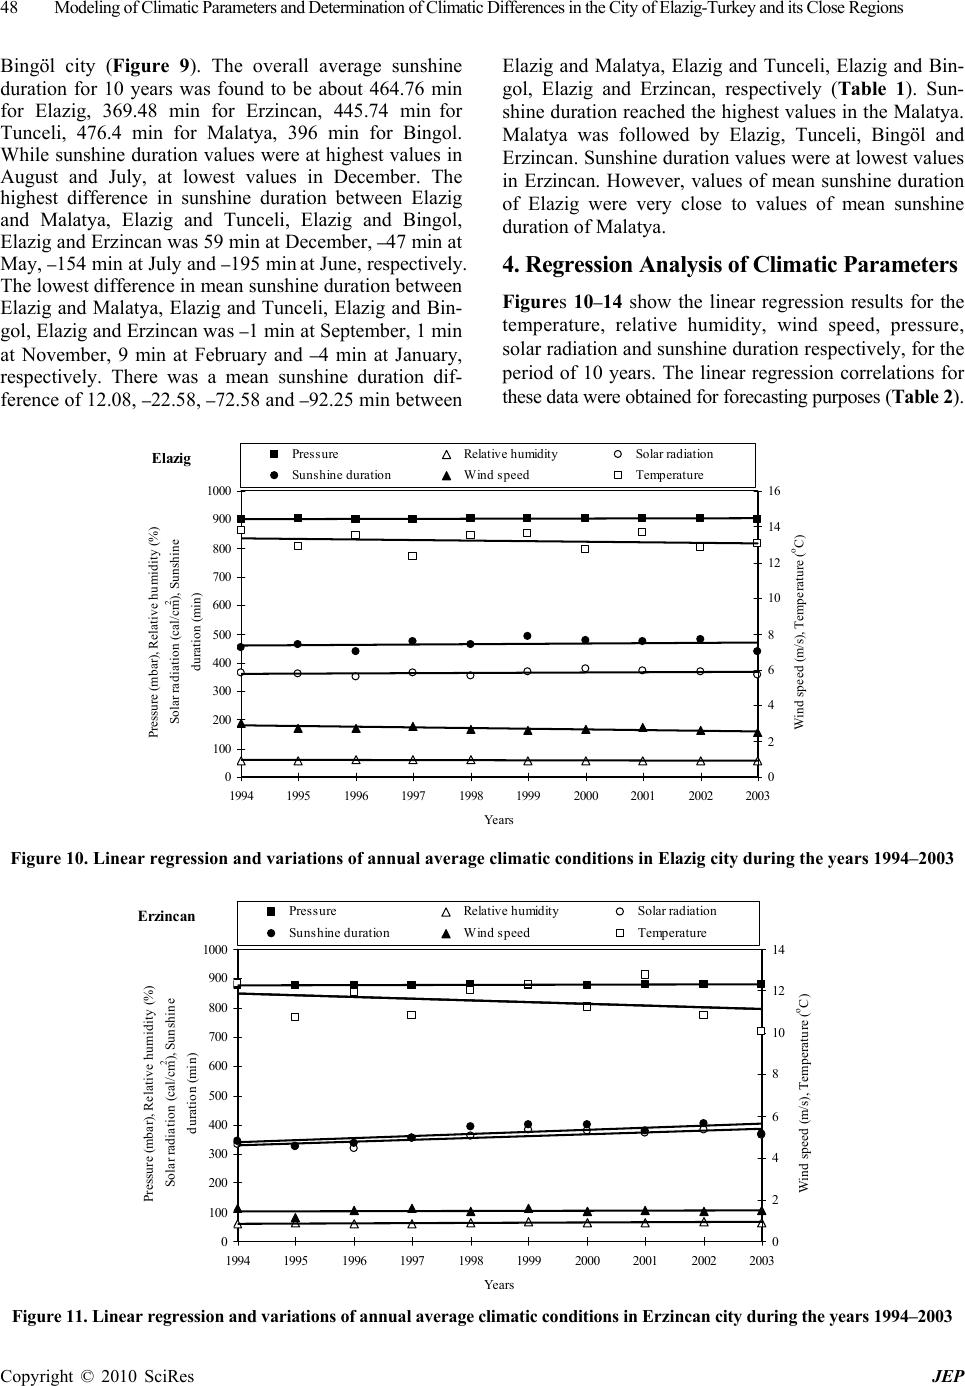 48 Modeling of Climatic Parameters and Determination of Climatic Differences in the City of Elazig-Turkey and its Close Regions Copyright © 2010 SciRes JEP Bingöl city (Figure 9). The overall average sunshine duration for 10 years was found to be about 464.76 min for Elazig, 369.48 min for Erzincan, 445.74 min for Tunceli, 476.4 min for Malatya, 396 min for Bingol. While sunshine duration values were at highest values in August and July, at lowest values in December. The highest difference in sunshine duration between Elazig and Malatya, Elazig and Tunceli, Elazig and Bingol, Elazig and Erzincan was 59 min at December, –47 min at May, –154 min at July and –195 min at June, respectively. The lowest difference in mean sunshine duration between Elazig and Malatya, Elazig and Tunceli, Elazig and Bin- gol, Elazig and Erzincan was –1 min at September, 1 min at November, 9 min at February and –4 min at January, respectively. There was a mean sunshine duration dif- ference of 12.08, –22.58, –72.58 and –92.25 min between Elazig and Malatya, Elazig and Tunceli, Elazig and Bin- gol, Elazig and Erzincan, respectively (Table 1). Sun- shine duration reached the highest values in the Malatya. Malatya was followed by Elazig, Tunceli, Bingöl and Erzincan. Sunshine duration values were at lowest values in Erzincan. However, values of mean sunshine duration of Elazig were very close to values of mean sunshine duration of Malatya. 4. Regression Analysis of Climatic Parameters Figures 10–14 show the linear regression results for the temperature, relative humidity, wind speed, pressure, solar radiation and sunshine duration respectively, for the period of 10 years. The linear regression correlations for these data were obtained for forecasting purposes (Table 2). Elazig 0 100 200 300 400 500 600 700 800 900 1000 1994 19951996 19971998 19992000 20012002 2003 Years Pressure (mbar), Relative humidity (%) Solar radiation (cal/cm 2 ), Sunshine duration (min) 0 2 4 6 8 10 12 14 16 Wind speed (m/s), Temperature ( o C) Pressure Relative humidity Solar radiation Sunshine duration Wind speed Temperature Figure 10. Linear regression and variations of annual average climatic conditions in Elazig city during the years 1994–2003 Erzincan 0 100 200 300 400 500 600 700 800 900 1000 1994 19951996 19971998 19992000 20012002 2003 Years Pressure (mbar), Relative humidity (%) Solar radiation (cal/cm 2 ), Sunshine duration (min) 0 2 4 6 8 10 12 14 Wind speed (m/s), Temperature ( o C) Pressure Relative humidity Solar radiation Sunshine duration Wind speed Temperature Figure 11. Linear regression and variations of annual average climatic conditions in Erzincan city during the years 1994–2003 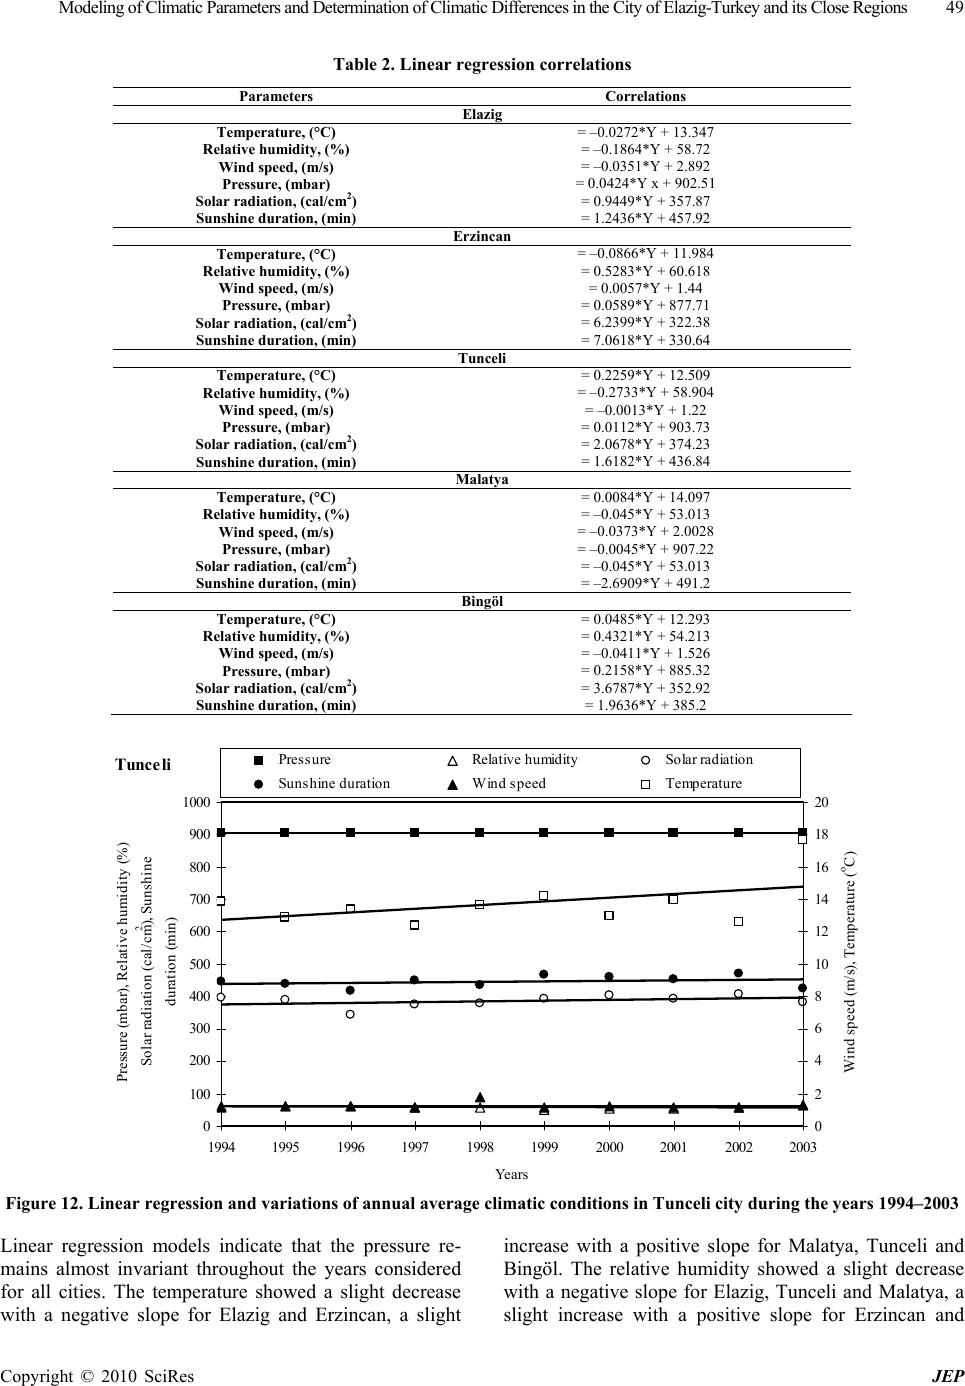 Modeling of Climatic Parameters and Determination of Climatic Differences in the City of Elazig-Turkey and its Close Regions 49 Copyright © 2010 SciRes JEP Table 2. Linear regression correlations Parameters Correlations Elazig Temperature, (°C) = –0.0272*Y + 13.347 Relative humidity, (%) = –0.1864*Y + 58.72 Wind speed, (m /s) = –0.0351*Y + 2.892 Pressure, (mbar) = 0.0424*Y x + 902.51 Solar radi ation, (cal/cm2) = 0.9449*Y + 357.87 Sunshine duration, (min) = 1.2436*Y + 457.92 Erzincan Temperature, (°C) = –0.0866*Y + 11.984 Relative humidity, (%) = 0.5283*Y + 60.618 Wind speed, (m /s) = 0.0057*Y + 1.44 Pressure, (mbar) = 0.0589*Y + 877.71 Solar radi ation, (cal/cm2) = 6.2399*Y + 322.38 Sunshine duration, (min) = 7.0618*Y + 330.64 Tunceli Temperature, (°C) = 0.2259*Y + 12.509 Relative humidity, (%) = –0.2733*Y + 58.904 Wind speed, (m /s) = –0.0013*Y + 1.22 Pressure, (mbar) = 0.0112*Y + 903.73 Solar radi ation, (cal/cm2) = 2.0678*Y + 374.23 Sunshine duration, (min) = 1.6182*Y + 436.84 Malatya Temperature, (°C) = 0.0084*Y + 14.097 Relative humidity, (%) = –0.045*Y + 53.013 Wind speed, (m /s) = –0.0373*Y + 2.0028 Pressure, (mbar) = –0.0045*Y + 907.22 Solar radi ation, (cal/cm2) = –0.045*Y + 53.013 Sunshine duration, (min) = –2.6909*Y + 491.2 Bingöl Temperature, (°C) = 0.0485*Y + 12.293 Relative humidity, (%) = 0.4321*Y + 54.213 Wind speed, (m /s) = –0.0411*Y + 1.526 Pressure, (mbar) = 0.2158*Y + 885.32 Solar radi ation, (cal/cm2) = 3.6787*Y + 352.92 Sunshine duration, (min) = 1.9636*Y + 385.2 Tunceli 0 100 200 300 400 500 600 700 800 900 1000 1994 19951996 19971998 19992000 20012002 2003 Ye a rs Pressure (mbar), Relative humidity (%) Solar radiation (cal/cm 2 ), Sunshine duration (min) 0 2 4 6 8 10 12 14 16 18 20 Wind speed (m/s), Temperature ( o C) Pressure Relative humidity Solar radiation Sunshine duration Wind speed Temperature Figure 12. Linear regression and variations of annual average climatic conditions in Tunceli city during the years 1994–2003 Linear regression models indicate that the pressure re- mains almost invariant throughout the years considered for all cities. The temperature showed a slight decrease with a negative slope for Elazig and Erzincan, a slight increase with a positive slope for Malatya, Tunceli and Bingöl. The relative humidity showed a slight decrease with a negative slope for Elazig, Tunceli and Malatya, a slight increase with a positive slope for Erzincan and 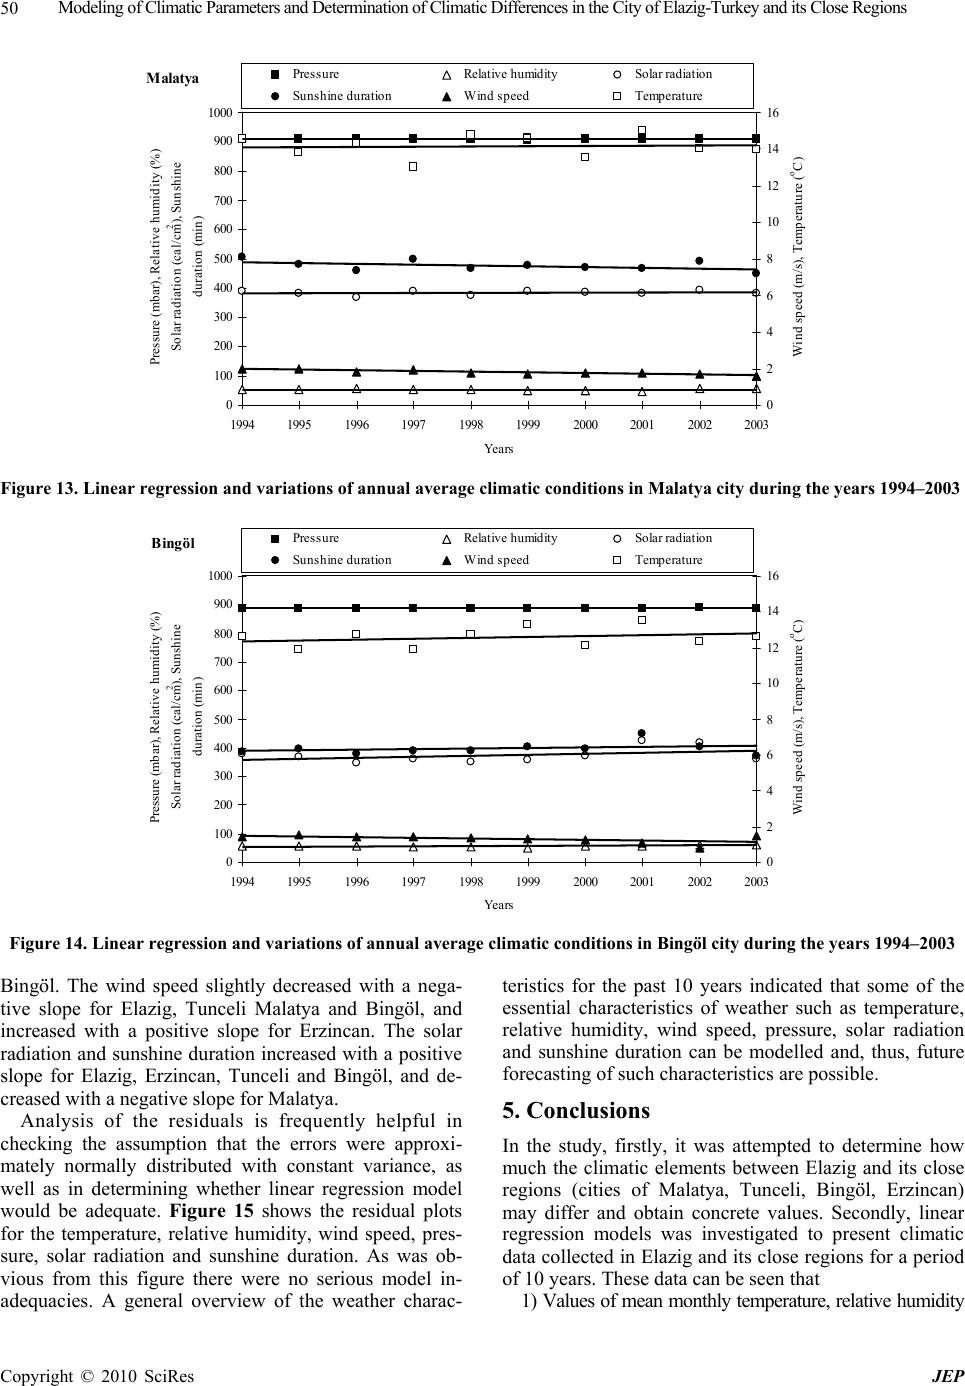 Modeling of Climatic Parameters and Determination of Climatic Differences in the City of Elazig-Turkey and its Close Regions Copyright © 2010 SciRes JEP 50 Malatya 0 100 200 300 400 500 600 700 800 900 1000 19941995 19961997 19981999 20002001 20022003 Years Pressure (mbar), Relative humidity (%) Solar radiation (cal/cm 2 ), Sunshine duration (min) 0 2 4 6 8 10 12 14 16 Wind speed (m/s), Temperature ( o C) Pressure Relative humidity Solar radiation Sunshine duration Wind speed Temperature Figure 13. Linear regression and variations of annual average climatic conditions in Malatya city during the years 1994–2003 Bingöl 0 100 200 300 400 500 600 700 800 900 1000 19941995 19961997 19981999 20002001 20022003 Years Pressure (mbar), Relative humidity (%) Solar radiation (cal/cm 2 ), Sunshine duration (min) 0 2 4 6 8 10 12 14 16 Wind speed (m/s), Temperature ( o C) Pressure Relative humidity Solar radiation Sunshine duration Wind speed Temperature Figure 14. Linear regression and variations of annual average climatic conditions in Bingöl city during the years 1994–2003 Bingöl. The wind speed slightly decreased with a nega- tive slope for Elazig, Tunceli Malatya and Bingöl, and increased with a positive slope for Erzincan. The solar radiation and sunshine duration increased with a positive slope for Elazig, Erzincan, Tunceli and Bingöl, and de- creased with a negative slope for Malatya. Analysis of the residuals is frequently helpful in checking the assumption that the errors were approxi- mately normally distributed with constant variance, as well as in determining whether linear regression model would be adequate. Figure 15 shows the residual plots for the temperature, relative humidity, wind speed, pres- sure, solar radiation and sunshine duration. As was ob- vious from this figure there were no serious model in- adequacies. A general overview of the weather charac- teristics for the past 10 years indicated that some of the essential characteristics of weather such as temperature, relative humidity, wind speed, pressure, solar radiation and sunshine duration can be modelled and, thus, future forecasting of such characteristics are possible. 5. Conclusions In the study, firstly, it was attempted to determine how much the climatic elements between Elazig and its close regions (cities of Malatya, Tunceli, Bingöl, Erzincan) may differ and obtain concrete values. Secondly, linear regression models was investigated to present climatic data collected in Elazig and its close regions for a period of 10 years. These data can be seen that 1) Values of mean monthly temperature, relative humidity 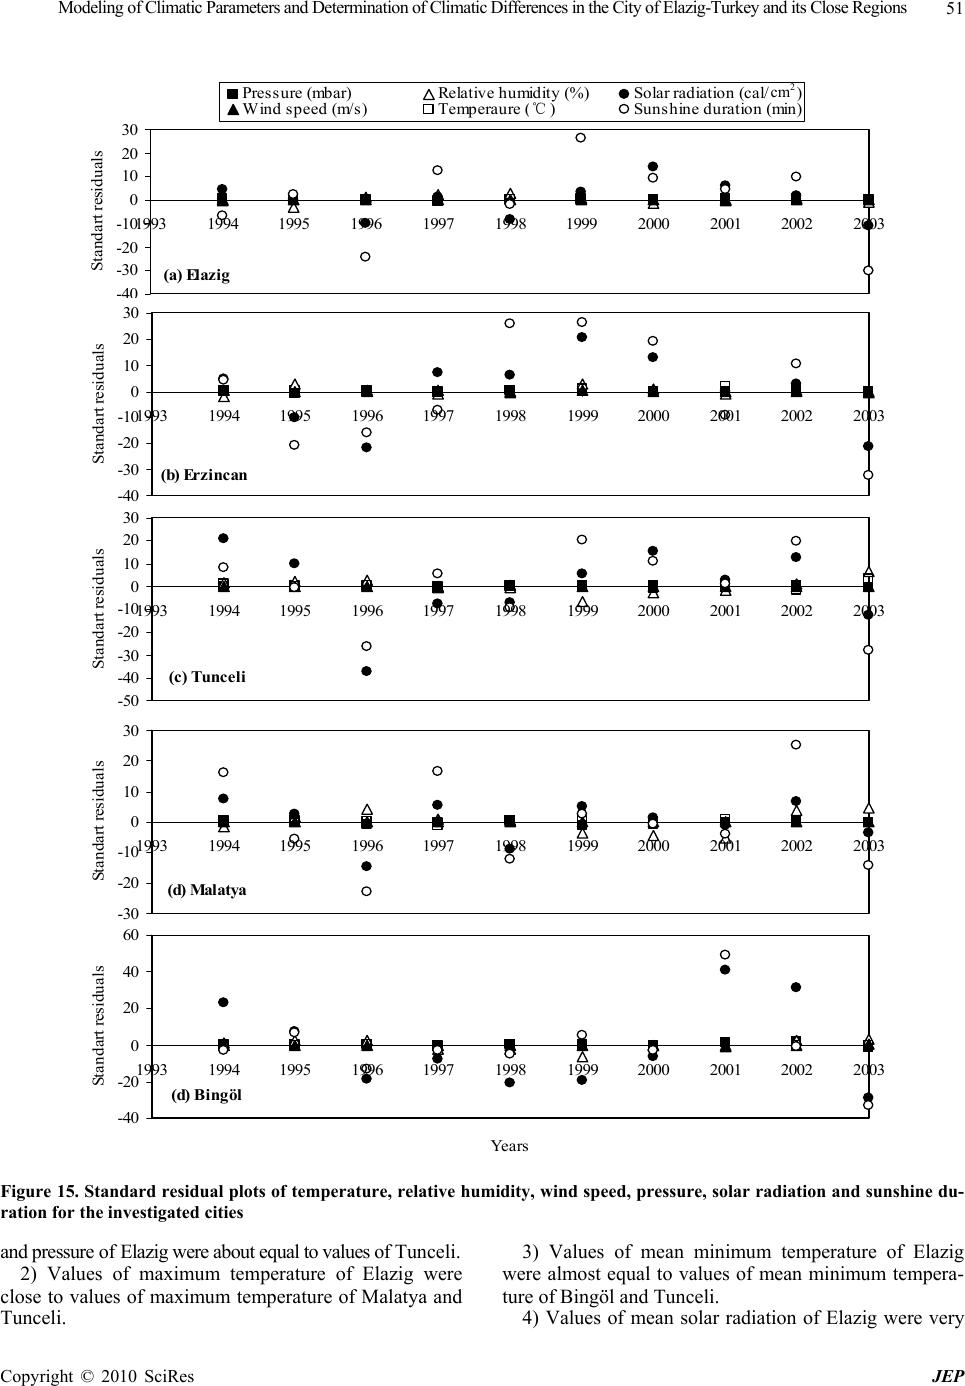 Modeling of Climatic Parameters and Determination of Climatic Differences in the City of Elazig-Turkey and its Close Regions Copyright © 2010 SciRes JEP 51 Figure 15. Standard residual plots of temperature, relative humidity, wind speed, pressure, solar radiation and sunshine du- ration for the investigated cities and pressure of Elazig were about equal to values of Tunceli. 2) Values of maximum temperature of Elazig were close to values of maximum temperature of Malatya and Tunceli. 3) Values of mean minimum temperature of Elazig were almost equal to values of mean minimum tempera- ture of Bingöl and Tunceli. 4) Values of mean solar radiation of Elazig were very (a) Elazig -40 -30 -20 -10 0 10 20 30 1993 19941995 1996 1997 19981999 2000 20012002 2003 Standart residuals Pressure (mbar)Relative humidity (%)Solar radiation (cal/cm2) Wind speed (m/s)Temperaure (oC)Sunshine duration (min) (b) Erzincan -40 -30 -20 -10 0 10 20 30 1993 19941995 19961997 1998 19992000 20012002 2003 Standart residuals (c) Tunceli -50 -40 -30 -20 -10 0 10 20 30 1993 19941995 19961997 1998 19992000 20012002 2003 Standart residuals (d) M a latya -30 -20 -10 0 10 20 30 1993 19941995 19961997 1998 19992000 20012002 2003 Standart residuals (d) Bingöl -40 -20 0 20 40 60 1993 19941995 19961997 1998 19992000 20012002 2003 Years Standart residuals ℃ c m 2  52 Modeling of Climatic Parameters and Determination of Climatic Differences in the City of Elazig-Turkey and its Close Regions Copyright © 2010 SciRes JEP close to values of mean solar radiation of Erzincan. 5) Values of mean sunshine duration of Elazig were very close to values of mean sunshine duration of Malatya. 6) Malatya city was the hottest area whole period, while the Erzincan city was the coldest area. Maximum temperatures were at highest values in Tunceli. Minimum temperatures reached the warmest values in the Malatya. Erzincan city was the most humid area almost throughout the period while Malatya was the least humid area. Wind speed reached the highest values in the Elazig and the lowest values in the Tunceli. Pressure reached the highest values in the Malatya and the lowest values in the Erzincan. Direct solar radiation reached the highest values in the Tunceli and the lowest values in the Erzincan. Sunshine duration reached the highest values in the Malatya and the lowest values in the Erzincan. The factors thought to be effective on the climatic differences mentioned above may result from the features of the investigated cities. The factors thought to be effective on the differences determined in the present study are briefly canopy and evapo-transpiration effects, elevation difference between the areas and surface roughness, radiation and reflection factors, smoke and dust, the duration and color of snow cover on the ground, wind direction and other anthropogenic effects of the invest- tigated city. Depending on the location of the city center, prevalent easterly and northerly winds in this area is effective on temperatures and humidity, which can de- crease temperatures and increase humidity. As is known, there is a true relationship between the population and temperature in a city center. This effect may be smaller compared to those aforementioned, because of the rela- tively low population and the city lacks of any industrial facilities that may influence the temperature in the city. 7) The models were reviewed for the statistical ade- quacy, i.e. the normality assumption is satisfied and the residual versus the predicted and regressed variables are contained within a horizontal band. There was little va- riation between the observed and predicted values of climatic data, i.e. temperature, relative humidity, wind speed pressure, solar radiation and sunshine duration. The models developed in this study can be used for future pre- dictions of the climatic parameters and analysing the en- vironmental and energy related issues in Elazig and its close regions (cities of Malatya, Tunceli, Bingöl, Erzincan). Nomenclature Y the year according to the Gregorian calendar REFERENCES [1] L. S. C. Apple, T. T. Chow, K. F. F. Square, and J. Z. Lin, “Generation of a typical meteorological year for Hong Kong,” Energy Conversion and Management, Vol. 47, No. 1, pp. 87–96, 2006. [2] M. Üner and A. İleri, “Typical weather data of main Turkish cities for energy applications,” International Journal of Energy Research, Vol. 24, No. 8, pp. 727–748, 2000. [3] Z. Sen, “Simple nonlinear solar irradiation estimation model,” Renewable Energy, Vol. 32, No. 2, pp. 342–350, 2007. [4] J. Abdul-Aziz, A. A-Nagi, and A. A. R. Zumailan, “Global solar radiation estimation from relative sunshine hours in Yemen,” Renewable Energy, Vol. 3, No. 6–7, pp. 645– 653, 1993. [5] D. J. Norris, “Correlation of solar radiation with clouds,” Solar Energy, Vol. 12, No. 1, pp. 107–112, 1968. [6] F. Kasten and G. Czeplak, “Solar and terrestrial radiation dependent on the amount and type of cloud,” Solar Energy, Vol. 24, No. 2, pp. 177–189, 1980. [7] K. L. Bristow and G. S. Campbell, “On the relationship between incoming solar radiation and daily maximum and minimum temperature,” Agricultural and Forest Meteo- rology, Vol. 31, No. 2, pp. 159–166, 1984. [8] M. R. McCaskill, “Prediction of solar radiation from rain- day information using regionally stable coefficients,” Agricultural and Forest Meteorology, Vol. 51, No. 3–4, pp. 247–255, 1990. [9] J. W. Hansen, “Stochastic daily solar irradiance for bio- logical modeling applications,” Agricultural and Forest Meteorology, Vol. 94, No. 1, pp. 53–63, 1999. [10] E. Tasdemiroglu and R. Sever, “Estimation of total solar radiation from cloudiness in Turkey,” Renewable Energy, Vol. 1, No. 5–6, pp. 775–778, 1991. [11] J. C. Ododo, J. A. Agbakwuru, and F. A. Ogbu, “Corre- lation of solar radiation with cloud cover and relative sunshine duration,” Energy Conversion and Management, Vol. 37, No. 10, pp. 1555–1559, 1996. [12] A. Z. Al-Garni, A. Z. Şahin, and A. Al-Farayedhi, “Mo- delling of weather characteristics and wind power in the eastern part of Saudi Arabia,” International Journal of Energy Research, Vol. 23, No. 9, pp. 805–812, 1999. [13] J. Unger, “Urban climatology of szeged (in Hungarian),” Acta Climatologica University Szegediensis, 30B, (Urban climate special issue), 1997. [14] M. Unkasevic, O. Jovanovic, and T. Popovic, “Urban– suburban/rural vapor pressure and relative humidity differences at fixed hours over the area of Belgrade City,” Theoretical and Applied Climatology, Vol. 68, No. 1–2, pp. 167–173, 2001. [15] S. M. Robaa, “Urban–suburban/rural differences over Greater Cairo,” Egypt Atmosfera, pp. 157–171, 2003. [16] A. Bernatzky, “The contribution of trees and green spaces to a town climate,” Energy and Buildings, Vol. 5, No. 1, pp. 1–10, 1982. [17] F. Wilmers, “Green for melioration of urban climate,” Energy and Building, Vol. 11, No. 1–3, pp. 289–299, 1988. [18] D. J. Nowak, P. J. McHale, M. Ibarra, D. Crane, J. Stevens, and C. Luley, “Modeling the effects of urban vegetation on air pollution,” Air pollution modeling and its application XII, Plenum Pres, New York, pp. 399–407, 1998. [19] S. Yılmaz, S. Toy, M. A. Irmak, and H. Yilmaz, “Deter- mination of climatic differences in three different land uses in the city of Erzurum,” Building and Environment, Turkey, Vol. 42, No. 4, pp. 1604–1612, 2007. |