Paper Menu >>
Journal Menu >>
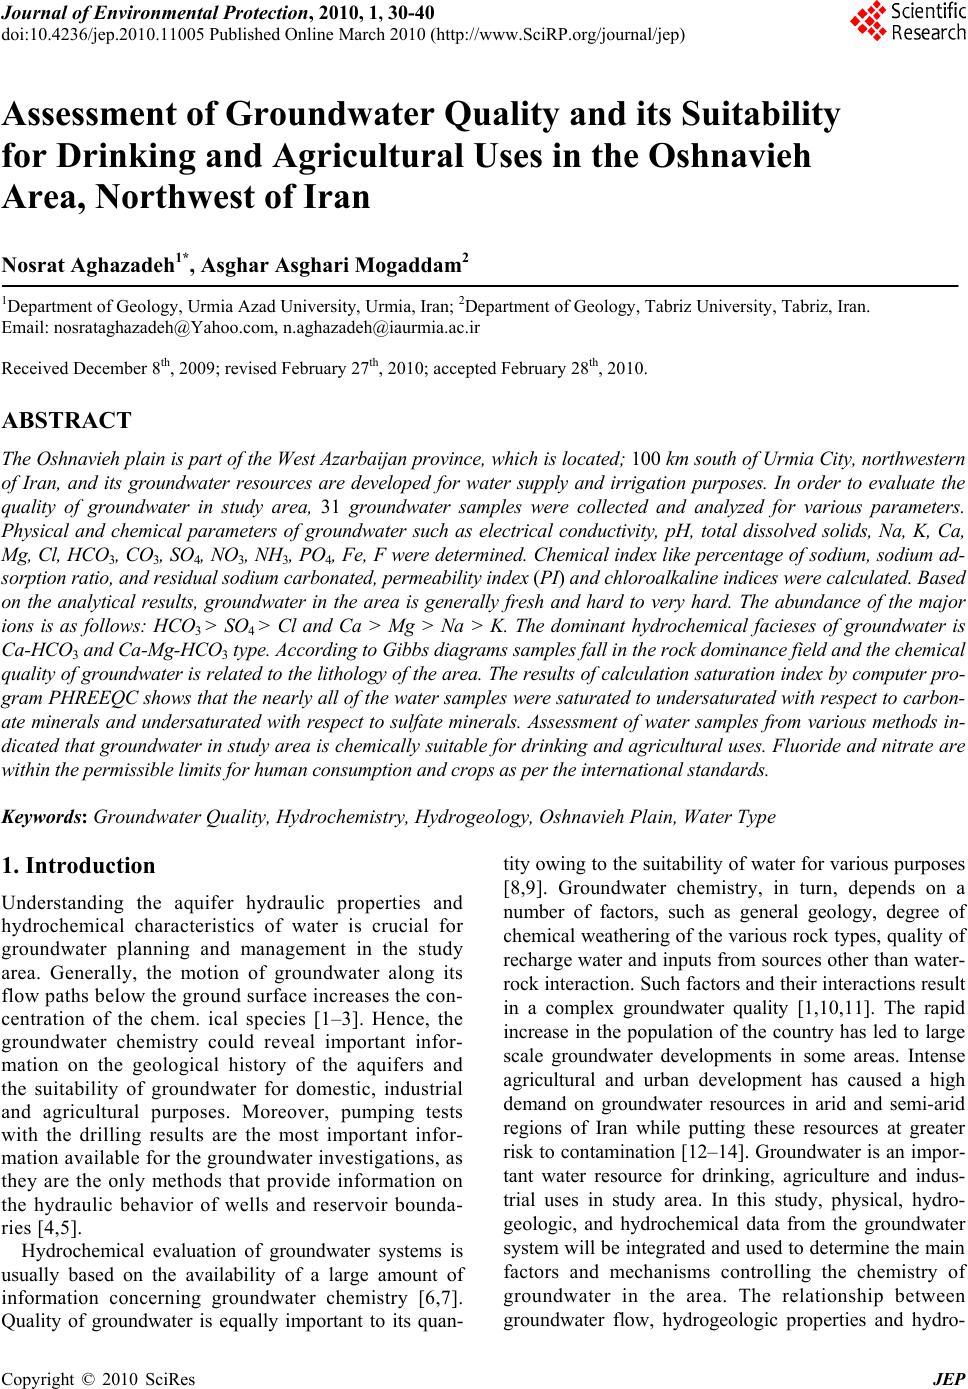 Journal of Environmental Protection, 2010, 1, 30-40 doi:10.4236/jep.2010.11005 Published Online March 2010 (http://www.SciRP.org/journal/jep) Copyright © 2010 SciRes JEP Assessment of Groundwater Quality and its Suitability for Drinking and Agricultural Uses in the Oshnavieh Area, Northwest of Iran Nosrat Aghazadeh1*, Asghar Asghari Mogaddam2 1Department of Geology, Urmia Azad University, Urmia, Iran; 2Department of Geology, Tabriz University, Tabriz, Iran. Email: nosrataghazadeh@Yahoo.com, n.aghazadeh@iaurmia.ac.ir Received December 8th, 2009; revised February 27th, 2010; accepted February 28th, 2010. ABSTRACT The Oshnavieh plain is part of the West Azarbaijan province, which is located; 100 km south of Urmia City, northwestern of Iran, and its groundwater resources are developed for water supply and irrigation purposes. In order to evaluate the quality of groundwater in study area, 31 groundwater samples were collected and analyzed for various parameters. Physical and chemical parameters of groundwater such as electrical conductivity, pH, total dissolved solids, Na, K, Ca, Mg, Cl, HCO3, CO3, SO4, NO3, NH3, PO4, Fe, F were determined. Chemical index like percentage of sodium, sodium ad- sorption ratio, and residual sodium carbonated, permeability index (PI) and chloroalkaline indices were calculated. Based on the analytical results, groundwater in the area is generally fresh and hard to very hard. The abundance of the major ions is as follows: HCO3 > SO4 > Cl and Ca > Mg > Na > K. The dominant hydrochemical facieses of groundwater is Ca-HCO3 and Ca-Mg-HCO3 type. According to Gibbs diagrams samples fall in the rock dominance field and the chemical quality of groundwater is related to the lithology of the area. The results of calculation saturation index by computer pro- gram PHREEQC shows that the nearly all of the water samples were saturated to undersaturated with respect to carbon- ate minerals and undersaturated with respect to sulfate minerals. Assessment of water samples from various methods in- dicated that groundwater in study area is chemically suitable for drinking and agricultural uses. Fluoride and nitrate are within the permissible limits for human consumption and crops as per the international standards. Keywords: Groundwater Quality, Hydrochemistry, Hydrogeology, Oshnavieh Plain, Water Type 1. Introduction Understanding the aquifer hydraulic properties and hydrochemical characteristics of water is crucial for groundwater planning and management in the study area. Generally, the motion of groundwater along its flow paths below the ground surface increases the con- centration of the chem. ical species [1–3]. Hence, the groundwater chemistry could reveal important infor- mation on the geological history of the aquifers and the suitability of groundwater for domestic, industrial and agricultural purposes. Moreover, pumping tests with the drilling results are the most important infor- mation available for the groundwater investigations, as they are the only methods that provide information on the hydraulic behavior of wells and reservoir bounda- ries [4,5]. Hydrochemical evaluation of groundwater systems is usually based on the availability of a large amount of information concerning groundwater chemistry [6,7]. Quality of groundwater is equally important to its quan- tity owing to the suitability of water for various purposes [8,9]. Groundwater chemistry, in turn, depends on a number of factors, such as general geology, degree of chemical weathering of the various rock types, quality of recharge water and inputs from sources other than water- rock interaction. Such factors and their interactions result in a complex groundwater quality [1,10,11]. The rapid increase in the population of the country has led to large scale groundwater developments in some areas. Intense agricultural and urban development has caused a high demand on groundwater resources in arid and semi-arid regions of Iran while putting these resources at greater risk to contamination [12–14]. Groundwater is an impor- tant water resource for drinking, agriculture and indus- trial uses in study area. In this study, physical, hydro- geologic, and hydrochemical data from the groundwater system will be integrated and used to determine the main factors and mechanisms controlling the chemistry of groundwater in the area. The relationship between groundwater flow, hydrogeologic properties and hydro- 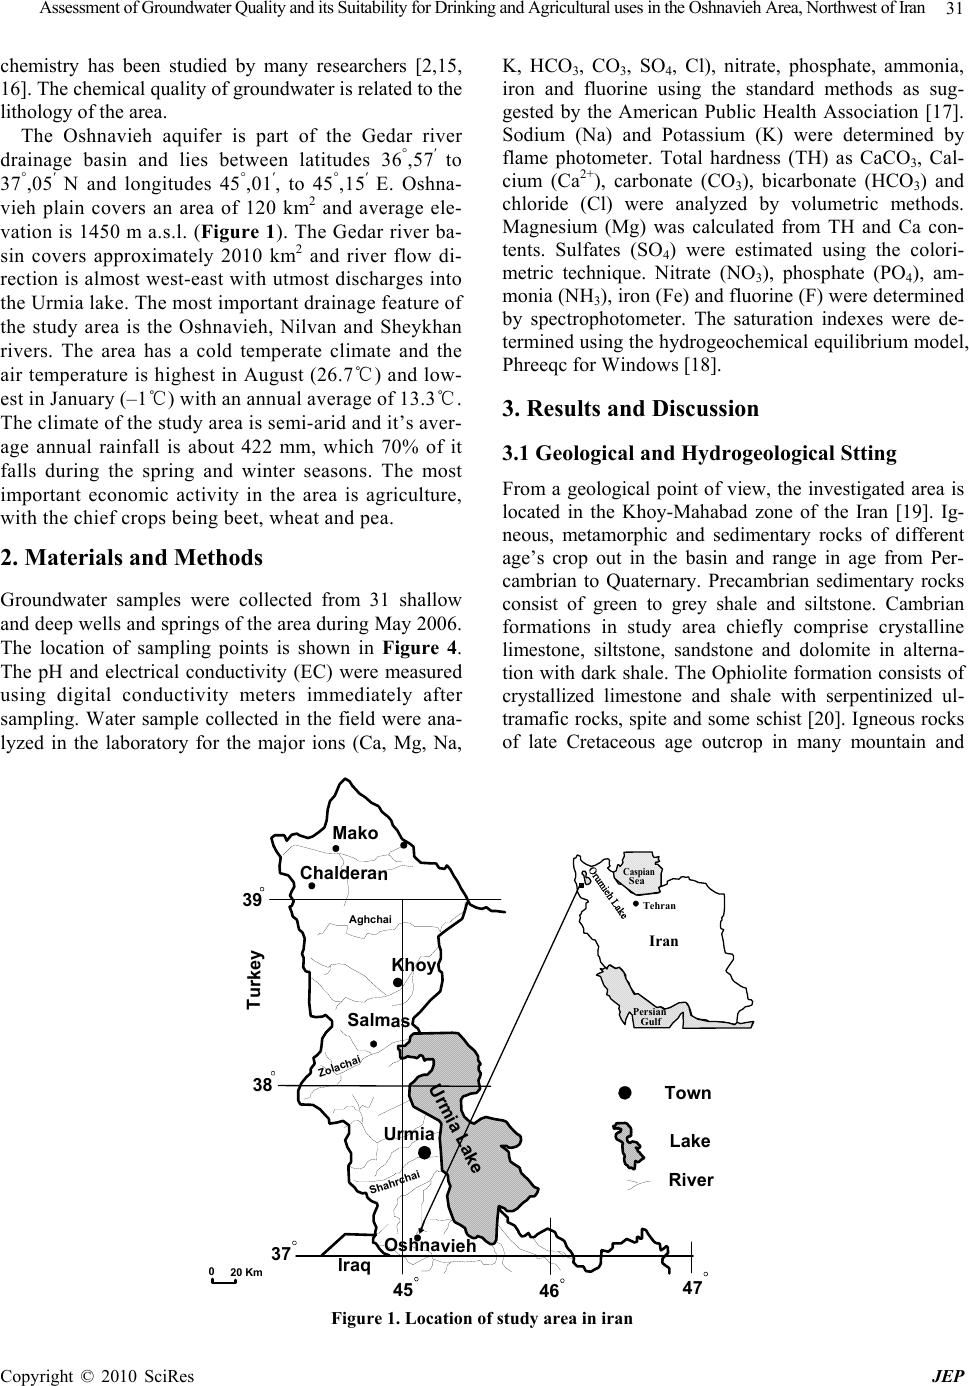 Assessment of Groundwater Quality and its Suitability for Drinking and Agricultural uses in the Oshnavieh Area, Northwest of Iran Copyright © 2010 SciRes JEP 31 chemistry has been studied by many researchers [2,15, 16]. The chemical quality of groundwater is related to the lithology of the area. The Oshnavieh aquifer is part of the Gedar river drainage basin and lies between latitudes 36°,57′ to 37°,05′ N and longitudes 45°,01′, to 45°,15′ E. Oshna- vieh plain covers an area of 120 km2 and average ele- vation is 1450 m a.s.l. (Figure 1). The Gedar river ba- sin covers approximately 2010 km2 and river flow di- rection is almost west-east with utmost discharges into the Urmia lake. The most important drainage feature of the study area is the Oshnavieh, Nilvan and Sheykhan rivers. The area has a cold temperate climate and the air temperature is highest in August (26.7℃) and low- est in January (–1℃) with an annual average of 13.3℃. The climate of the study area is semi-arid and it’s aver- age annual rainfall is about 422 mm, which 70% of it falls during the spring and winter seasons. The most important economic activity in the area is agriculture, with the chief crops being beet, wheat and pea. 2. Materials and Methods Groundwater samples were collected from 31 shallow and deep wells and springs of the area during May 2006. The location of sampling points is shown in Figure 4. The pH and electrical conductivity (EC) were measured using digital conductivity meters immediately after sampling. Water sample collected in the field were ana- lyzed in the laboratory for the major ions (Ca, Mg, Na, K, HCO3, CO3, SO4, Cl), nitrate, phosphate, ammonia, iron and fluorine using the standard methods as sug- gested by the American Public Health Association [17]. Sodium (Na) and Potassium (K) were determined by flame photometer. Total hardness (TH) as CaCO3, Cal- cium (Ca2+), carbonate (CO3), bicarbonate (HCO3) and chloride (Cl) were analyzed by volumetric methods. Magnesium (Mg) was calculated from TH and Ca con- tents. Sulfates (SO4) were estimated using the colori- metric technique. Nitrate (NO3), phosphate (PO4), am- monia (NH3), iron (Fe) and fluorine (F) were determined by spectrophotometer. The saturation indexes were de- termined using the hydrogeochemical equilibrium model, Phreeqc for Windows [18]. 3. Results and Discussion 3.1 Geological and Hydrogeological Stting From a geological point of view, the investigated area is located in the Khoy-Mahabad zone of the Iran [19]. Ig- neous, metamorphic and sedimentary rocks of different age’s crop out in the basin and range in age from Per- cambrian to Quaternary. Precambrian sedimentary rocks consist of green to grey shale and siltstone. Cambrian formations in study area chiefly comprise crystalline limestone, siltstone, sandstone and dolomite in alterna- tion with dark shale. The Ophiolite formation consists of crystallized limestone and shale with serpentinized ul- tramafic rocks, spite and some schist [20]. Igneous rocks of late Cretaceous age outcrop in many mountain and Turkey Urmia Mako Khoy Salmas Oshnavieh Chalderan Urmia Lake Iraq 39 38 37 45 46 47 Zolachai Shahrchai Aghchai Town Lake River 020 Km Sea Caspian Tehran Gulf Persian Iran Figure 1. Location of study area in iran 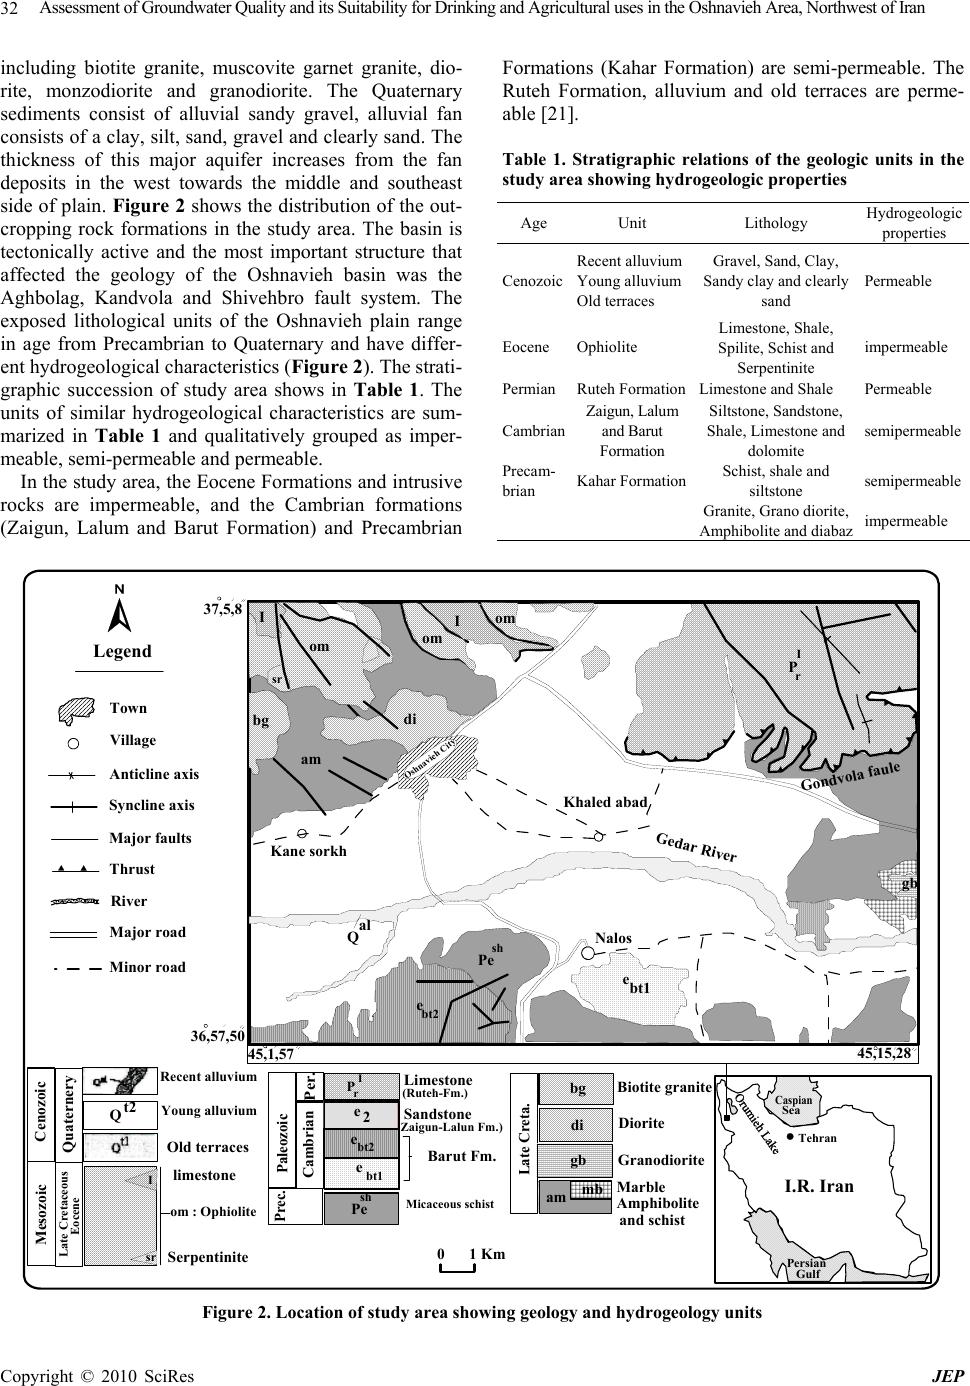 Assessment of Groundwater Quality and its Suitability for Drinking and Agricultural uses in the Oshnavieh Area, Northwest of Iran Copyright © 2010 SciRes JEP 32 including biotite granite, muscovite garnet granite, dio- rite, monzodiorite and granodiorite. The Quaternary sediments consist of alluvial sandy gravel, alluvial fan consists of a clay, silt, sand, gravel and clearly sand. The thickness of this major aquifer increases from the fan deposits in the west towards the middle and southeast side of plain. Figure 2 shows the distribution of the out- cropping rock formations in the study area. The basin is tectonically active and the most important structure that affected the geology of the Oshnavieh basin was the Aghbolag, Kandvola and Shivehbro fault system. The exposed lithological units of the Oshnavieh plain range in age from Precambrian to Quaternary and have differ- ent hydrogeological characteristics (Figure 2). The strati- graphic succession of study area shows in Table 1. The units of similar hydrogeological characteristics are sum- marized in Table 1 and qualitatively grouped as imper- meable, semi-permeable and permeable. In the study area, the Eocene Formations and intrusive rocks are impermeable, and the Cambrian formations (Zaigun, Lalum and Barut Formation) and Precambrian Formations (Kahar Formation) are semi-permeable. The Ruteh Formation, alluvium and old terraces are perme- able [21]. Table 1. Stratigraphic relations of the geologic units in the study area showing hydrogeologic properties Hydrogeologic properties Lithology Unit Age Permeable Gravel, Sand, Clay, Sandy clay and clearly sand Recent alluvium Young alluvium Old terraces Cenozoic impermeable Limestone, Shale, Spilite, Schist and Serpentinite Ophiolite Eocene Permeable Limestone and Shale Ruteh FormationPermian semipermeable Siltstone, Sandstone, Shale, Limestone and dolomite Zaigun, Lalum and Barut Formation Cambrian semipermeable Schist, shale and siltstone Kahar Formation Precam- brian impermeable Granite, Grano diorite, Amphibolite and diabaz 01 Km 45,1,57 45,15,28 37,5,8 36,57,50 P I r Gondvola faule Gedar River Oshnavieh City di bg II om om om sr bt2 e sh Pe am Qal Nalos Khaled abad Kane sorkh Paleozoic Per. Cambrian (Zaigun-Lalun Fm.) (Ruteh-Fm.) Prec. Sandstone Barut Fm. Micaceous schist P I r e bt2 Pe sh Late Creta. Biotite grani te Diorite Granodiorite Marble di bg mb am Amphibolite and schist Cenozoic Quaternery Mesozoic Late Cretaceous Eocene Recent alluvium Young alluvium Old terraces om : Ophiolite limestone Serpentinite I sr Qt2 Limestone bt1 e e2 gb gb ebt1 Legend Town Village Anticline axis Syncline axis Thrust Major faults River Major road Minor road Sea Caspian Tehran Gulf Persian I.R. Iran Figure 2. Location of study area showing geology and hydrogeology units  Assessment of Groundwater Quality and its Suitability for Drinking and Agricultural uses in the Oshnavieh Area, Northwest of Iran Copyright © 2010 SciRes JEP 33 Oshnavieh aquifer is occurred in Quaternary sediments, which are distinguished by horizontal and vertical ex- change of various lithological units. It is composed of Pleistocene and Holocene gravel-sand sediments and with silt-clay interbreeds. From field work and observa- tions, groundwater occurs in the study area in two main water-bearing layers, a lower confined aquifer and an upper unconfined aquifer. Groundwater recharge is from rainfall. In the study area groundwater is an important source for domestic water supply. Groundwater and sur- face water of Gedar rivers use for agriculture uses. Ac- cording to Azarbaijan Regional Water Authority [22], 122 deep and 253 shallow active pumping wells operate in the aquifer. The water abstraction from the Oshnavieh aquifer during the 2003-2004 is about 30.738 million m3 and presented in Table 2. The hydraulic properties of Oshnavieh aquifer was determined using pumping tests data. The Oshnavieh aquifer is characterized by trans- missivity that varies from 500-3000 m2/day and specific yield of about 3 × 10⁻² [22]. One of the main imperative approaches for the identification of groundwater flow directions is the water level contour map, which has been used as a basis for evaluating groundwater recharge. Hence, water heads in meters above sea level (a.s.l.) in each piezometr were used to construct the piezometric surface contour map using the Surfer Software. The groundwater level contour map shown on Figure 3 sum- marizes the distribution of piezometric head in the aqui- fer system within the study area. The general groundwa- ter flow direction in the aquifer is from W to E, and depth to water table varies from 1.8 to 24.75 m below ground level (Figure 4). Seasonal groundwater level fluctuations indicate that the water table tends to rise during November and April to reach peak in May and declines from January onwards to reach minimum in September [21]. 3.2 Groundwater Chemistry The chemical composition of groundwater results from the geochemical processes occurring as water reacts with the geologic materials which it flows [23]. The water quality analyses included all major anions, cations, ni- trate, phosphate, ammonia, iron and fluorine. The allover groundwater pH and electrical conductivity (EC) values of the study area are ranging from 7.1 to 8.4 and 290 to 990 μS cm-1, respectively. Total dissolved solids (TDS) in the study area vary between 182 to 582 mg/l. The groundwater in the study area falls under fresh (TDS < 1, 000 mg/l) types of water [2]. The total hardness (as CaCO3) ranges from 125 to 448 mg/l. Table 2. Total Abstraction from Groundwater and springs during 2004 Water Re- source Num. Min.Dis- charge(lit/s) Max.Dis- charge(lit/s) Annual Dis- charge(MCM) Agri- cultural uses (MCM) Drinking uses (MCM) Springs231.5 35 6.927 6.3410.585 Wells3752.4 44 23.811 19.264.55 Total893- - 30.738 25.6015.135 Town Oshnavieh 01 Km 1400 Iso-Water Table Max. Flow Line (m) 37,05,08 36,57,50 45,01,57 45,15,28 Figure 3. Groundwater level contour map of the aquifer system in the Oshnavieh plain (in meters above mean sea level)  Assessment of Groundwater Quality and its Suitability for Drinking and Agricultural uses in the Oshnavieh Area, Northwest of Iran Copyright © 2010 SciRes JEP 34 Town Oshnavieh 01 Km Water Sample P1 P2 P3 P4 P5 P6 P7 P8 P9 P10 P11 P12 P13 P14 P15 P16 P17 P18 P19 P20 45,01,57 45,15,28 36,57,50 37,05,08 Piezometer Iso- Dept. Max.(m) 10 Figure 4. Depth groundwater contour map of the aquifer system in the Oshnavieh plain (in meters below ground level) and location of groundwater samples In the study area, the Na and K concentrations in groundwater range from 2 to 52 and 0 to 11.7 mg/l, respectively. The concentrations of calcium range from 20 to 142 mg/l, which is derived from calcium rich minerals like feldspars, pyroxenes and amphiboles. The major source of magnesium (Mg) in the groundwater is due to ion exchange of minerals in rocks and soils by water. The concentrations of Mg and HCO3 ions found in the groundwater samples of study area are ranged from 12–51 and 140 to 506 mg/l respectively. The con- centration of chloride ranges from 3.5 to 43 mg/l and increases from the recharge to discharge area. Sulfate varies from 8 to 48 mg/l. The nitrate concentration in May 2006 groundwater samples range from 8 mg/l to 62 mg/l with an average value of 16.6 mg/l. The source of nitrate in area is N fertilizers (commonly urea, ni- trate or ammonium compounds) that are used for agri- cultural practices. Fluoride is one of main trace ele- ments in groundwater, which generally occurs as a natural constituent. Bedrock containing fluoride min- erals is generally responsible for high concentration of this ion in groundwater [24,25]. The concentration of fluoride in groundwater of the study area varies be- tween 0.11-0.42 mg/l during May 2006 with an average value of 0.22 mg/l and all samples groundwater in study area are suitability for drinking. Figure 5 shows that Ca, Mg and HCO3 are dominant cations and anion, respectively. A further illustration of this is shown in Figure 5 where the median values of HCO3 exceeded 50% of total anions in milli-equivalent unit. The abun- dance of the major ions in groundwater is in following order: Ca > Mg > Na > K and HCO3 > SO4 > Cl > NO3 > CO3. Minimum, maximum and average values of physical and chemical parameters of groundwater samples are presented in Table 3. The concentration of dissolved ions in groundwater samples are generally governed by lithology, nature of geochemical reactions and solubil- ity of interaction rocks. The functional sources of dis- solved ions can be broadly assessed by plotting the samples, according to the variation in the ratio of Na/(Na+Ca) and Cl/(Cl+HCO3) as a function of TDS [26]. The Gibbs plot of data from study area (Figure 6) indicates that rock is the dominant processes control- ling the major ion composition of groundwater. 3.3 Saturation Index Saturation indexes are used to evaluate the degree of equilibrium between water and minerals. Changes in saturation state are useful to distinguish different stages of hydrochemical evolution and help identify which geo- chemical reactions are important in controlling water chemistry [27–29]. The saturation index of a mineral is obtained from Equation (1) [30].  Assessment of Groundwater Quality and its Suitability for Drinking and Agricultural uses in the Oshnavieh Area, Northwest of Iran Copyright © 2010 SciRes JEP 35 Table 3. Minimum, maximum and average values of physical and chemical par a me ter s of groundwater samples Average Maximum Minimum Units Parameters 7.52 592 374 7.14 1.91 45.16 25.9 17.97 297.6 2.1 23.75 294 1.25 7.14 –1.01 42.9 –0.33 –0.18 –0.24 –0.62 –2.26 8.4 910 582 34.78 11.7 142 51 43 506 60 48 448 1.8 34.78 2.3 66 0.64 0.37 0.12 –0.12 –1.77 7.1 290 182 2.63 0 20 12 3.5 140 0 8 125 0.074 2.63 –2.93 30 –0.7 –0.44 –0.82 –1.84. –2.82 - S/cmμ mg/l mg/l mg/l mg/l mg/l mg/l mg/l mg/l mg/l mg/l - % meq/l % meq/l meq/l - - - - pH EC TDS Na K Ca Mg Cl HCO3 CO3 SO4 TH SAR %Na RSC PI CAI,1 CAI,2 SI calcite SI dolomite SI gypsum SI anhydrate RSC: Residual sodium carbonate PI: Permeability index CAI: Chloro alkaline index SI: Saturation index EC: Electrical conductivity TDS: Total dissolved solids TH: Total hardness SAR: Sodium adsorption ratio Figure 5. Pie diagram of median values of major ions SI = log (IAP/Kt) (1) where IAP is the ion activity product of the dissociated chemical species in solution, Kt is the equilibrium solu- bility product for the chemical involved at the sample temperature. An index (SI), less than zero, indicate that the groundwater is undersaturated with respect to that particular mineral. Such a value could reflect the charac- ter of water from a formation with insufficient amount of the mineral for solution or short residence time. An index (SI), greater than zero, specifies that the groundwater being supersaturated with respect to the particular min- eral phase and therefore incapable of dissolving more of the mineral. Such an index value reflects groundwater discharging from an aquifer containing ample amount of the mineral with sufficient resident time to reach equilib- rium. Nonetheless, super saturation can also be produced by other factors that include incongruent dissolution, common ion effect, and evaporation, rapid increase in temperature and CO2 exsolution [23,29]. In Table 2 the SI for calcite, dolomite, anhydrate and gypsum are shown. Figure 7 shows the plots of SI against TDS for all the investigated water. Nearly all water samples were saturated to undersaturate with respect to calcite, dolomite and aragonite and all samples undersaturated with respect to gypsum and anhydrite, suggesting that these carbonate mineral phases may have influenced the chemical com- position of the study area. In Ca-HCO3 water type the Ca Na K Mg SO4 Cl HCO3  Assessment of Groundwater Quality and its Suitability for Drinking and Agricultural uses in the Oshnavieh Area, Northwest of Iran Copyright © 2010 SciRes JEP 36 Cl/(Cl+HCO3) TDS(mg/l) 00.2 0.4 0.60.8 1.0 10 100 1000 10000 EVAPORATION CRYSTALIZATION DOMINANCE ROCK DOMINANCE PRECIPITATION DOMINANCE Na / (Na+Ca) TDS (mg/l) 00.2 0.4 0.60.8 1.0 10 100 1000 10000 EVAPORATION CRYSTALIZATION DOMINANCE ROCK DOMINANCE PRECIPITATION DOMINANCE Figure 6. Mechanisms governing groundwater chemistry (after gibbs, 1970) A nhydrate -4 -3.5 -3 -2.5 -2 -1.5 -1 -0.5 0 0100 200 300400 500 600 700 TDS (mg/l) Saturation Index Gups um -3 -2.5 -2 -1.5 -1 -0.5 0 0100 200 300400 500 600 700 TDS (mg/ l ) Saturation Index Calcite -1 -0.8 -0.6 -0.4 -0.2 0 0.2 0200 400600 800 TDS (mg/l) Saturation Index Dol o mit -2 -1.8 -1.6 -1.4 -1.2 -1 -0.8 -0.6 -0.4 -0.2 0 0100 200 300 400 500 600 700 TDS (mg/l ) Saturation Index Figure 7. Plots of saturation indexes with respect to some carbonate minerals against total dissolved solids (TDS) mean values of SIcal , SIdol , SIgyp, SI anhy are –0.24, –0.617, –2.26 and –2.49, respectively. 3.4 Hydrochemical Facies The values obtained from the groundwater samples ana- lyzing, and their plot on the Piper's diagrams [31] reveal that the dominant cation is Ca and the anion is HCO3. In the study area, the major groundwater type is Ca-HCO3 and Ca-Mg-HCO3 (Figure 8). Chadha [32] has proposed new diagram for geochemical data presentations. The proposed diagram is a modification of Piper diagram with a view to extend its applicability in representing water analysis in the possible simplest way. Results of analyses were plotted on the proposed diagram to test its applicability for geochemical classification of ground- water and to study hydrochemical processes (Figure 9). The plot shows that all of the groundwater samples fall under the subdivision of alkaline earths exceeds alkali metals and weak acidic anions exceed strong acidic ani- ons (Ca-Mg-HCO3water type).  Assessment of Groundwater Quality and its Suitability for Drinking and Agricultural uses in the Oshnavieh Area, Northwest of Iran Copyright © 2010 SciRes JEP 37 2 4 7 9 8 56 3 1 3 5 9 2 4 7 9 4 6 1 100 100 100 100 0 0 0 50 50 50 50 SO4+Cl Na+K HCO3+CO3 Ca+Mg Figure 8. Chemical facies of groundwate r in pipe r diagr am 20 40 60 80 -20 -40 -60 -80 20 40 60 80 -20 -40 -60 -80 1 5 3 4 7 2 8 6 Y X (Ca+Mg)-(Na+K) Millieqivalent percentage (CO3+HC O3)-(C l+SO 4) Millieqiva le nt percenta ge Ca-Mg-HCO3 Water Type Na-HCO3 Water Type Na-Cl Water TypeCa-Mg-Cl Water Type Figure 9. Diagram showing geochemical classification and hydrochemical parameters of groundwater (after chadha, 1999) 3.5 Drinking and Irrigation Water Quality The analytical results have been evaluated to ascertain the suitability of groundwater of the study area for drinking and agricultural uses. The drinking water quality is evaluated by comparing with the specifica- tions of TH and TDS set by the World Health Or- ganization [33,34]. According to WHO specification TDS up to 500 mg/l is the highest desirable and up to 1500 mg/l is maximum permissible (Table 4). Based on this classification, 87% of samples are belonging to highest desirable category and remaining samples are belonging to maximum permissible category. The hardness values range from 125 to 448 mg/l during May 2006. The classification of groundwater based on total hardness [35] (Table 5) shows that 59% of the groundwater samples fall in the very hard water cate- gory, 35% hard category and remaining samples fall in moderately hard category(Table 5). Maximum al- lowable limit of TH for drinking is 500 mg/l and the most desirable limit is 100 mg/l as per the WHO in- ternational standard. Based on this classification it in Table 4. Groundwater samples of the study area exceeding the permissible limits p rescribed b y WHO for drinking purposes WHO international standard (1971, 1983) Amount in Groundwater samples Maximum Allowable limits Most desirable limits Parameters 7.1–8.4 9.2 7–8.5 PH 182–582 1500 500 TDS(mg/l) 125–448 500 100 TH(mg/l) 2–52 200 - Na(mg/l) 20–142 200 75 Ca(mg/l) 12–51 150 50 Mg(mg/l) 3.5–43 600 200 Cl(mg/l) 8–48 400 200 SO4(mg/l) 8–62 - 45 NO3(mg/l) 0–0.05 0.5 0.05 NH3(mg/l) 0.115–0.425 1.5 - F(mg/l) 0–0.141 1 0.1 Fe(mg/l) Table 5. Suitability of groundwater based on hardness Total hardness as CaCO3(mg/l) Water class <75 75–150 150–300 >300 Soft Moderately hard Hard Very hard dicates that all of the groundwater samples are not ex- ceed the maximum allowable limits. Salinity and indices such as, sodium absorption ratio (SAR), sodium percentage (Na %), residual sodium car- bonate (RSC), and permeability index (PI) are important parameters for determining the suitability of groundwater for agricultural uses [36,37]. Electrical conductivity is a good measure of salinity hazard to crops as it reflects the TDS in groundwater. The US Salinity Laboratory [38] classified ground waters on the basis of electrical con- ductivity (Table 6). Based on this classification, 16% of samples are belonging to the doubtful category and 84% to good category. Sodium adsorption ratio (SAR) is an important parameter for determining the suitability of groundwater for irrigation because it is a measure of al- kali/sodium hazard to crops [9]. SAR is defined by Table 6. Classification of groundwater for irrigation based on EC, SAR Quality of water Electrical conductivity (S/cm) Sodium adsorption ratio(SAR) Excellent Good Doubtful Unsuitable <250 250–750 750–2250 >2250 <10 10–18 18–26 >26  Assessment of Groundwater Quality and its Suitability for Drinking and Agricultural uses in the Oshnavieh Area, Northwest of Iran Copyright © 2010 SciRes JEP 38 Karanth [39] as Equation (2). SAR=Na/[(Ca+Mg)/2]1/2 (2) where all ionic concentrations are expressed in meq/l. The SAR values range from 0.074 to 1.84 and according to the Richards [40] classification based on SAR values (Table 6), all of samples are belong to the excellent cate- gory. SAR can indicate the degree to which irrigation water tends to enter into cation-exchange reactions in soil. Sodium replacing adsorbed calcium and magnesium is a hazard as it causes damage to the soil structure and becomes compact and impervious [37]. The analytical data plotted on the US salinity diagram [40] illustrates that 77% of the groundwater samples fall in the field of C2S1, indicating medium salinity and low sodium water, which can be used for irrigation on all types of soil with- out danger of exchangeable sodium (Figure 10). The sodium percent (%Na) is obtained by the Equation (3). %Na=[Nark]×100/[Ca+Mg+Na+K] (3) where all ionic concentrations are expressed in meq/l. The Wilcox [41] diagram relating sodium percentage and total concentration shows that %26 of the groundwa- ter samples fall in the field of good to permissible and 74% of the groundwater samples fall in the field of ex- cellent to good for irrigation (Figure 11). Residual sodium carbonate (RSC) has been calculated to determine the hazardous effect of carbonate and bicar- bonate on the quality of water for agricultural purpose and has been determined by the Equation (4). RSC=(CO3 +HCO3)-(Ca+ Mg) (4) where all ionic concentrations are expressed in meq/l [42]. The classification of irrigation water according to the RSC values is waters containing more than 2.5 meq/l Figure 10. Rating of groundwater samples in relation to salinity and sodium hazard 0500 750 1000 1500 2000 2500 3000 3500 10 20 30 40 50 60 70 80 90 100 Percent Sodium Electrical Conductivity (micromhos/cm) at 25 C Unsuitable Doubtful to Good Permissible Excellent to to to Good Permissible Doubtful Unsuitable Figure 11. Rating of groundwater samples on the basis of electrical conductivity and percent sodium (after wilcox, 1955) of RSC are not suitable for irrigation, while those having –2.93 to 2.3meq/l are doubtful and those with less than 1.25 meq/l are good for irrigation. Based on this classifi- cation, all of groundwater samples belong to the good category except one sample. The permeability index (PI) values also indicate that the groundwater is suitable for irrigation. It is defined as follows (Equation (5)) PI=100×[([Na]+[HCO3]1/2)/[Na]+[Ca]+[Mg] (5) where all the ions are expressed in meq/l [44]. WHO [45] uses a criterion for assessing the suitability of water for irrigation based on permeability index. The PI range from 30% to 66% and the average value is about 43% during May 2006. According to PI values, the groundwa- ter of in the study area can be designated as class II (25– 75%) that shows the groundwater in study area is suitable for irrigation purposes. 3.6 Chloroalkaline Indices (CAI) It is essential to know the changes in chemical composi- tion of groundwater during its travel in the sub-surface [45]. The Chloro-alkaline indices CAI 1, 2 are suggested by Schoeller [46], which indicate the ion exchange be- tween the groundwater and its host environment. The  Assessment of Groundwater Quality and its Suitability for Drinking and Agricultural uses in the Oshnavieh Area, Northwest of Iran Copyright © 2010 SciRes JEP 39 Chloro-alkaline indices used in the evaluation of Base Exchange are calculated using the Equations (6,7). 1) Chloro Alkaline Indices 1 = [Cl–(Na+K)] / Cl (6) 2) Chloro Alkaline Indices 2 = [Cl–(Na+K)]/(SO4+HCO3+CO3+NO3) (7) If there is ion exchange of Na and K from water with magnesium and calcium in the rock, the exchange is known as direct when the indices are positive. If the ex- change is reverse then the exchange is indirect and the indices are found to be negative. The CAI 1, 2 are calcu- lated for the waters of the study area as given in Table 2. Chloro Alkaline Indices 1, 2 calculations shows that 26% of the groundwater sample is negative and 74% positive ratios. 4. Conclusions Interpretation of hydrochemical analysis reveals that the groundwater in study area is fresh, hard to very hard. The sequence of the abundance of the major ions is in the following order: Ca > Mg > Na > K and HCO3 > SO4 > Cl. Alkali earths slightly exceed alkalis and weak acids exceed strong acids. Falling of water samples in the rock dominance area in Gibbs plot indicates the interaction between rock chemistry and the chemistry of the perco- lating precipitation waters in the sub-surface. The results of calculation saturation index show that the nearly all of the water samples were saturated to undersaturated with respect to carbonate minerals (calcite, dolomite and ara- gonite) and undersaturated with respect to sulfate miner- als (gypsum and anhydrite). In the study area, the domi- nant hydrochemical facieses of groundwater is Ca- HCO3 and Ca-Mg-HCO3. Distribution of the groundwater sam- ples in rectangular diagram reveals that all of the ground- water samples fall under the calcium-magnesium-bicar- bonate category. According to classification of water based on TDS, 87% of samples are belonging to highest desirable category and remaining samples are belonging to maximum permissible category. Irrigation waters clas- sified based on SAR has indicated that 83% of samples belong to the excellent, 11% samples good and remain- ing samples belong to doubtful category. The Wilcox diagram relating sodium percentage and total concentra- tion shows that 26% of the groundwater samples fall in the field of good to permissible and 74% of the ground- water samples fall in the field of excellent to good for irrigation. The analytical data plotted on the US salinity diagram illustrates that 77% of the groundwater samples fall in the field of C2S1, indicating medium salinity and low sodium water. Base on the classification of irrigation water according to the RSC values, all of groundwater samples belongs to the good category. According to PI values, the groundwater of in the study area can be des- ignated as class II (25–75%) that shows the groundwa- ter in study area is suitable for irrigation purposes. As- sessment of water samples from various methods indi- cated that groundwater in study area is chemically suit- able for drinking and agricultural uses. Chloroalkaline Indices 1, 2 calculations shows that 26% of the ground- water sample is negative and 74% positive ratios. The positive values indicate absence of base-exchange reac- tion. 5. Acknowledgements This study was supported by the Islamic Azad University of Urmia. The authors gratefully acknowledge the Azar- baijan Regional Water Authority for supplying the exist- ing relevant data and also wish to thank Ms. Hajilar for the water chemistry analysis. We would like to thank Mr. E. Eliassi for their kindly help during the field visits and the collection of data. REFERENCES [1] P. A. Domenico and F. W. Schwartz, “Physical and chemical hydrogeology,” John Wiley and Sons, New York, pp. 824, 1990. [2] R. A. Freeze and J. A. Cherry, “Groundwater,” Pren- tice-Hall, Englewood Cliffs, NJ, USA, 1979. [3] B. K. Kortatsi, “Hydrochemical framework of groundwa- ter in the Ankobra Basin, Ghana,” Aquatic Geochemistry, Vol. 13, No. 1, pp. 41–74, 2007. [4] Z. Barkic, et al., “Hydrogeology and hydrogeochemistry in the alluvial aquifer of the Zagreb area (Croatia),” Ma- terials and Geoenvironment, Vol. 50, No. 1, pp. 75–78. 2003. [5] A. Elkrai1, O. Kheir, L. Shu, and H. Zhenchun, “Hydro- geology of the northern Gezira area, central Sudan,” Jour- nal of Spatial Hydrology, Vol. 4, No. 2, pp. 11, 2004. [6] N. Aghazadeh and A. A. Mogadam, “Evaluation effect of geological formation on groundwater quality in the Har- zandat plain aquifer,” Symposium of Geosciences of Iran, Vol. 22, pp. 392–395, 2004. [7] M. T. Hossien, “Hydrochemical evaluation of groundwa- ter in the Blue Nile Basin, eastern Sudan, using conven- tional and multivariate techniques,” Hydrogeology Jour- nal, Vol. 12, pp. 144–158, 2004. [8] M. A. Schiavo, S. Havser, G. Gusimano, and L. Gatto, “Geochemical characterization of groundwater and sub- marine discharge in the south-eastern Sicily,” Continental Shelf Research, Vol. 26, No. 7, pp. 826–834, 2006. [9] T. Subramani, L. Elango, and S. R. Damodarasamy, “Groundwater quality and its suitability for drinking and agricultural use in Chithar River Basin, Tamil Nadu, In- dia,” Environmental Geology, Vol. 47, pp. 1099–1110, 2005. [10] C. Guler and G. D. Thyne, “Hydrologic and geologic factors controlling surface and groundwater chemistry in Indian Wells-Owens Valley area, southeastern California, USA,” Journal of Hydrology, Vol. 285, pp. 177–198,  Assessment of Groundwater Quality and its Suitability for Drinking and Agricultural uses in the Oshnavieh Area, Northwest of Iran Copyright © 2010 SciRes JEP 40 2004. [11] E. Vazquez Sunne, X. Sanchez Vila, and J. Carrera, “In- troductory review of specific factors influencing urban groundwater, an emerging branch of hydrogeology, with reference to Barcelona, Spain,” Hydrogeology Journal, Vol. 13, pp. 522–533, 2005. [12] A. Moghaddam and M. Najib, “Hydrogeologic character- istics of the alluvial tuff aquifer of northern Sahand Mountain slopes, Tabriz, Iran,” Hydrogeology Journal, Vol. 14, pp. 1319–1329, 2006. [13] M. Jalali, “Chemical characteristics of groundwater in parts of mountainous region, Alvand, Hamadan, Iran,” Environmental Geology, Vol. 51, pp. 433–446, 2006. [14] E. Khazaei, J. D. Stednick, W. E. Sanford, and J. W. Warner, “Hydrochemical changes over time in the Za- hedan aquifer, Iran,” Environmental Monitoring and As- sessment, 2006. [15] J. D. Hem, “Study and interpretation of the chemical characteristics of natural water,” US Geological Survey Water-Supply Paper, 1970. [16] H. Schoeller, “Geochemistry of groundwater. An interna- tional guide for research and practice,” UNESCO, Chap- ter 15, pp. 1–18, 1967. [17] APHA, “Standard methods for the examination of water and wastewater,” 19th Edition, American Public Health Association. Washington, D.C., pp. 1467, 1995. [18] D. L. Parkhurst and C. A. J. Appelo, “User’s guide to PHREEQC (ver. 2)-A computer program for speciation, batch-reaction, one-dimensional transport, and inverse geochemical calculations,” US Geological Survey Wa- ter-Resources Investment Report, pp. 99–4259, 1999. [19] M. H. Nabavi, “Preface geology of Iran,” (in Persian), Geology Survey Iran, 1976. [20] A. Aghanabati, “Geology of Iran,” (in Persian), Geologi- cal Survey of Iran, pp. 586, 2004. [21] N. Aghazadeh, “Evaluation quality and quantity ground- water of the Oshnavieh plain aquifer,” (in Persian), Is- lamic Azad University of Urmia, Iran, pp. 128, 2007. [22] Azarbaijan Regional Water Authority, “Evalution of groundwater in Oshnavieh and Naghadeh plain,” (in Per- sian) Azarbaijan Regional Water Authority, Urmia, Iran, 2004. [23] C., A., J. Appelo and D. Postma, “Geochemistry, ground- water and pollution,” Balkema, Rotterdam, pp. 536, 1996. [24] A. Bardsen, et al., “Variability in fluoride content of sub- surface water reservoirs,” Acta Odontologica Scandi- navica, Vol. 54, pp. 343–347, 1996. [25] W. W. Wenzel and W. E. H. Blum, “Fluoride speciation and mobility in fluoride contaminated soil and minerals,” Journal of Soil Science, Vol. 153, pp. 357–364, 1992. [26] R. J. Gibbs, “Mechanisms controlling world water chem- istry,” Science, Vol. 17, pp. 1088–1090, 1970. [27] M. Coetsiers and K. Walraevens, “Chemical characteriza- tion of the Neogene Aquifer, Belgium,” Hydrogeology Journal, Vol. 14, pp. 1556–1568, 2006. [28] J. I. Drever, “The geochemistry of natural waters,” Pren- tice-Hall, New Jersey, pp. 436, 1997. [29] D. Langmuir, “Aqueous environmental geochemistry,” Prentice Hall, Inc., pp. 601, 1997. [30] R. Garrels and F. Mackenzie, “Origin of the chemical compositions of some springs and lakes,” In: Ground RF (ed) Equilibrium Concepts in Natural Water Systems, Ameri- can Chemical Society Publications, Washington, 1967. [31] A. M. Piper, “A graphic procedure in the geochemical interpretation of water-analyses,” Transactions, American Geophysical Union, Vol. 25, pp. 914–923, 1944. [32] D. K. Chadha, “A proposed new diagram for geochemical classification of natural water and interpretation of chemical data,” Hydrogeology Journal, Vol. 7, pp. 431– 439, 1999. [33] WHO, “Guideline to drinking water quality,” World Health Organization, Geneva, pp. 186, 1983. [34] WHO, “Guidelines for drinking water quality,” Recommenda- tions, World Health Organization, Geneva, Vol. 1, pp. 130, 1984. [35] G. N. Sawyer and D. L. McCartly, “Chemistry of sanitary engineers,” 2nd ed., McGraw Hill, New York, pp. 518, 1967. [36] S. Srinivasa Gowd, “Assessment of groundwater quality for drinking and irrigation purpose: A case study of Ped- davanka watershed, Anantapur District, Andhra Pradesh, India,” Environmental Geology, Vol. 48, pp. 702–712. 2005. [37] N. J. Raju, “Hydrogeochemical parameters for assessment of groundwater quality in the upper Gunjanaeru River ba- sin, Cuddapah District, Andhara Pradesh, South India,” Environmental Geology; 2006. [38] US Salinity Laboratory, “Diagnosis and improvement of saline and alkali soils,” Agricultural Handbook, USDA, No. 60, pp. 160, 1954. [39] K. R. Karanth, “Groundwater assessment, development and management,” Tata McGraw Hill, New Delhi, pp. 720, 1987. [40] L. A. Richards, “Diagnosis and improvement of saline alkali soils: Agriculture,” Handbook, US Department of Agriculture, Washington DC, Vol. 160, pp. 60, 1954. [41] L. V. Wilcox, “Classification and use of irrigation water,” USDA, Circular, Washington, DC, USA, pp. 969, 1955. [42] F. M. Eaton, “Significance of carbonate in irrigation wa- ter,” Soil Science, Vol. 69, No. 2, pp. 123–133, 1950. [43] H. M. Ragunath, “Groundwater,” Wiley Eastern Ltd., New Delhi, pp. 563, 1987. [44] WHO, “Health guidelines for the use of wastewater in agriculture and aquaculture,” Report of a WHO Scientific Group-Techni- cal Report Series 778, WHO Geneva, pp. 74, 1989. [45] J. C. V. Aastri, “Groundwater chemical quality in river basins, hydrogeochemical facies and hydrogeochemical modeling,” Bharathidasan University, Thiruchirapalli, Tamil Nadu, India, 1994. [46] H. Schoeller, “Geochemistry of groundwater,” In: Groundwater Studies-An International Guide for Re- search and Practice, UNESCO, Paris, pp. 1–18, 1977. |