Journal of Biomedical Science and Engineering
Vol.6 No.3A(2013), Article ID:29598,9 pages DOI:10.4236/jbise.2013.63A053
The influence of the blood pressure on the venous cerebral flow measured by magnetic susceptibility (SWI) technique
![]()
1 Department of Sciences, Radiations and Technologies, Scientific Area of Radiology from Polytechnic Institute, Lisbon, Portugal
2Anatomy Department, Medical Sciences Faculty of Lisbon, Lisbon, Portugal
3Imaging Department, Lusíadas Hospital, Lisbon, Portugal
4Department of Exact Sciences, Scientific Area of Mathematic from Polytechnic Institute, Lisbon, Portugal
Email: *margarida.ribeiro@estesl.ipl.pt
Received 19 January 2013; revised 25 February 2013; accepted 3 March 2013
Keywords: Blood Pressure; Susceptibility; Normotensive; Hypertensive; Magnetic Resonance
ABSTRACT
Susceptibility Weighted Image (SWI) is a Magnetic Resonance Imaging (MRI) technique that combines high spatial resolution and sensitivity to provide magnetic susceptibility differences between tissues. It is extremely sensitive to venous blood due to its iron content of deoxyhemoglobin. The aim of this study was to evaluate, through the SWI technique, the differences in cerebral venous vasculature according to the variation of blood pressure values. 20 subjects divided in two groups (10 hypertensive and 10 normotensive patients) underwent a MRI system with a Siemens® scanner model Avanto of 1.5T using a synergy head coil (4 channels). The obtained sequences were T1w, T2w-FLAIR, T2* and SWI. The value of Contrast-to-Noise Ratio (CNR) was assessed in MinIP (Minimum Intensity Projection) and Magnitude images, through drawing free hand ROIs in venous structures: Superior Sagittal Sinus (SSS) Internal Cerebral Vein (ICV) and Sinus Confluence (SC). The obtained values were presented in descriptive statistics-quartiles and extremes diagrams. The results were compared between groups. CNR shown higher values for normotensive group in MinIP (108.89 ± 6.907) to ICV; (238.73 ± 18.556) to SC and (239.384 ± 52.303) to SSS. These values are bigger than images from Hypertensive group about 46 a.u. in average. Comparing the results of Magnitude and MinIP images, there were obtained lower CNR values for the hypertensive group. There were differences in the CNR values between both groups, being these values more expressive in the large vessels-SSS and SC. The SWI is a potential technique to evaluate and characterize the blood pressure variation in the studied vessels adding a physiological perspective to MRI and giving a new approach to the radiological vascular studies.
1. INTRODUCTION
Magnetic Resonance Imaging (MRI) has completely revolutionized the field of Neuroimaging. It has been commonly used in the diagnosis and monitoring of diseases, providing structural and morphological imaging, allowing the visualization of detailed anatomy [1-3].
The MRI technique by Susceptibility Weighted Imaging (SWI) combines high spatial resolution and extreme sensitivity to magnetic susceptibility differences between tissues, producing a final contrasted image revealing itself extremely sensitive to venous blood, hemorrhage and iron deposits. This adds a physiological perspective to magnetic resonance images in the form of venous vascular map [1-3].
This technique was developed in 1997 by Mark Haacke, Reichenbach and colleagues, although it has been only applied to clinical practice in 2007 [4,5].
Although this technique is in constant development, it has several clinical applications including the detection of trauma associated hemorrhages, strokes, brain tumors, neurodegenerative diseases and Sturge-Weber syndrome [6-10].
Hypertension (HT) is a clinical entity and corresponds to an increase of the values in the blood pressure. For purposes to limit the population of this study, the expression values of systolic blood pressure must be ≥140 mm Hg (millimeters of mercury) and/or the diastolic blood pressure values above 90 mmHg [11,12]. About 90% of hypertension cases do not present a specific cause, while the remaining 10% may be related with diseases such as sleep apnea, chronic kidney disease, vascular kidney hypertension, Cushing’s syndrome or aortic coarctation. Genetics factors and age are aspects that may contributing to the almost 2/3 of the people over 65 years old are hypertensive [3]. According to the study “Prevalence of Hypertension” in our country performed by Eurotrials, they were registered the following results: subjects younger than 35 years had a prevalence of 12.1%, subjects between 35 and 64 years had a prevalence of 44.6% while subjects over 64 years old had a prevalence of 63.3%. Therefore it is observed that HT is a reality around world with impact over all age groups with major expression in the south of Europe [13].
Regarding these figures and with a population of about two million hypertensives in the mainland, our purpose is to carry out a comparative imaging study, using the potentialities of SWI (Susceptibility Weighted Images) by Magnetic Resonance [12]. Thus, the purpose of this study was to evaluate, through the SWI technique, the differences in cerebral venous vasculature according to the variation of blood pressure values. The goal was reached by measuring the value of Contrast-to-Noise Ratio (CNR) in the following anatomic structures: Superior Sagittal Sinus, Internal Cerebral Vein and Sinus Confluence also called Herophili Torcula. Through these structures, the variation of the hypertension expressed by the MR signal will be demonstrated by the SWI.
1.1. Biophysics of the Blood
The blood flow is divided into two circuits: the small circulation, where the blood makes the re-oxygenation (increase of oxygen content) and where the systemic circulation occurs, is responsible for the perfusion and the supply of oxygen and nutrients to the cells of different tissues. Through the complex oxy-deoxyhemoglobin, the oxygen is carried into the different tissues, allowing their oxygenation. When the oxygen molecule is linked to the hemoglobin it is designated as oxyhemoglobin. However, in order to the tissue oxygenation may occur, the oxygen should dissociate from the hemoglobin to form deoxyhemoglobin. The oxygen consumption rates have distinct values for each organ, e.g. in the brain, the oxygen consumption rate is considerably high, as it is required a continuous neuronal function for the activity of different mechanisms in the human body. In order that brain cells keep oxygen continuously, the circulatory system must be able to deliver enough quantities of blood in accordance with the needs of the tissues for each moment [14].
The blood distribution begins with the cardiac diastole, followed by the cardiac systole. This variation generates differences in the blood pressure, causing the blood transport from the high pressure regions to the low pressure regions, yielding the blood flow. When this pressure increases, the opposite resistance in the vessel’s wall also increases, decreasing the blood flow. Due to the lack of oxygen many tissues undergo hypoxia, and thus the oxygen content existing in the bloodstream decreases, increasing the amount of deoxyhemoglobin [14,15].
1.2. Physiological Effects of Hypertension
The clinical relevance of Blood Pressure depends on two hemodynamic variables: cardiac output and total peripheral resistance of the vascular net. The cardiac output is influenced by the blood volume pumped by the heart, while the peripheral resistance is predominantly determined by the small blood vessels. The peripheral resistance also depends on the vessel lumen dimension, the wall thickness of the arteries and the neural and hormonal influences which affect the distension or constriction of these vessels. Hypertension appears when changes occur on the relationship between blood volume and total peripheral resistance, damaging the endothelial cells and consequently weakening the vessels [16]. Under these changes two mechanisms occur: Arteriosclerosis (enlargement and stiffness increase of the vessel walls) and Atherosclerosis (narrowing of blood vessels through the deposition of atheromatous plaques) [16,17]. When one of these situations occurs, the blood flow supply to different organs is affected. In case of the blood flow being blocked at the brain, its nutritive functions became affected and therefore it is not capable of performing its main functions. When this happens, ischemic events can occur and temporarily block the blood flow to the brain due to arteries narrowing or blockage, which can cause Mild Cognitive Impairment (MCI) [18-21]. Functional changes may occur on the structures responsible for the control of autonomic/independent reflexes, reducing the capability for self-regulation of cerebral blood flow [14, 21,22].
These changes may be intensifying from different risk factors: obesity and poor diet, emotional stress, alcohol ingestion, sedentary life and smoking [17]. Due to the vessels resistance caused by the above mechanisms, tissue oxygenation is not performed effectively resulting in the oxygen-hemoglobin not fully decomposed and therefore the oxygen that reaches the cell is reduced, leading to hypoxia. After the tissue oxygenation, hemoglobin loses the oxygen element, designating itself afterwards as deoxyhemoglobin [14,15,18].
The (Figure 1) illustrates the physiological HT effect on the content of oxyhemoglobin and deoxyhemoglobin in the venous vasculature.
1.3. SWI (Susceptibility Weighted Image)
The SWI is a technique that exploits the magnetic susceptibility differences between different tissues in order to generate a unique type of contrast different from of the other MRI techniques [5,20].
It consists of the combination of T2* magnitude im-
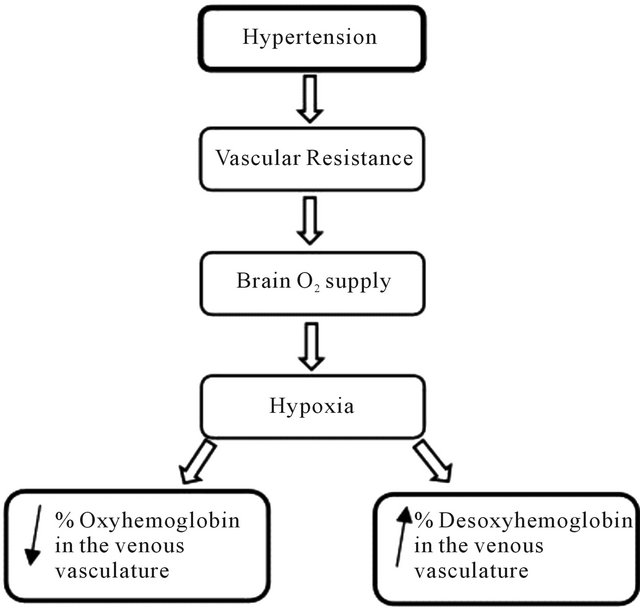
Figure 1. Flow chart representing the effect of hypertension over venous vasculature.
ages and phase filtered images through a flow compensation in all directions with a high resolution, and a 3D gradient echo to create a new type of contrast. This contrast emphasizes the magnetic susceptibility differences between the various tissues and substances increasing the differentiation among them [23]. The phase images obtained show local susceptibility differences between the different tissues, allowing the measurement of the iron content [5]. However, it is typical in these images to possess a high noise and inhomogeneities (due the air/tissue interfaces and B0 effects), therefore the resulting data requires a high-pass filter, showing the susceptibility differences between the tissues [24,25].
First the process of data processing shows a phase mask from the filtered phase images. Then it is multiplied with the magnitude images and applied a MinIP, obtaining the final SWI image, increasing the conspicuity of smaller caliber veins and other sources of susceptibility effect [26-28] (Figure 2).
Most iron compounds are paramagnetic. They are substances able to generate a small magnetic field in the same direction of the existing magnetic field (B0), increasing its intensity. This is due to the fact that these substances possess unpaired electrons that originate local magnetic fields of lesser intensity that are associated with the external magnetic field, increasing it [29].
The magnetic susceptibility differences between oxyhemoglobin and deoxyhemoglobin are an important enabling factor for the SWI phenomena. The magnetic susceptibility is the variable that measures the behavior of a substance subjected to the action of a B0 magnetic field [29,30]. In the presence of this field, the substances may be paramagnetic or diamagnetic. They will be diamag-
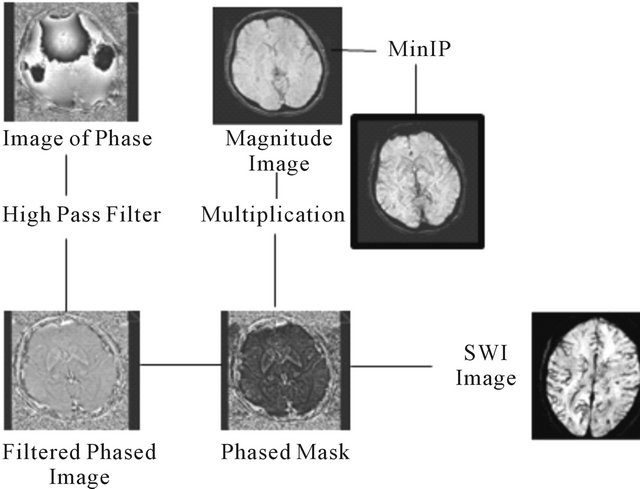
Figure 2. Scheme of the SWI process (from Toshi M., et al.) [23].
netic if they promote a magnetic field in opposite direction to B0, resulting in a decrease of the total area of magnetic field. The oxyhemoglobin assumes this behavior creating a magnetic field in the opposite direction.
On the other hand they may increase the intensity of the area’s total magnetic field, designating themselves as paramagnetic compounds such as deoxyhemoglobin [28,29]. These properties are on the basis of the basic concept of venographic effect MRI BOLD (Blood Oxygen Level Dependent), wherein the SWI represents an evolution of the technique. This consists of the use of paramagnetic properties of deoxyhemoglobin and T2* prolonged effect of the venous blood as intrinsic contrast agent, obtaining a difference phase between vessels containing deoxygenated blood and adjacent brain tissue, canceling the difference in the signal intensity among both [11]. The added SWI phase image will allow the observation of very small dimension blood vessels [11, 31,32]. Thus, the venous vasculature appears hypointense, with high resolution (reduced slice thickness). For ideal viewing and analysis it should be applied minimum intensity projections [33].
2. METHODS
The experimental component of the study was carried out between May and August and was focused over a set of subjects having the criteria on study: hypertension (sample) and a set of normotensive subjects (the control group) [34].
The study consists of the changes in images under the Hypertension’s variation effect by the SWI technique. In the beginning of the research process, it was performed an anatomical and radiological characterization of the brain of the postmortem specimens fixed with a Diethyleno Glycolb alcohol. According to the obtained sequences, the 8 skulls undergone to MR did not show any signs of blood flow or susceptibility in the parenchyma. The images were acquired at level of intercommissural plan (Figure 3). The selection was made and determined the location of the anatomical structures under evaluation in the next phase of the study. The parameters of acquisition applied and weighted were: T1w SAG (TR: 583 ms; TE: 9 ms); T1w TRS (TR: 583 ms; TE: 9 ms); and T2 FLAIR TRS (TR: 7572; TE: 120 ms; TI: 2000 ms). The others parameters were equal from all sequences: Number of slices (20); Slice thickness (6 mm); Flip Angle (90˚); Matrix (256 square) and FOV (220 mm).
Sample
The inclusion criteria were targeted to two groups: 1-all the people with no brain pathologies and normal blood pressure values and 2-all the people with no brain pathologies and higher values of blood pressure. It was an intentional non probabilistic sample selection, since the individuals were approached in specific locations, including the National Society of Hypertension. Into a data collect period it was gathered a sample of 20 subjects (10 normotensive and 10 hypertensive). The age range was between 18 and 70 years old (mean of 35), from both genders.
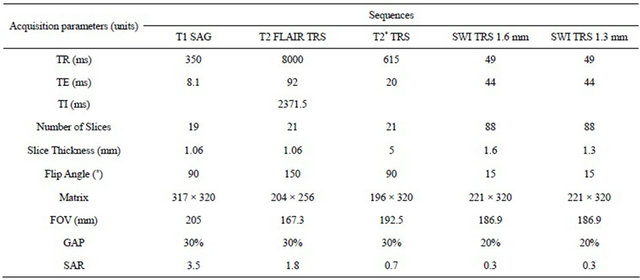
The volunteers who were invited to participate in the study met the following conditions: possessing no history of neurological conditions and not consuming any stimulant at least in the 6 hours before the exam. Regarding the hypertensive group, they were deprived of medication for at least 12 hours to ensure the real physiological effects of hypertension and they would possess blood pressure exceeding 140/90 mmHg [10, 35,36]. It was conducted a survey to register the individual variables and clinical history that might affect the results. In order to safeguard the ethical issues, a form was filled in which each participant signed their informed consent. In this document the subjects were informed about the MRI safety procedures. In order to safeguard the safety and welfare of the volunteers all the examinations were performed according to the safety guidelines from “Device Bulletin Safety Guideline for Magnetic Resonance Imaging Equipment in Clinical Use” [37]. Immediately before performing the brain MRI, all volunteers were undergone the blood pressure and heart rate measured. The images were obtained by an MR scanner Siemens® model Avanto with 1.5 T of the main magnetic field. It was used a head standard coil with 4 channels following the protocol outlined in Table 1.
The images underwent a process of quantitative analysis in magnitude and MinIP images using the software Leonardo Syngo 2004. The CNR was assessed by draw-
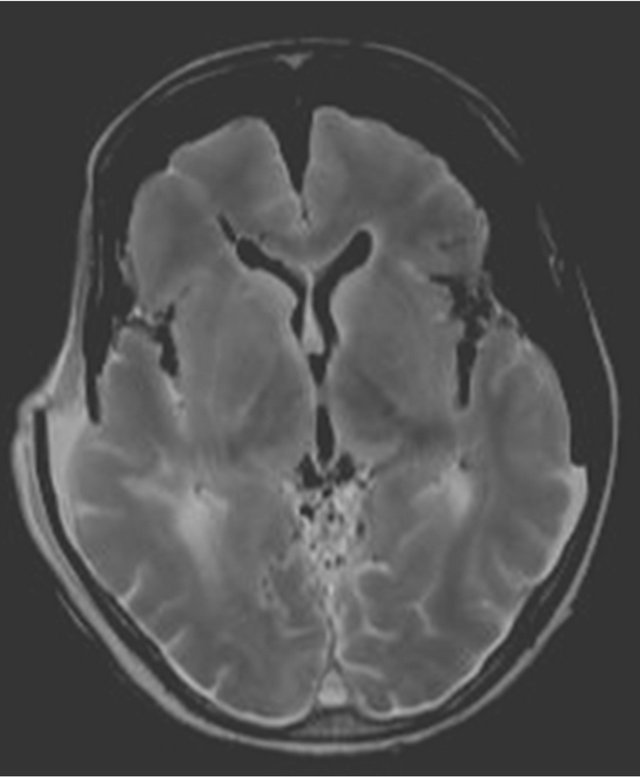
Figure 3. Image of the 6th specimen obtained with T1W sequence at transverse plan.
Table 1. Parameters of protocol acquisition.
ing one free hand ROI in the magnitude and MinIP images in the following vascular structures: superior sagittal sinus (SSS), internal cerebral vein (ICV) and sinus confluence (SC), since these venous structures have larger diameter and are easily identified.
In this way it were obtained the mean values of measured contrast in the selected areas, allowing subsequently correlation of the CNR (contrast-to-noise ratio) and the imaging signs of hypertension. To guarantee the inclusion of the selected structure in the ROIs and rise the accuracy of the measurements, it was defined a standard deviation of ≤10%. To give reproducibility, the ROI’s characteristics were kept by drawing all exactly at the same anatomic location, with the same size and shape. From each ROI was produced one label with the values measured.
Two sequences of SWI images were acquired, one with 1.3 mm of slice thickness and the second with 1.6 mm. The data of CNR were assessed according to Toshi Matshushita et al. method: [23].
The values obtained were submitted to the statistical analysis, being calculated the mean values and standard deviation of the signal for the 4 distinct areas in each group, in the MinIP and Magnitude images. The values were presented through box-and-whiskers-plot graphs and were made a comparison between the signal values and CNR measure.
3. RESULTS AND DISCUSSION
Based on the ROI’s values and statistic analysis, the results show the mean value and standard deviation of the CNR value in the normotensive and hypertensive volunteers.
It was observed that the CNR values in the NT (normotensive group) are higher than the HT (hypertensive group) values, in both Magnitude and MinIP images to the Superior Sagittal Sinus structure (Figures 4 and 5). In the Magnitude images the mean values of the NT are 374.8 ± 32.707 au (arbitrary units), while for the HT its mean value corresponds to 266.92 ± 39.602 au. Regarding the MinIP image, the NT has a mean value of 239.384 ± 52.303 au while the HT has 26.949 ± 161.69 au.
Regarding the variation of CNR values for the ICV, they are CNR values are higher in the NT in both image types. In the Magnitude images, the values of the NT are 158.26 ± 16.745 au, while the values of HT are 127.49 ± 23.07 au. In the MinIP images the NT values are 108.89 ± 6.907 au, while the HT values are 81.14 ± 18.316 au.
Through the analysis, it appears that the average CNR is higher in the NT on both image types. In the magnitude images, the NT has a mean value of 323.43 ± 18.556 au, whereas the HT has a mean value of 227.75 ±
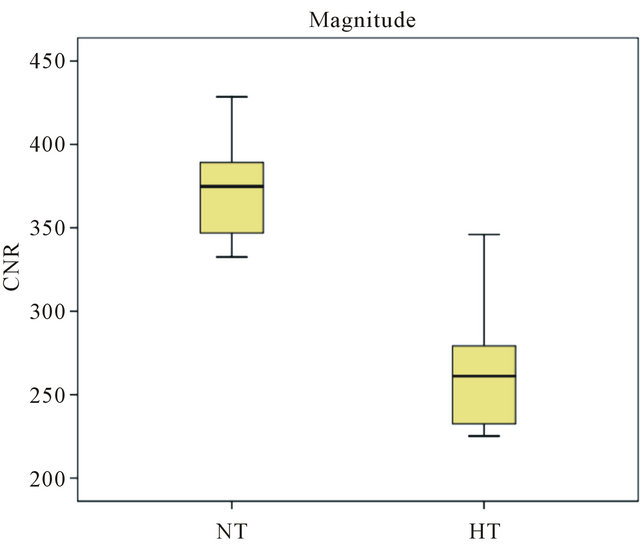
Figure 4. Magnitude and MinIP graph from the values of CNR in SSS for normotensive group.
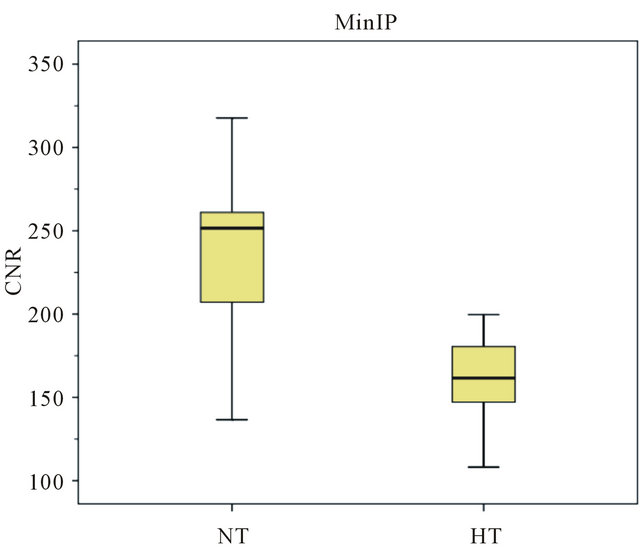
Figure 5. Magnitude and MinIP graph from the values of CNR in SSS for hypertensive group.
34.427 au. Regarding the MinIP images, the mean values for the NT are 238.73 ± 18.556 au and for the HT are 133.47 ± 20.527 au.
From the observational component it was concluded that those from the HT values decreased in the SSS and the SC in MinIP images. While the MinIP images from the NT in the SSS had a mean value of 239.384, the HT had a mean value of 161.69 (difference of 77.694 points). In the SC, the NT had a mean value of 238.73 and the HT had 133.47 (difference of 105.26 units).
The literature state that hypertension by changing the pressure in the vessels makes the metabolism ineffective because occurs a reduction of oxygen supply to the brain, resulting in hypoxia and consequently increasing the percentage of deoxyhemoglobin in the venous vasculature. In this way it was proceeded a quantitative assessment of the venous vasculature of the brain. For this analysis it was used Magnitude and MinIP images. Such images have proved to be extremely sensitive to venous blood [1-3,5].
Initiating the analysis on the Superior Sagittal Sinus, it is observed that the values of the NT (normotensive group) are higher than the HT (hypertensive group) values. In the first group, it is presented a maximum CNR value of 428.5, a minimum CNR value of 332.5 and a median of 374.8 while the second group has a minimum value of 225.2, a maximum of 346 and a median of 261.1. It can be noted that the HT maximum value exceeds the NT minimum value, approaching the mean value of this group (374.8 ± 32.707). The corresponding values of the HT have a higher dispersion in comparison with the NT. Regarding the MinIP results, the NT values are slightly increased in what concerns to the HT values and show a considerable scatter since they present a minimum value of 136.6, a maximum value of 317.7 and a median of 251.6. This scattering was due to the fact that different individuals possess different metabolisms and oxygen concentrations in the blood. This may originate physiological changes which influence the blood flow in the different vessels and therefore signal loss in SWI images [38-40].
Considering the ICV it was observed that in the magnitude images the values around the NT mean value, although slightly higher than the HT values, are very close to the values of this group. In the NT, the CNR maximum value is 196, the minimum value is 136.3 and the median is 374.8, while in the HT it is observed a minimum value of 98.3, a maximum value of 159.5 and a median of 261.1. According to these values, the HT maximum value is higher than the average (158.26 ± 16.745) of the NT, and the NT minimum value is close to the average values of the HT. Regarding the MinIP image the core values are slightly apart, being the NT values higher than the HT. However, this difference of values is minimal considering that the range magnitude is below the remaining ones presented. It is also possible to see that the HT maximum value is at the same level as the NT maximum value (115.6 and 116.9). A possible explanation may be considered as the CNR values in this venous structure are inferior because this is a small dimension structure, and therefore the lumen is also smaller, reducing the blood flow [41,42].
Performing the analysis of the images from the SC, it can be seen that in the Magnitude graph the NT values are higher than the HT values and with no value overlapping, being all HT values lower than the NT values. It appears that the HT values are more dispersed than the NT values, the first group having a minimum value of 180.8, a maximum of 290 and a median of 152.45 and the second group a minimum value of 295, a maximum value of 355.1 and a median of 120.75. For the HT, it is observed that 50% of the individuals have CNR values near 200, while the remaining 50% have values between 200 and 300. Regarding the NT, this group has greater value concentration being the range from 300 to 355.1. Concerning to the MinIP image it is apparent that the NT values are higher than the HT values, with no value overlapping, since the HT has a maximum of 148.4 and the NT has a minimum of 103.2. It should be noted that although the average of CNR values presented by both groups were quite different, the values of the HT had a lower dispersion compared with the NT, where most individuals present mean values between 150 and 100. Regarding the NT it is apparent the presence of an outlier (95.4) that may be justified by the reduced signal in the structure evaluated. For the HT, it is also presented an outlier (184.4), which may be justified by the strong consistency of the remaining sample results. This value appears when was drawn the ROI in the lumen of the structure, having a high signal in comparison with other venous structures. Thus, it is possible to acknowledge that in the large caliber venous vascular structures, the CNR values decreased significantly.
This study had some limitations. The small sample size may influence the obtained results. Ideally the age of subjects as well as their biotype should be similar. The morphological variables inherent to each individual patient and in particular, the vascular map and the vessels caliber may also influence the results [40,42,43]. Likewise, the blood pressure values of both groups should be located at shorter intervals [41-44].
Before performing the MRI, it was carried out blood pressure measurements during the period when the subjects were not under the effect of medication. Contrary to expectations, there were blood pressure values lower than expected. Such variation of arterial tension is due to the fact that the subjects underwent different medications. The active principles and the duration of the different types of existing medications within the HT (diuretics, beta blockers and angiotensin II) could have influenced the blood pressure values of the HT subjects and consequently their vascular map at the time of image acquisition. Despite the control time period in medication withdrawal, it was impossible to accurately control the physiological effects, as different drugs have different actuation times and half-life [15,16,36,42].
It was verified a change in the magnetic field at different times of the data collection leading to a fluctuations inherent of the field and equipment fail. This factor influenced the acquired images as to its noise and its signal. The use of a phantom before proceeding to data collection would be useful in reducing these effects in the image [43-45].
4. CONCLUSIONS
Hypertension is a syndrome that causes changes in the caliber of blood vessels affecting the blood supply to the organs. In this way deoxyhemoglobin levels increase mainly in the venous vasculature. With the use of new MRI sequences it is possible to take advantage of the susceptibility phenomena to give us an image of the cerebral vasculature mainly in the venous circulation due to the presence of deoxyhemoglobin [46]. As proposed, it was proceeded a quantitative assessment of CNR in three different anatomic structures, in a population of normotensives and hypertensives. Despite some limitations achieved, it was possible to obtain results that help us to understand the changes in susceptibility MR image (SWI) arising from changes in blood pressure. In larger caliber vessels, such as the superior sagittal sinus and Sinus Confluence it was concluded that the CNR value of the MinIP images in the hypertensive group decreased, being higher this decrease on SC (77.694 < 105.26). Achieved the aim of the study through the quantitative measurement of CNR, they were observed differences in the CNR value between small and large diameter of vessels.
As expected, an increase of the blood pressure values correspond to a reduction in the caliber of the blood vessels which follows, in accordance with the physiological principles, in trade reduction between oxy and deoxyhemoglobin among the brain tissue crossed by vascular structures [16]. Coupled with this effect, decreasing blood vessel diameter consequently decreasing of the cerebral blood flow justifies the lower CNR values found in hypertensive’s patients.
It is suggested further development of this investigation as a continuation of this study, using a larger number of subjects. It is also suggested as future research development a continuation of this sample restricting it to only one age group, and within known limits of blood pressure variation on both groups.
The SWI is a potential technique to evaluate and characterize the blood pressure variation in the studied vessels adding a physiological perspective to MRI and giving a new approach to the vascular assessment by imaging.
5. ACKNOWLEDGEMENTS
The authors are grateful to the volunteers and to the Imaging Department of Lusíadas Hospital to the availability on the images access and data collection.
![]()
![]()
REFERENCES
- Vilela, P., Conceição, C. and Teresa, P. (2009) Experiência inicial com a técnica de susceptibility-weighted imaging em ressonância magnética. Acta Médica Portuguesa, 22, 142.
- Haacke, E.M. (2006) Susceptibility weighted imaging opening new doors to clinical applications of magnetic resonance imaging. Wayne State University, Detroit.
- Khan, N. and Zafar Sajjad, Z. (2008) Susceptibilityweighted imaging resonance imaging. Frontiers of the technology. Pakistan Journal of Neurology Science, 3, 27- 31.
- Shetty, N.R. (2006) MR susceptibility weighted imaging and clinical applications. University of Texas at Arlington, Arlington.
- Haacke, E.M., Mittal, S., Wu, Z., Neelavalli, J. and Cheng, Y.C. (2009) Susceptibility-weighted imaging: Technical aspects and clinical applications, part 1. American Journal of Neuroradiology, 30, 19-30. doi:10.3174/ajnr.A1400
- Santhosh, K., Kesavadas, C., Thomas, B., Gupta, A.K., Thamburaj, K. and Kapilamoorthy, T.R. (2009) Susceptibility weighted imaging: A new tool in magnetic resonance imaging of stroke. Clinical Radiology, 648, 74-63. http://www.ncbi.nlm.nih.gov/pubmed/19070701 doi:10.1016/j.crad.2008.04.022
- Barnes, S. and Haacke, E.M. (2009) Setting properties of venous blood demonstrated in the peripheral vasculature using susceptibility-weighted imaging (SWI). Journal of Magnetic Resonance Imaging, 29, 1465-1470. http://www.ncbi.nlm.nih.gov/pubmed/19472423 doi:10.1002/jmri.21791
- Mittal, S., Wu, Z., Neelavalli, J. and Haacke, E.M. (2009) Susceptibility-weighted imaging: Technical aspects and clinical applications, part 2. American Journal of Neuroradiology, 30, 232-252. doi:10.3174/ajnr.A1461
- Haacke, M. (2007). A new MRI protocol for acquired brain injury: Perfusion Weighted Imaging (PWI), Susceptibility Weighted Imaging (SWI), and Diffusion Tensor Imaging (DTI). Annual BIA of Michigan Conference, 28 September 2007.
- European Society of Cardiology (2007) Recomendações de Bolso da ESC: Hipertensão arterial. http://www.spc.pt/DL/AreaCientifica/Recomendacoes/AF_POCKET_HIPERTENSAO.pdf
- Gasparotti, R., Pinelli, L. and Liserre, R. (2011) New MR sequences in daily practice: Susceptibility weighted imaging. Insights Imaging, 2, 335-347. doi:10.1007/s13244-011-0086-3
- Ministério da Saúde. Portal da Saúde (2006) Hipertensão arterial. http://www.min-saude.pt/
- Eurotrials (2005). Saúde em mapas e números. Boletim informativo no. 19. http://www.eurotrials.com/contents/files/Boletim_19.pdf
- Seeley, R. (2007) Anatomia & fisiologia. 6th Edition, Lusociência, 752-767.
- Ministério da Saúde (2011) Administração Central do Sistema de Saúde. Hipoxia, Hipoxemia. Portal da Codificação Clínica e do GDH. http://portalcodgdh.min-saude.pt/index.php/Hipoxia,_Hipoxemia
- Thom, S. (1997) Arterial structural modifications in hypertension: Effect of treatment. European Heart Journal, E2-E4. doi:10.1016/S0195-668X(97)90001-4
- Molina, M., Cunha, R., Herkenhoffl, L. and Mill, J. (2003) Hipertensão arterial e consumo de sal em população urbana. Revista de Saúde Pública, 37, 743-750.
- Pereira, F. and Sargento, L. (2007) Hemoglobinas normais e anormais—Drepanocitose. Actas de Bioquímica, 8, 125-131.
- Medicines and Healthcare Products Regulatory Agency (2010) Device bulletin.
- Reichenbach, J.R., Venkatesan, R., Schillinger, D.J., Kido, D.K. and Haacke, E.M. (1997) Small vessels in the human brain: MRVenography with deoxyhemoglobin as an intrinsic contrast agente. Radiology, 204, 272-277. http://www.ncbi.nlm.nih.gov/pubmed/9205259
- High blood pressure dangers: Hypertension’s effects on the body (2011). http://www.mayoclinic.com/health/high-blood-pressure/HI00062
- Krieger, E., Irigoyen, M. and Krieger, J. (1999) Fisiopatologia da hipertensão. Revista da Sociedade de Cardiologia do Estado de São Paulo, 1, 1-7.
- Matsushita T., Anami, D. and Arioka, A. (2008) Basics study of susceptibility-weighted imaging at 1.5T. Acta Medica Okayama, 62, 159-168. http://www.lib.okayama-u.ac.jp/www/acta/pdf/62_3_159.pdf
- Denk, C. and Rauscher, A. (2010) Susceptibility weighted imaging with multiple echoes. Journal of Magnetic Resonance Imaging, 31, 185-191. doi:10.1002/jmri.21995
- Haacke, E.M., Lai, S., Yablonskiy, D.A. and Lin, W. (1995) In vivo validation of the bold mechanism: A review of signal changes in gradient echo functional MRI in the presence of flow. International Journal of Imaging Systems and Technology, 6, 153-163. doi:10.1002/ima.1850060204
- Bejoy, T., Sivaraman, S. and Krishnamoorthy, T. (2008) Clinical applications of susceptibility weighted MR imaging of the brain—A pictorial review. Diagnostic Neuroradiology, 50, 105-116.
- Reichenbach, J.R. (2005) Recent advances in SWI. http://www.die.upm.es/costb21/docs/MeetingMar2005/WG1 Szeged Pres.pdf
- Sedlacik, J., Kutschbach, C., Rauscher, A., Deisturg, A. and Reichenbach, J.R. (2008) Investigation of the influence of carbon dioxide concentrations on cerebral physiology by susceptibility-weighted magnetic resonance imaging (SWI). Neuroimage, 43, 36-43. http://www.sciencedirect.com/science/article/pii/S1053811908007957 doi:10.1016/j.neuroimage.2008.07.008
- Saini, S., Frankel, R.B., Stark, D.D. and Ferrucci, J.T. (1988) Magnetism: A primer and review. American Journal of Roentgenology, 150, 735-743. doi:10.2214/ajr.150.4.735
- Haddar, D., Haacke, E.M., Shegal, V., Delproposto, Z., Salamon, G., Seror, O., et al. (2004) L’imagerie de susceptibilité magbétique: Théorie et applications. Journal of Radiology, 85, 1901-1908. http://www.sciencedirect.com/science/article/pii/S0221036304977591 doi:10.1016/S0221-0363(04)97759-1
- Ayaz, M. and Haacke, M. (2008) Defining and categorizing microbleeds (MB) in neurodegenerative disease using SWI. International Society for Magnetic Resonance in Medicine, 16, 2183.
- Budde, J.S., Pohmann, R., Shajan, G. and Ugurbil K. (2009) Susceptibility weighted imaging of human brain at 9.4T. International Society for Magnetic Resonance in Medicine, 17, 43. http://cds.ismrm.org/protected/09MProceedings/files/00043.pdf
- Ge, Y., Barnes, Heller, S., Xu, Y., Chen, Q., et al. (2008) 3D high resolution susceptibility weighted imaging (SWI) venography at 3T and 7T. International Society for Magnetic Resonance in Medicine, 16, 1996.
- Sardanelli, F. and Di Leo, G. (2009) Biostatistics for radiologists: Planning, performing, and writing a radiologic study. Springer, Berlin.
- Pimenta, E. (2008) Hydrochlorothiazide vs. chlorthalidone: All thiazides are the same? Revisata Brasileira Hipertensão, 15, 166-167.
- Ribeiro, J. (2002) Inibidores da enzima conversora da angiotensina e bloqueadores de receptores da angiotensina II no tratamento da hipertensão arterial. Revista Brasileira Hipertensão, 5, 69-72.
- MHRA. Department of Health (2007) Device bulletin. Safety guidelines for magnetic resonance imaging equipment in clinical use. http://www.mhra.gov.uk/home/groups/dts-iac/documents/publication/con2033065.pdf
- Zivadinov, R., Poloni, G.U., Marr, K., Schirda, C.V., Magnano, C.R. and Carl, E. (2011) Decreased brain venous vasculature visibility on susceptibility-weighted imaging venography in patients with multiple sclerosis is related to chronic cerebrospinal venous insufficiency. BMC Neurology, 11, 128. doi:10.1186/1471-2377-11-128
- Nathan, A. and Singer, M. (1999) The oxygen trail: Tissue oxygenation. British Medical Bulletin, 55, 95-108. doi:10.1258/0007142991902312
- Hart, M.N. Heistad, D.D. and Brody, M.J. (1980) Effect of chronic hypertension and sympathetic enervation on wall/lumen ratio of cerebral. Journal of the American Heart Association, 2, 419-423.
- Harder, S. and Hopp, K. (2008) Mineralization of the deep gray matter with age: A retrospective review with susceptibility-weighted MR Imaging. American Journal of Neuroradiology, 29, 176-183. doi:10.3174/ajnr.A0770
- Bortolotto, L. and Consolim-Colombo, F. (2009) Adrenergic betablockers. Revista Brasileira Hipertensão, 16, 215-220.
- Haacke, M. and Garbern, J. (2010) Iron stores and cerebral veins in Ms studied by susceptibility weighted-imaging. International Angiology, 29, 149-157. http://www.ccsvi-lombardia.org/wordpress/wp-content/uploads/2011/12/09-2502-ANGY.pdf
- Johansson, B. and Fredriksson, K. (1985) Cerebral arteries in hypertension: Structural and hemodynamic aspects. Journal of Cardiovaculars Pharmacology, 7, 90-93. doi:10.1097/00005344-198507002-00017
- Haacke, E., Xu, Y., Cheng, Y. and Reichenback, J. (2004) Susceptibility Weighted Imaging (SWI) imaging. Magnetic Resonance in Medicine, 52, 612-618. http://www.ncbi.nlm.nih.gov/pubmed/15334582
- Moratal, D., Vallés-Luch, A., Marti-Bonmati, L. and Brummer, M.E. (2008) k-space tutorial: An MRI educational tool for a better understanding of k-space. Biomedical Imaging and Intervention Journal, 4, e15.
NOTES
*Corresponding author.