iBusiness
Vol.3 No.2(2011), Article ID:5462,7 pages DOI:10.4236/ib.2011.32030
An Integrated Forward/Reverse Logistics Network Optimization Model for Multi-Stage Capacitated Supply Chain
![]()
Department of Industrial Engineering, Iran University of Science and Technology (IUST), Tehran, Iran.
E-mail: {lida_tafaghodi, seyedhoseini}@yahoo.com, amakui@iust.ac.ir
Received April 7th, 2011; revised May 30th, 2011; accepted June 1st, 2011.
Keywords: Integrated Forward/Reverse Logistics Network, Closed-Loop Supply Chain Network, Mixed-Integer Linear Programming, Multi-Objective Optimization, Capacity and Location Decision
ABSTRACT
In this study, the integrated forward/reverse logistics network is investigated, and a capacitated multi-stage logistics network design is proposed by formulating a generalized logistics network problem into a bi-objective mixed-integer programming model (MIP). The purpose is to minimize the total costs and maximize the responsiveness of the closedloop supply chain network simultaneously. Moreover branch and bound algorithm is applied to find a global optimum for this model which provides the decisions related to the facility location problem, optimum quantity of shipped product, and facility capacity. Finally, a numerical example is conducted in order to show the power of the proposed MIP model to avoid the sub-optimality caused by separate design of the forward and reverse logistics networks. It has been shown that such an approach can significantly help the managers to make decisions about the problems associated with integrated logistics network design.
1. Introduction
Logistics network design provides an optimal platform for efficient and effective supply chain management (SCM). It is an important and strategic operations management problem in SCM, which usually involves multiple and conflicting objectives such as cost, service level, resource utilization, responsiveness etc. In general, logistics network design decisions include determining the numbers, locations, and capacities of facilities and the quantity of the flow between them [1]. Since opening and closing a facility is an expensive and time-consuming process, making changes in facility location decisions is impossible in a short run. Because tactical and operational decisions are determined after the strategic decisions, the configuration of logistics network will become a constraint for tactical and operational level decisions [2].
In the last decade, because of legal requirements, environmental protection and also related economic benefits, many companies such as Dell, General Motors, Kodak, and Xerox focused on remanufacturing and recovery activities and have met with notable successes in this area [3,4]. In the recent years, some researches [3,5] classify driving forces led to increased interest and investment in reverse supply chain into two groups: environmental factors and business factors. Reverse logistics network design includes determining the numbers, locations, and capacities of collection, recovery and disposal centers, buffer inventories in each site, and the quantity of flow between each pair of facilities.
In most of the past researches the design of forward and reverse logistics networks is considered separately which may lead to sub-optimal design, but due to the fact that the configuration of the reverse logistics network has a strong influence on the forward logistics network and vice versa; designing the forward and reverse logistics should be integrated [6]. Previous research in the area of forward, reverse, and integrated logistics network design is often limited to only considering a single capacity level for each facility and often has not addressed how facility capacity for reverse and forward activity can be determined [1]. Nevertheless, capacity levels are important decision variables in real-life applications due to their significant effect on logistics network efficiency.
In this paper, specific network design problems for forward, reverse and integrated supply chain design problems are reviewed. To assess the related literature review, the state-of-the-art of classification of logistics network design problem has been provided in [7,8], in these study the classification is developed according to four general specifications: problem definitions, modeling, outputs and objectives and the available models in the literature in the last decade.
As cost pressures continues, a growing number of firms have begun to explore the possibility of managing product returns in a more cost-efficient and timely manner. However, in logistics network design few studies have addressed the problems involve multiple and conflicting objectives such as total costs and network’s responsiveness. To fill the void in the mentioned line of research, a mathematical model and a genetic algorithm that can solve the reverse logistics problem involving both spatial and temporal consolidation of returned products, is proposed [9]. Tardiness and total costs are minimized for location and capacity decisions in a closed-loop logistics network operated by third party logistics providers [10]. A new solution procedure based on genetic algorithms is proposed to find the set of Pareto-optimal solutions for multi-objective supply chain network design problem [11]. The rest of this paper is organized as follows. After defining the problem of the present work in second section, a generalized mixed integer programming (MIP) formulation model is developed in third section. In forth section the solution method is described. In addition, the application of the model is shown with a numerical example in fifth section. Finally, concluding remarks and some possible future works are given.
2. Problem Definition
To continue and developed our previous research [8] on logistics network design, Unlike the previous studies the integrated logistics network (ILN) discussed in this paper is a multi-stage logistics network including production, distribution, customer zones, collection, recovery and disposal centers with multi-level capacities. The main differences of the proposed bi-objective model compared to existing location models lies in handing forward and reverse flows simultaneously. Moreover, the problem involves multiple and conflicting objectives of total costs and network’s responsiveness.
As illustrated in Figure 1, in the forward network, new products are shipped from production centers to customer zones through distribution centers to meet the demand of each customer in different time periods. Customer zones are assumed to be predetermined and fixed. In the reverse network, returned products are collected in collection
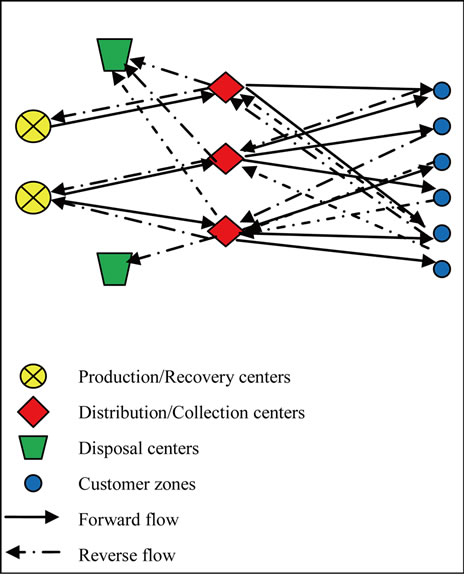
Figure 1. An integrated forward/reverse logistics network.
centers and, after testing, the recoverable products are shipped to recovery facilities, and scrapped products are shipped to disposal centers. It has been discussed that in an integrated logistics network, hybrid processing facilities offer potential cost savings compared to separate distribution or collection centers [6]. Thus, in this paper the ILN is considered a hybrid distribution-collection facility.
In the forward flow, products are pulled through a divergent network while in the reverse flow, returned products are shipped through a semi-convergent network according to push principles. After satisfying the demands, a pre-defined percentage of the demand from each customer zone is assumed to be returned and the average disposal fraction is also considered as a pre-defined constant.
Besides determining the number and location of facilities, another major issue is the decision on the capacity levels of facilities in order to achieve both minimal costs and maximal network’s responsiveness. In addition, the important problems addressed in this study are as follows: Determining the production, recovery, distribution and collection capacity, as well as the product flow between the facilities.
It is important to note that the design of the integrated logistics network may involve a trade-off between the total costs and the network’s responsiveness. For example, in some cases, the companies may need to open more facilities in order to increase the responsiveness for higher customer satisfaction, although it may lead to a greater investment cost. Basically the ILN is designed to simultaneously take network costs and network’s responsiveness into account.
3. Mathematical Model
The list of indices, parameters and decision variables are introduced for problem formulation:
Sets and Indices:
 : Set of potential production/recovery center locations
 .
.
 : Set of potential distribution/collection center locations
 .
.
 : Fixed locations of customer zones
 .
.
 : Set of disposal center locations
 .
.
 : Set of capacity levels available for facilities
 .
.
Parameters:
 : Demand of customer zone
 : Rate of return of used products from customer zone
 : Average disposal fraction
 : Warehousing cost of distribution/collection center
 : Fixed cost of opening production/recovery center
  with capacity level
 : Fixed cost of opening distribution/collection center
  with capacity level
 : Fixed cost of opening disposal center
  with capacity level
 : Shipping cost per unit of products from production/recovery center
  to distribution/collection center
 : Shipping cost per unit of products from distribution/collection center
  to customer zone
 : Shipping cost per unit of returned products from customer zone
  to distribution/collection center
 : Shipping cost per unit of recoverable products from distribution/collection center
  to production/ recovery center
 : Shipping cost per unit of scrapped products from distribution/collection center
  to disposal center
 : Total capacity with level
  for production/recovery center
 : Total capacity with level
  for distribution/collection center
 : Capacity with level
  for disposal center
 : Manufacturing cost per unit of product at production/recovery center
 : Recovery cost per unit of product at production/recovery center
 : Distribution cost per unit of product at distribution/collection center
 : Collection cost per unit of product at distribution/collection center
 : Disposal cost per unit of product at disposal center
 : Weighting factor (importance) for the forward responsiveness in second objective function
( ): Weighting factor (importance) for the reverse responsiveness in second objective function
 : Delivery time from distribution/collection center
  to customer zone
 : Collection time from customer zone
  to distribution/collection center
 : Expected delivery time in forward network
 : Expected collection time in reverse network
Decision variables:
 : Inventory of products in distribution center
 : Capacity of production for production/recovery center
 : Capacity of recovery for production/recovery center
 : Capacity of distribution for distribution/ collection center
 : Capacity of collection/inspection for distribution/collection center
 : Quantity of products shipped from production/ recovery center
  to distribution center
 : Quantity of products shipped from distribution/ collection center
  to customer zone
 : Quantity of returned products shipped from customer zone
  to distribution/collection center
 : Quantity of recoverable products shipped from distribution/collection center
  to production/recovery center
 : Quantity of scrapped products shipped from distribution/collection center
  to disposal center
 , if a production/recovery center with capacity level
  is opened at location
 ; 0, otherwise.
 , if a distribution/collection center with capacity level
  is opened at location
 ; 0, otherwise.
 , if a disposal center with capacity level
  is opened at location
 ; 0, otherwise.
In term of the above notation, the bi-objective ILN design problem can be formulated as follows. The first objective function minimizes the total costs consists of the fixed costs of opening facilities, the transportation costs, the operation costs and the warehousing costs. The second objective function maximizes the total responsiveness including the forward and reverse responsiveness of the integrated network.
Min 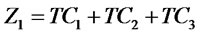 and Max
  (1)
(1)
Subject to the following constraints:
 (2)
(2)
 (3)
(3)
 (4)
(4)
 (5)
(5)
 (6)
(6)
 (7)
(7)
 (8)
(8)
 (9)
(9)
 (10)
(10)
 (11)
(11)
 (12)
(12)
 (13)
(13)
 (14)
(14)
 (15)
(15)
 (16)
(16)
 (17)
(17)
 (18)
(18)
 (19)
(19)
 (20)
(20)

(21)
 (22)
(22)
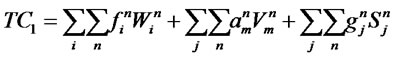
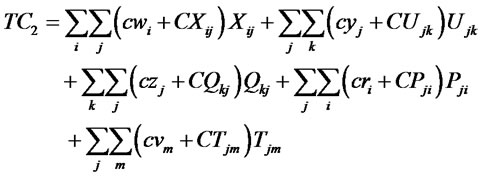
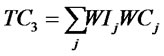
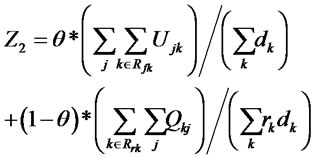
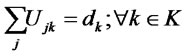
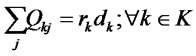
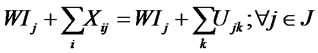
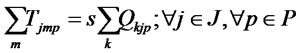
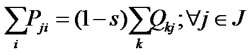
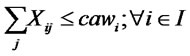
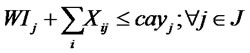
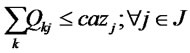
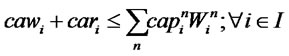
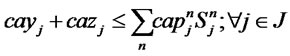
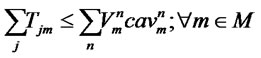
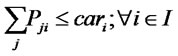
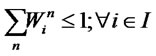
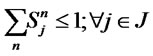
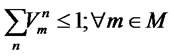
The first and second objective functions (1) demonstrate the considered total costs and total responsiveness in order. Term TC1 in (2) is the fixed opening costs of production/recovery, distribution/collection and disposal centers. Term TC2 in (3) denotes cost of transporting products in forward and reverse networks and operation costs. Term TC3 in (4) stands for warehousing cost in distribution/collection centers. The total responsiveness including the forward and reverse responsiveness of the integrated network is shown by (5). Constraints (6) and (7) ensure that the demands of all customers are satisfied and returned products from all customers are collected. Constraints (8)-(10) assure the flow balance at production/recovery, distribution/collection centers in forward and reverse flows. Equations (11)-(18) are capacity constraints on facilities. Equations (18)-(20) are logical constraints related to the different capacity levels. Finally, Constraints (21) and (22) enforce the binary and nonnegativity restrictions on corresponding decision variables.
4. Solution Method
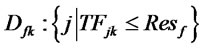
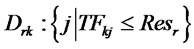
In order to solve the proposed mixed integer programming (MIP) problem, the branch and bound algorithm is applied by using LINGO software. Also, the bi-objective model is converted to the single objective model by using the bounded objective method and considering the second objective as a constraint. A desired definite minimum value,  , is defined for total responsiveness which can be determined unanimously by distribution/collection centers. Two constraints
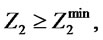
 have been incorporated in the proposed model. According to the definition that has been stated in [12], branch and bound algorithms for binary MIPs work by fixing the values of some (or all) of the binary variables and then solving the corresponding relaxation. The selected variables and their assigned values are determined based on an educated guess considering desired outcomes. The algorithm begins by solving the LP relaxation for the original MIP. If there is no feasible solution, then there is no feasible solution for the MIP so the algorithm terminates. If the solution to the LP relaxation happens to have the property that all of the binary variables have values of either zero or one, then this is the optimal solution to the MIP, so the algorithm terminates. Considering the aforementioned points, in the next section a numerical example will be conducted for a data set. The efficacy and efficiency of the proposed model will be verified through this example.
5. An Illustrative Example and Discussions
To illustrate the properties of the problem and the modelthe proposed model is applied to a practical problem. The example contains three potential production/recovery centers, five potential distribution/collection (hybrid) centers, three potential disposal centers and four customer zones. It is assumed that each facility have four possible capacity levels but the production, recovery, distribution, and collection capacity are continuous decision variables. Other parameters are generated randomly using uniform distributions specified in Table 1.The numerical example has been formulated by using the proposed MILP model. Subsequently the branch-and-bound solution procedure has been applied. The problem is solved to optimality using LINGO 8.0 software and ran on an Intel Core 2 Duo 2.5 GHz PC.
The computational results associated with a global optimum solution is ;
;  =
= ;
;  yields 60619 for the objective function value. The optimal capacities for distribution, collection, production, and recovery operation are shown in Figures 2 and 3. Furthermore a sensitivity analysis has been conducted on the various values of
 . Based on its results that are shown in Figure 4, it can be concluded that the global optimum value of the first objective function (Total costs of supply chain) increases when the value of
  (which are set by distribution/collection centers) increases. Moreover, Figure 5 represents a sensitivity analysis on the weighting factors
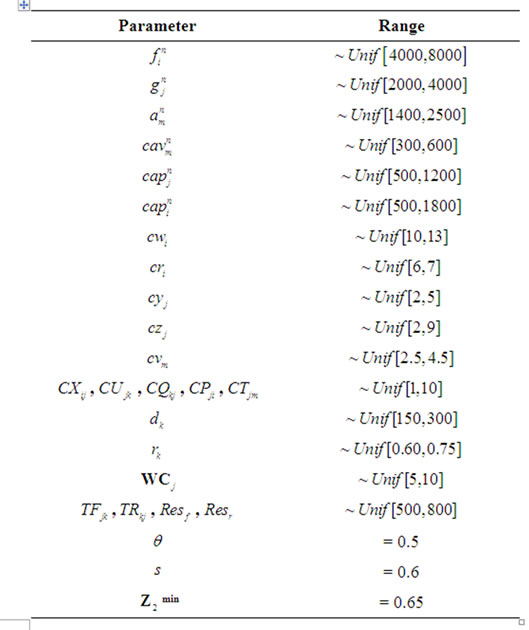
Table 1. The value of the parameters used in the example.
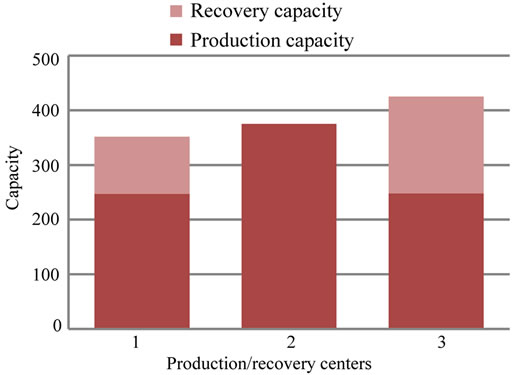
Figure 2. Allocated production and recovery capacity.
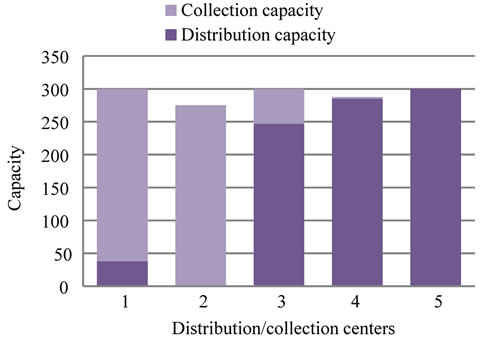
Figure 3. Allocated distribution and collection capacity.
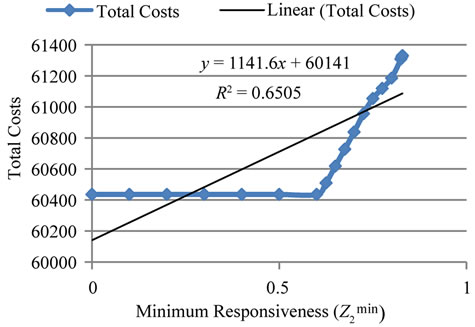
Figure 4. Sensitivity analysis related to various values of  (Minimum Responsiveness).
(importance) of the forward responsiveness ( ). Figure 5 confirms the influence of importance of the forward responsiveness in total costs. As illustrated in Figures 6 and 7, it is noticeable that the increase in demand and return ratio increases the total costs of network. In addition, the total cost is more sensitive to demand compared with return ratio. This result could be clarified by the impact of demand on the both forward and reverse networks’ costs, but the increase in return ratio mean only influences the reverse network’s costs.
6. Conclusions and Future Research
The importance of network costs and responsiveness in supply chain management and reverse logistics activities has been significantly increased over the past years. This paper discusses forward/reverse logistics network design
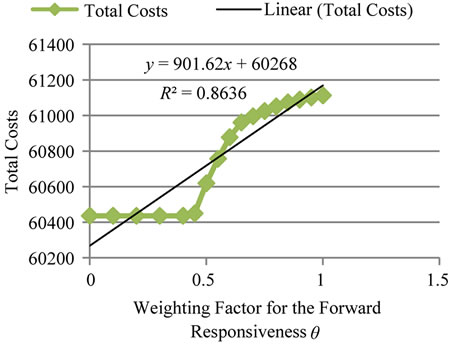
Figure 5. Sensitivity analysis on various values of θ (Weighting Factor for the Forward Responsiveness).
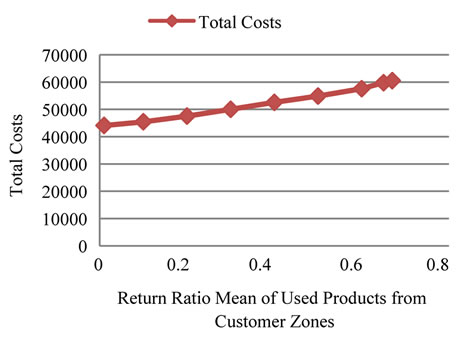
Figure 6. Influence of return ratio of used products from customer zones on network costs.
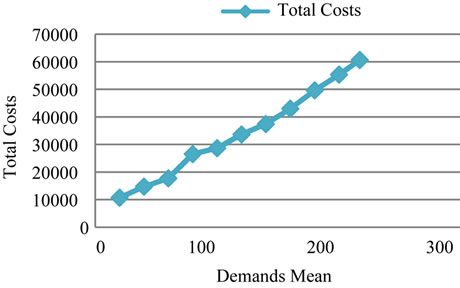
Figure 7. Influence of demand on network costs.
by considering closed-loop integrated forward/reverse logistics network including production/recovery, distribution/collection, customer, and disposal centers. The proposed bi-objective model is able to integrate the forward and reverse network design decisions to avoid the sub-optimality which is a result of separated and sequential designs. Computational results show that this MIP model can provide an efficient opportunity for managers to make proper decisions for designing logistics network among various facilities with various capacity levels. Thus, the proposed model can be used as a powerful tool in practical cases.
For future research the model can be expanded to include the elements of risk and uncertainty involved in the reverse logistics network design problem. In addition, addressing the multi-objective treatments which explicitly analyze the tradeoffs among cost, market potential and speedy returns in a multi-product integrated logistics network is a promising research avenue. Although exact solution for small incidents of the proposed model can be obtained by optimization software such as LINGO, metaheuristic methods e.g. genetic algorithm (GA), are applicable for fast exploration in large scale problems and can be considered as an efficient research in future.
REFERENCES
- A. Amiri, “Designing a Distribution Network in a Supply Chain System: Formulation and Efficient Solution Procedure,” European Journal of Operational Research, Vol. 171, No. 2, June 2006, pp. 567-576. doi:10.1016/j.ejor.2004.09.018
- Y. Meepetchdee and N. Shah, “Logistical Network Design with Robustness and Complexity Considerations,” International Journal of Physical Distribution & Logistics Management, Vol. 37, No. 3, 2007, pp. 201-222.
- L. Meade, J. Sarkis and A. Presley, “The Theory and Practice of Reverse Logistics,” International Journal of Logistics System Management, Vol. 3, No. 1, January 2007, pp. 56-84. doi:10.1504/IJLSM.2007.012070
- H. Üster, G. Easwaran, E. Akçali and S. Çetinkaya, “Benders Decomposition with Alternative Multiple Cuts for a Multi-Product Closed-Loop Supply Chain Network Design Model,” Naval Reveres Logistics, Vol. 54, No. 8, September 2007, pp. 890-907.
- P. Tsiakis and L. G. Papageorgiou, “Optimal Production Allocation and Distribution Supply Chain Networks,” International Journal of Production Economics, Vol. 111, No. 2, February 2008, pp. 468-483. doi:10.1016/j.ijpe.2007.02.035
- D. Lee and M. Dong, “A Heuristic Approach to Logistics Network Design for End-of Lease Computer Products Recovery,” Transportation Research Part E, Vol. 44, No. 3, May 2008, pp. 455-474. doi:10.1016/j.tre.2006.11.003
- L. T. Khajavi, “Proposing an Optimization Model for Integrated Forward/Reverse Logistics Network Design Under Uncertainty,” M.S. Dissertation, Department of Industrial Engineering, Iran University of Science and Technology (IUST), Tehran, 2011.
- S. M. Seyed-Hosseini, L. T. Khajavi and A. Makui, “An Optimization Model to Develop an Integrated Logistics Network under Periodic Demand,” Academy of Business Research, Spring 2011 Meeting, New Orleans, 16-18 March 2011.
- H. Min, C. S. Ko and H. J. Ko, “The Spatial and Temporal Consolidation of Returned Products in a Closed-Loop Supply Chain Network,” Computers & Industrial Engineering, Vol. 51, No. 2, October 2006, pp. 309-320. doi:10.1016/j.cie.2006.02.010
- F. Du and G. W. Evans, “A Bi-Objective Reverse Logistics Network Analysis for Post-Sale Service,” Computers & Operations Research, Vol. 35, No. 8, August 2008, pp. 2617-2634.
- F. Altiparmak, M. Gen, L. Lin and T. Paksoy, “A Genetic Algorithm Approach for Multi-Objective Optimization of Supply Chain Networks,” Computers & Industrial Engineering, Vol. 51, No. 1, September 2006, pp. 196-215. doi:10.1016/j.cie.2006.07.011
- S. Voss and L. D. Woodruff, “Introduction to Computational Optimization Models for Production Planning in a Supply Chain,” Springer, New York, 2005.